Search results
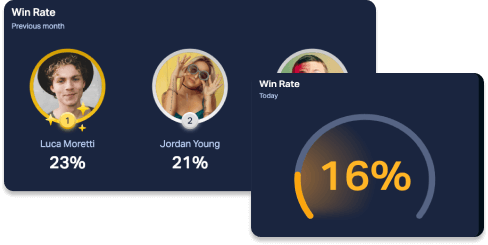
Sales Win Rate 💰
The percentage of successful sales from created opportunities and/or new prospects over a specific period of time.
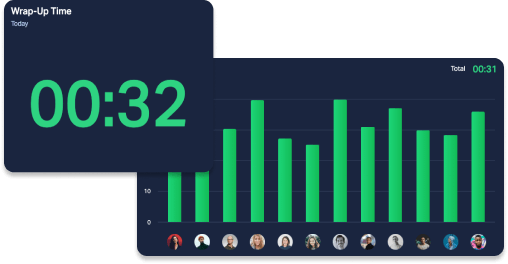
Wrap-up Time ☎️
The time customer support staff spend on call-related tasks after ending a call.
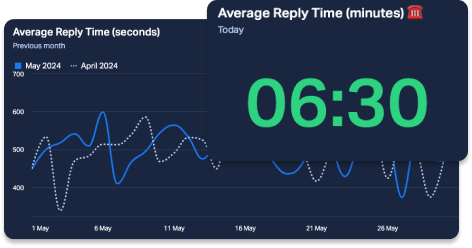
Average Reply Time 💬
The average time it takes for an agent to respond to a customer query.
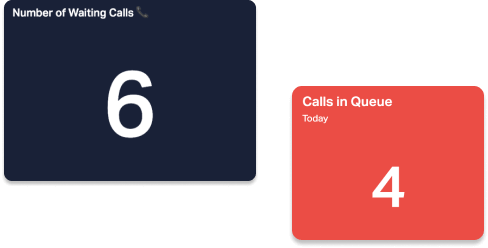
Number of Waiting Calls ☎️
The number of calls that need to be answered as soon as possible.
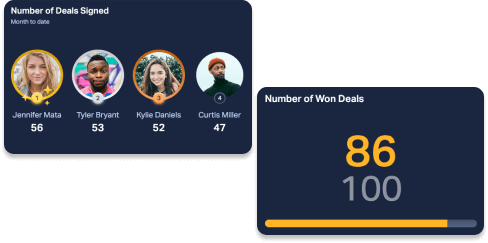
Number of Won Deals 🤝
The number of opportunities that become clients.
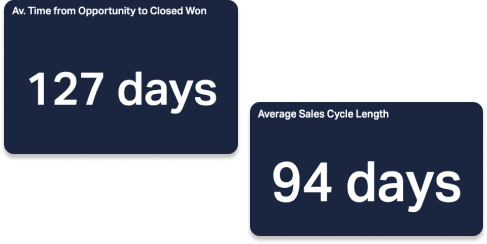
Average Sales Cycle Length ⏰
The average length of time it takes your company to close deals with clients.
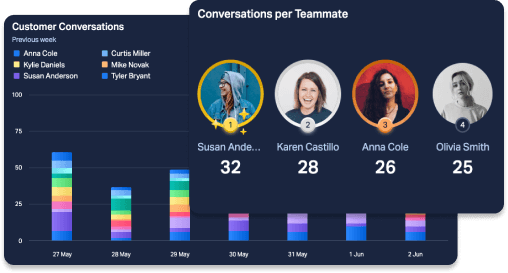
Conversations per Teammate 💬
The number of interactions your support staff has had with customers.
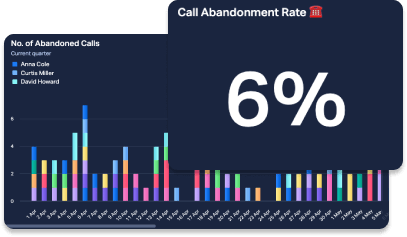
Call Abandonment Rate ☎️
The percentage of calls abandoned by customers before they’re reached by an agent.
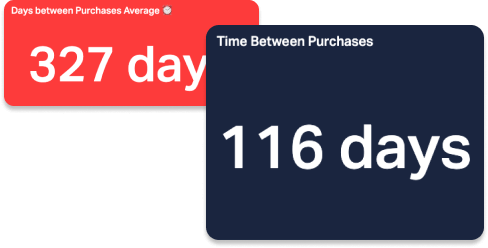
Time Between Purchases 🛍️
The average number of days between a customer’s purchases.
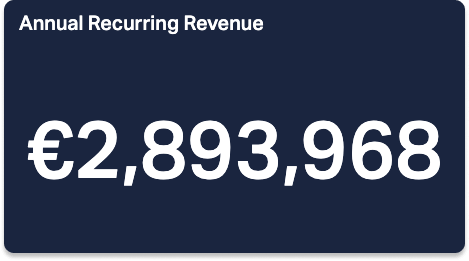
Annual Recurring Revenue (ARR) 💰
Expected yearly revenue based on your current subscriptions.
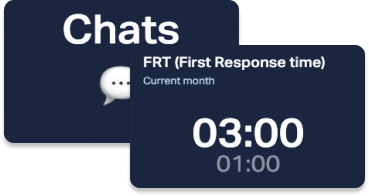
First Response Time 💬
The average (mean) time it takes to first respond to a customer query.

Number of Booked Meetings 🤝
Number of pending meetings in a period.
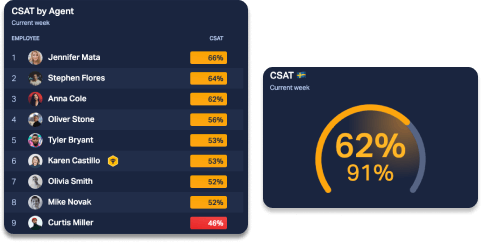
Customer Satisfaction (CSAT) ⭐️
The measure of how satisfied your customers are with your product or service.
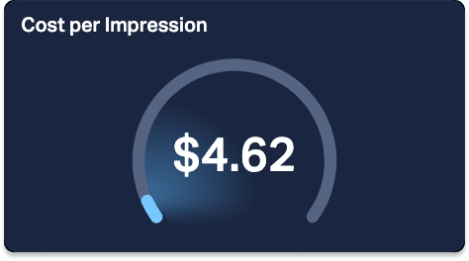
Cost per Impression 🎯
The cost a company pays for every impression their ad gets.
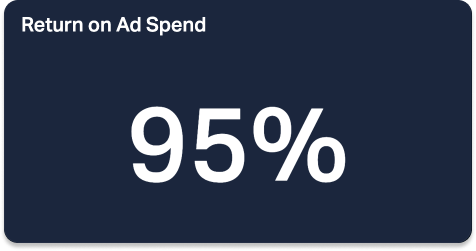
Return on Ad Spend 🎯
Total revenue generated by a specific channel compared to the total spent on ads in that channel.
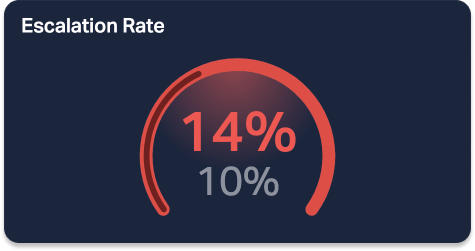
Escalation Rate 💬
The percentage of customer support tickets that have risen to the next support level.
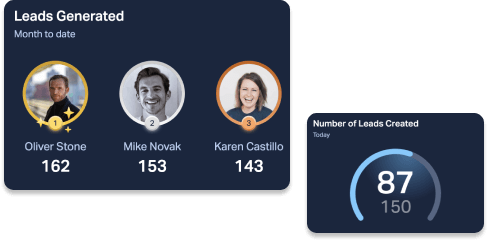
Number of Leads Created 🎯
The number of potential customers that have shown interest in your company or product.
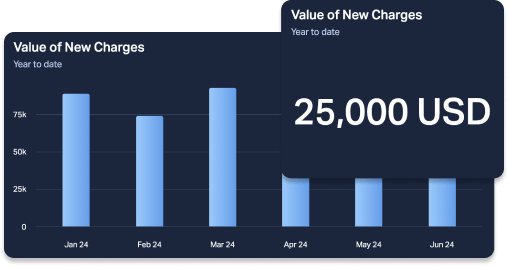
Value of New Charges 💰
Monetary value your company is receiving from the latest charges made to customers.
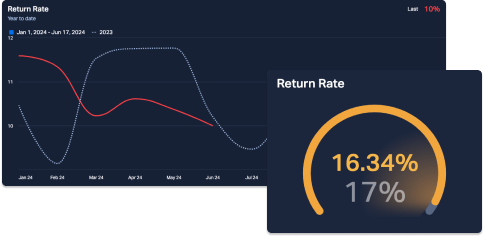
Rate of Return (RoR) 🛍️
The percentage of net gain or loss on an investment over a period.
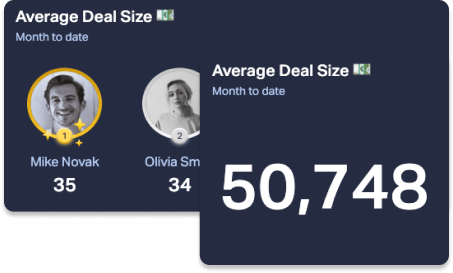
Average Deal Size 💰
Average amount of revenue your company earns per customer deal.
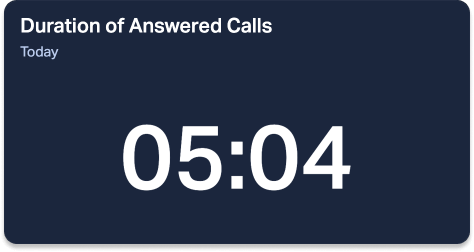
Duration of Answered Calls ☎️
Time spent by your agents in their most recent calls with clients.
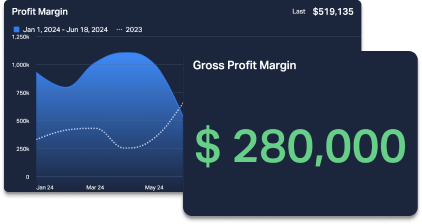
Gross Profit Margin 📈
A company’s profit after the cost of goods sold.
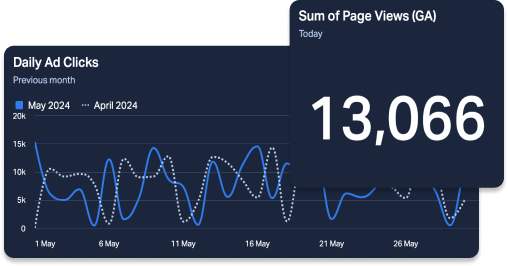
Number of Visitor Pageviews 🎯
Number of times a page has been viewed or refreshed within a period.
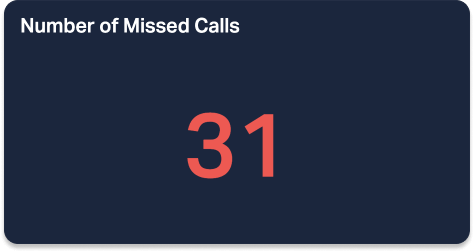
Number of Missed Calls ☎️
Total number of calls your agents haven’t answered in the last period.
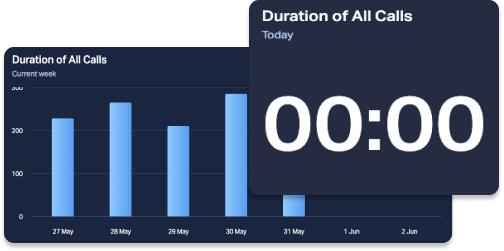
Duration of All Calls ☎️
Total time spent talking on the phone with potential or current customers per day.
Ad Spend per Won Deal 🎯
Measures your ad expenditure in relation to Won Deals.
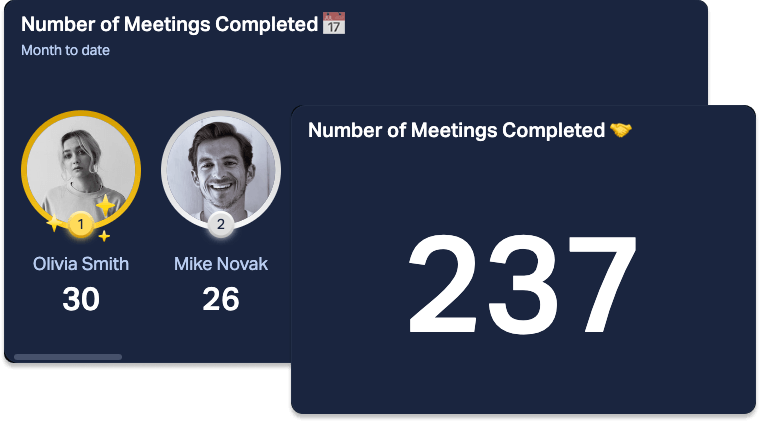
Number of Meetings Completed 🤝
Total number of meetings a team or employee has concluded in the last measured period.
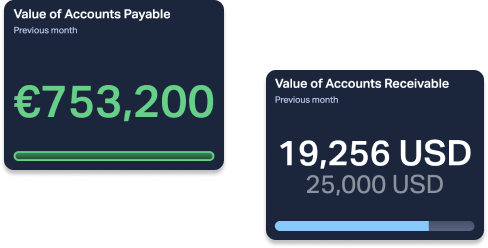
Accounts Receivable and Accounts Payable 💰
Customers’ credit purchases not yet paid.
A company’s credit purchases not yet paid.
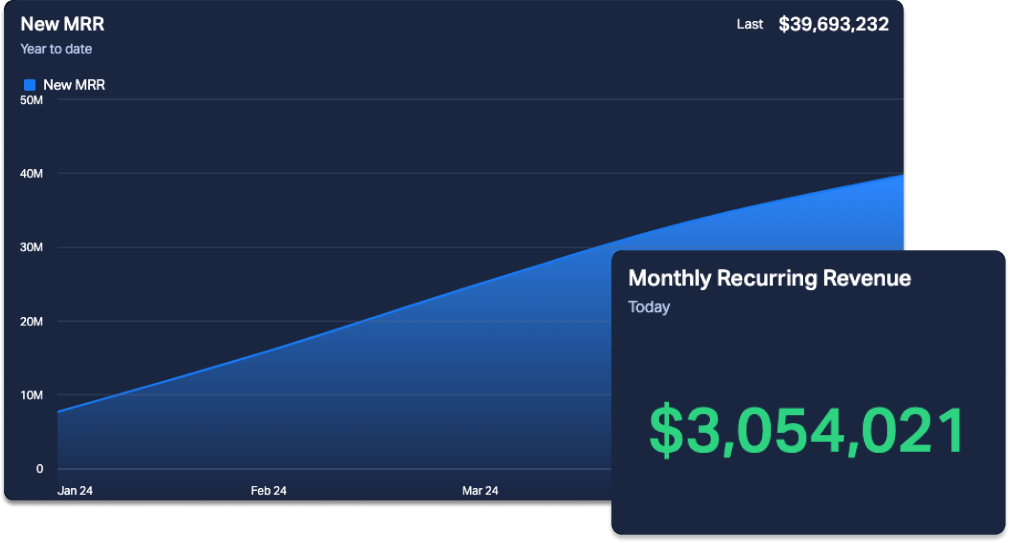
New MRR 💰
New subscriptions added within the month that contribute to your MRR.
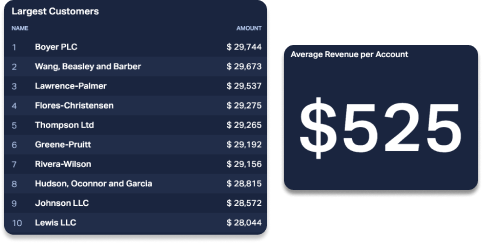
Average Revenue per Account (ARPA) 💰
The revenue generated by each account within a period.
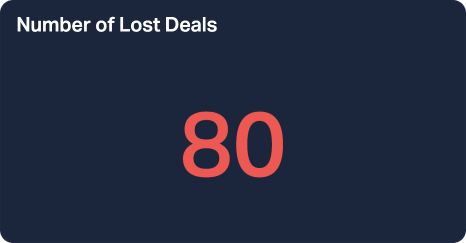
Number of Lost Deals 🤝
The number of opportunities that haven’t turned into clients.
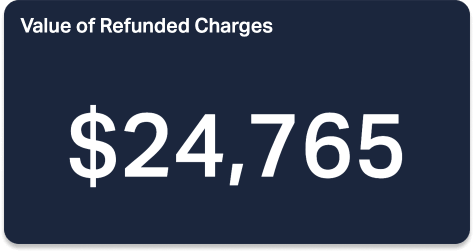
Value of Refunded Charges 💰
Total amount of money your company has returned to customers for illegitimate credit card charges.
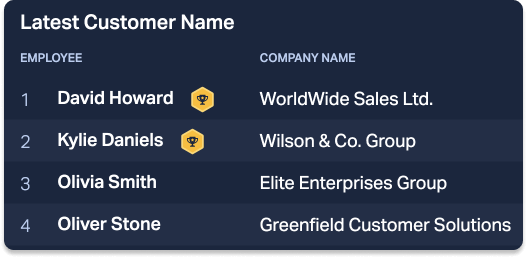
Latest Customer Name 💬
The name of the customer who has most recently subscribed to your product or service.
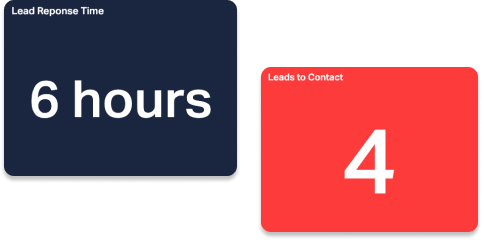
Lead Response Time 💬
The time it takes your sales team to follow up with a lead.
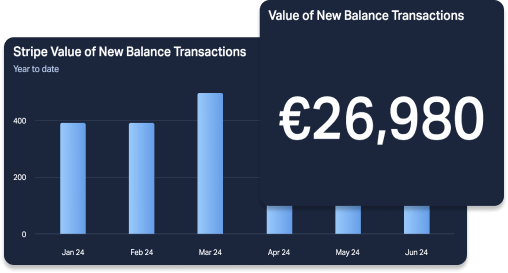
Value of New Balance Transactions💰
Amount you’ve spent on transactions in the last billing period.
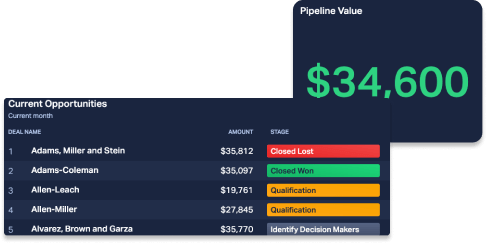
Weighted Pipeline Value 💰
Revenue estimate derived from probabilities of closing the deals in your sales pipeline.
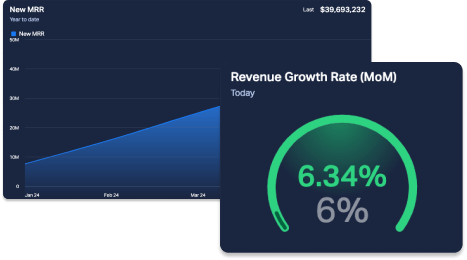
Revenue Growth Rate 📈
A company’s increase in revenue over a period.
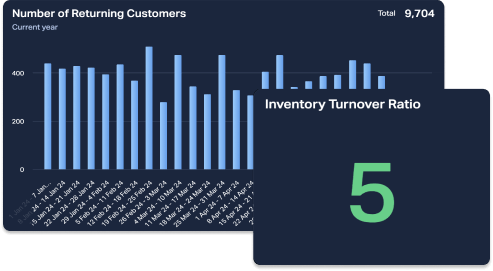
Inventory Turnover 🛍️
The number of times a business replaces its stock in a given period.
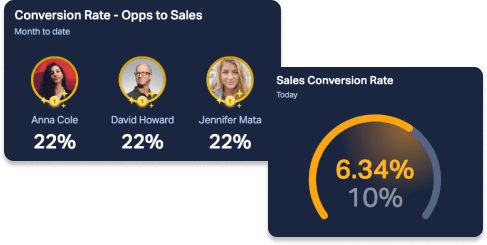
Sales Conversion Rate 🎯
The measure of how effectively you convert leads to sales.
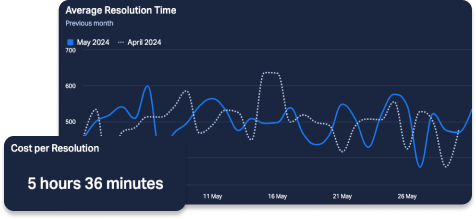
Average Resolution Time (ART) 💬
The average length of time for customer support to resolve customer issues.
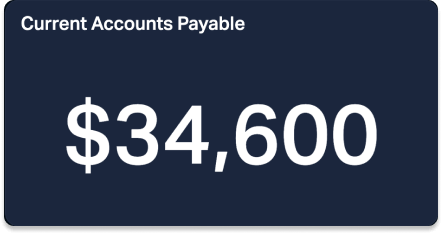
Current Accounts Payable 💰
A company’s short-term debt obligations.
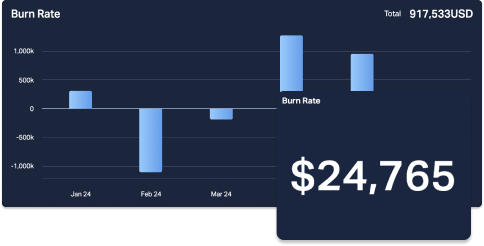
Burn Rate 📈
The rate at which a new or unprofitable company is consuming its cash reserves.
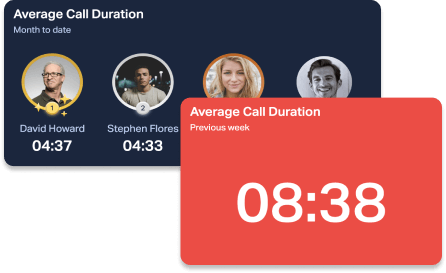
Average Call Duration ☎️
Average time spent by your support and sales reps in calls with customers.

Number of New Charges 📈
Total amount of new charges that your company has received in the last period.
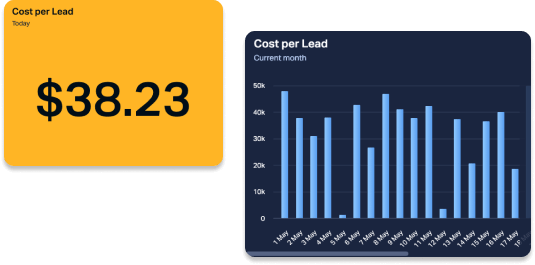
Cost per Lead (CPL) 🎯
The cost of advertising it takes for a company to obtain a new lead.
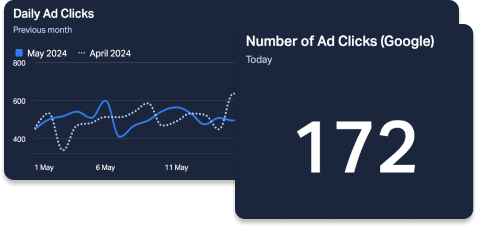
Number of Ad Clicks 🎯
Number of times one of your shown ads has received a click from your audience.
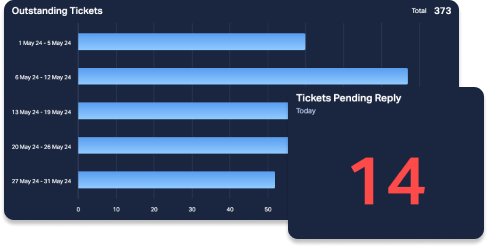
Ticket Backlog 💬
Unresolved number of customer tickets in a period.
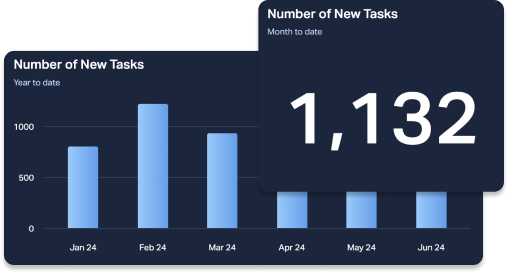
Number of New Tasks 📝
Count of your pending tasks.
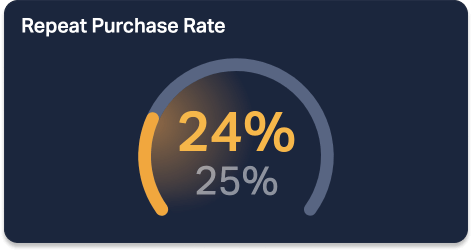
Repeat Purchase Rate 🛍️
The percentage of customers who make more than one purchase.
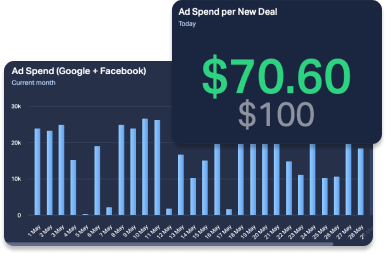
Ad Spend per New Deal 🎯
The average cost of advertising per new customer won.
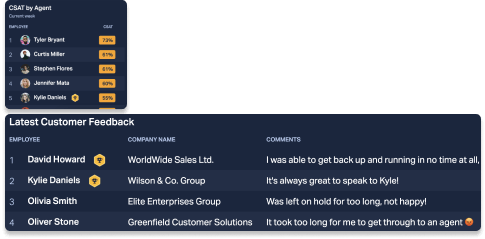
Latest Received Rating Comment ⭐️
The last person who posted an online review of your product or company.
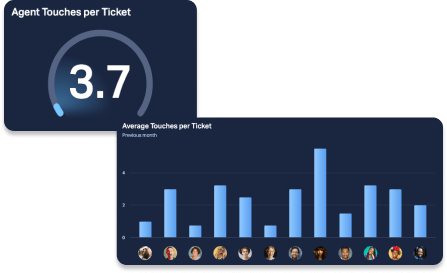
Agent Touches per Ticket / Replies per Resolution 💬
The average number of times an agent interacts with a customer ticket before resolution.
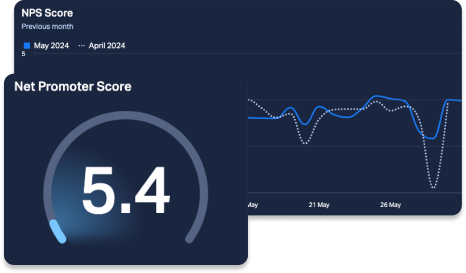
Net Promoter Score (NPS) ⭐️
The measure of how likely your customers are to recommend your product or service to others.
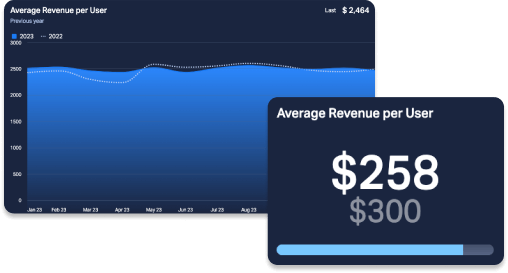
Average Revenue per User 💰
The average amount of revenue generated from each customer.
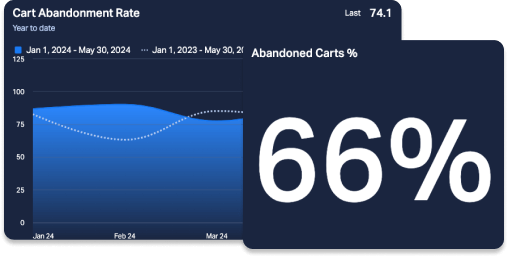
Cart Abandonment Rate 🛍️
The percentage of customers who abandon their online shopping carts before making a purchase.
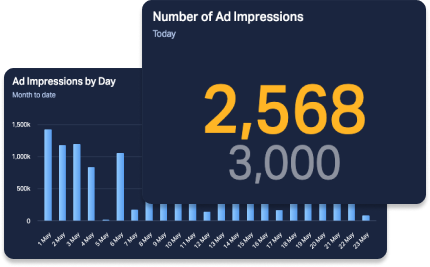
Number of Ad Impressions
Times your ad is seen by an audience on a specific platform.
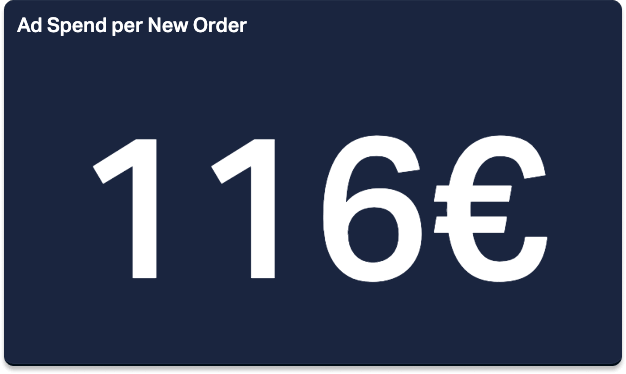
Ad Spend per New Order 💰
The average cost of advertising for every new order.
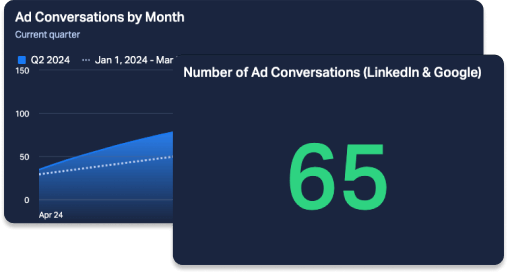
Number of Ad Conversions 🎯
Number of people that carry out a certain action after seeing your ad.
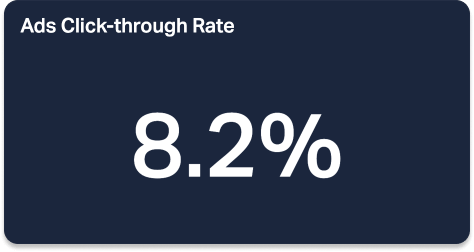
Ads Click-through Rate 🎯
Percentage of the people who see your ad that actually click on it.
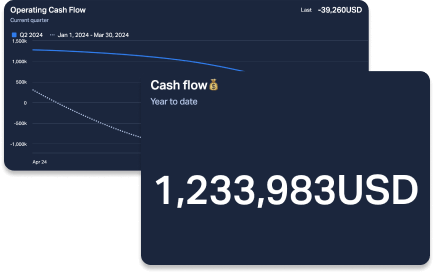
Operating Cash Flow (OCF) 📈
The net amount of cash a business earns from typical operations.
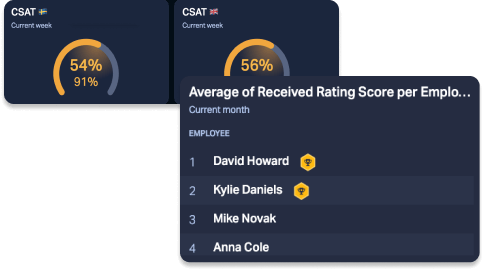
Average of Received Rating Score ⭐️
Average rating score clients gave your company in the last period.
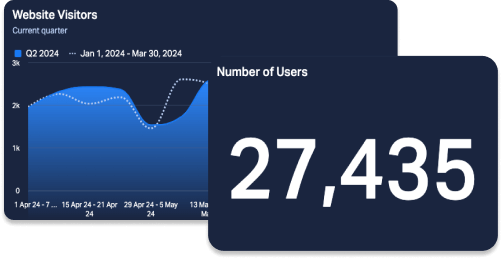
Number of Visitor Users 🎯
Updated number of users that have visited your website in a period.
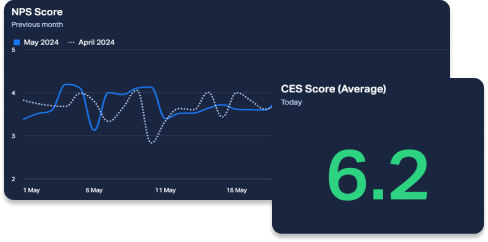
Customer Effort Score (CES) ⭐️
The measure of how efficiently your customers use your product, obtain needed information, and interact with your company personnel.
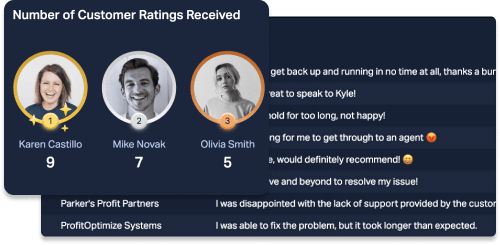
Number of Received Ratings ⭐️
The count of every time a user has written about your company online.
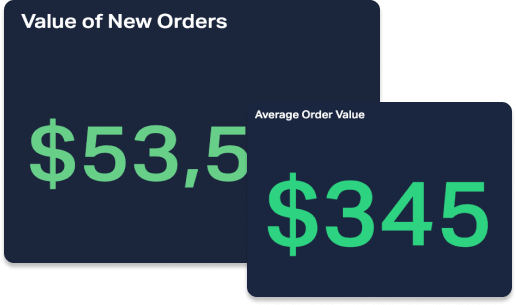
Value of New Orders + Average Order Value 💰
Monetary value of new orders made on your website.
Average amount your clients are spending on orders.
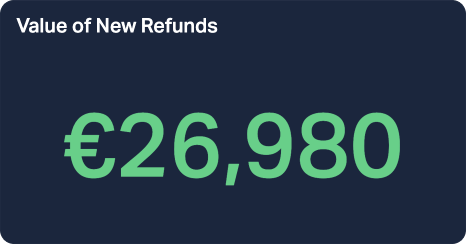
Value of New Refunds💰
Amount of money your company returns to customers who aren’t satisfied with the product or service they purchased.

Customer Acquisition Cost 💰
The cost needed to acquire a customer within a given period.
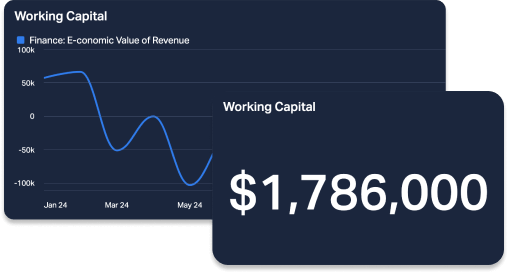
Working Capital 💰
The difference between a company’s current assets and current liabilities.
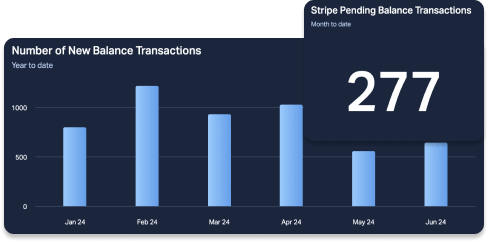
Number of New Balance Transactions 📈
Number of times a transaction has been made with the company’s credit card within the billing period.
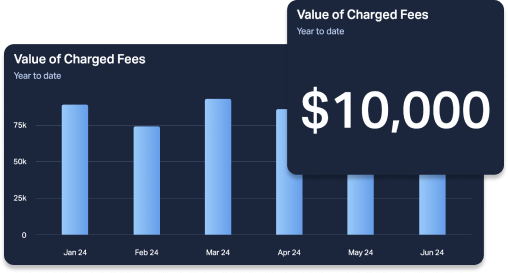
Value of Charged Fees 💰
Total amount of fees your company has charged in the last period.
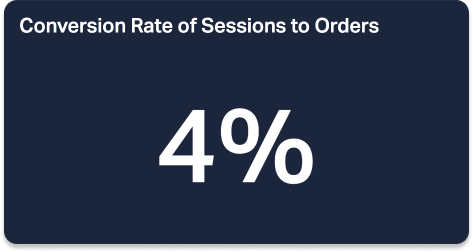
Conversion Rate of Sessions to Orders 🎯
Number of visitors to your website that actually buy something online.
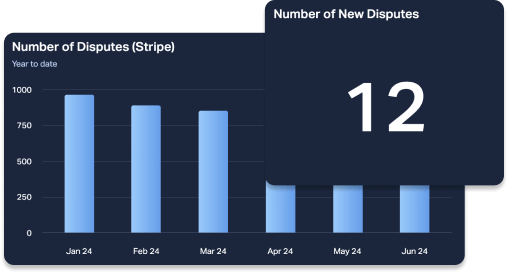
Number of New Disputes ❌
Number of times your customers have questioned your charges with their card issuers.

Number of Emails Sent 📩
Number of emails your reps have sent over a period.
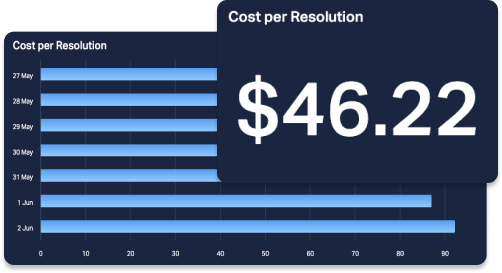
Cost per Resolution 💬
The average cost of resolving a ticket.
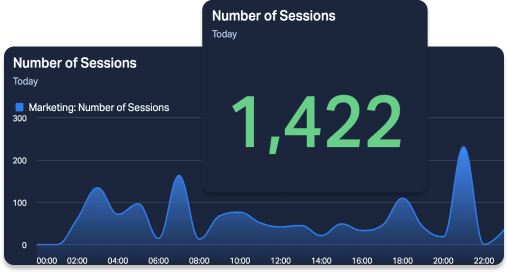
Number of Visitor Sessions 🎯
The group of interactions an individual visitor has with the different content on your website.
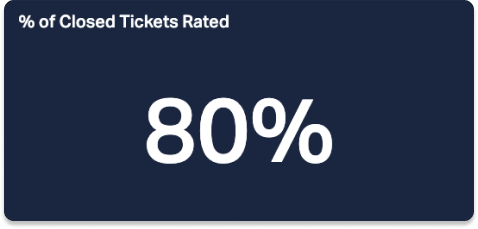
Percentage of Closed Support Tickets Rated ⭐️
Percentage of times you've been rated by customers after resolving their support tickets.
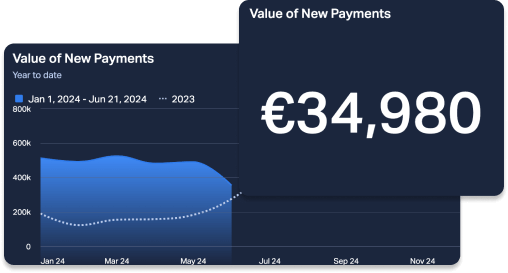
Value of New Payment Intents💰
Total monetary value of the payments from customers your company has collected over the last period.
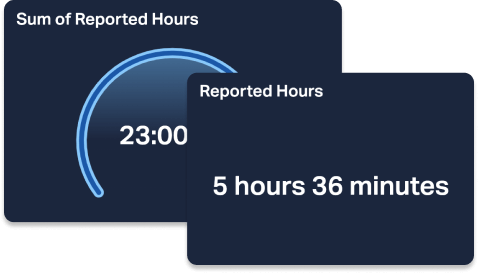
Sum of Reported Hours ⏰
Total amount of hours a consultant has been hired for by another company.

Number of New Issues
Amount of new tickets aimed for the development team over the last period.

Number of New Customers
Total amount of opportunities that have turned into clients in the last period.
Total Ad Spend
Updated amount that has been spent on ads in the last period.

Answered Calls Rate
Percentage of calls that have been answered compared to the total amount of received calls over the last period.

Oldest Unanswered Ticket
The clients that have been waiting for the longest for your team to reply to their ticket.
Number of Completed Issues
Amount of tickets that have been solved by the development team over the last period.
Value of Invoices
Amount of money that the company is spending on paying its various invoices.
Number of Active Subscriptions
Amount of users that have converted into paying subscribers.
Monthly Recurring Revenue (MRR)
Revenue you get on a monthly basis per new customer that your company gets.
Average Billable Rate
Average amount of money a company pays to hire one of your consultants.

Churn MRR
Part of the MRR lost due to customers’ cancellations.

Invoice Due Date
Invoice Amount Paid
Average First Response Time: Chats

Latest Call Status
Latest Chat Rating
Latest Chat Rating Comment

Latest Closed Support Ticket Description
Latest Completed Tasks
Latest Conversation Status
Latest Invoice Status
Latest Meeting Description
Latest Meeting Duration
Latest Meeting Status
Latest Order Fulfillment Status
Latest Order Number
Latest Payment Status
Latest Rating Score
Latest Support Ticket Status
Latest Vendor Name
Max Response Time: Chats
Min Response Time: Chats
Number of Calls
Number of Cancelled Orders
Number of Chats
Number of Conversations
Latest Support Ticket Close Date
Latest Support Ticket Created Date
Latest Missed Call Reason
Latest Missed Phone Number

Customer Waiting Since
Latest Dispute Status
Latest Milestone State
Latest Pull Request State
Latest Task Status
Average Call Abandon Time
Number of Abandoned Calls
Number of Opportunities
Number of Shipping Countries