
Real-time customer service KPI visualization
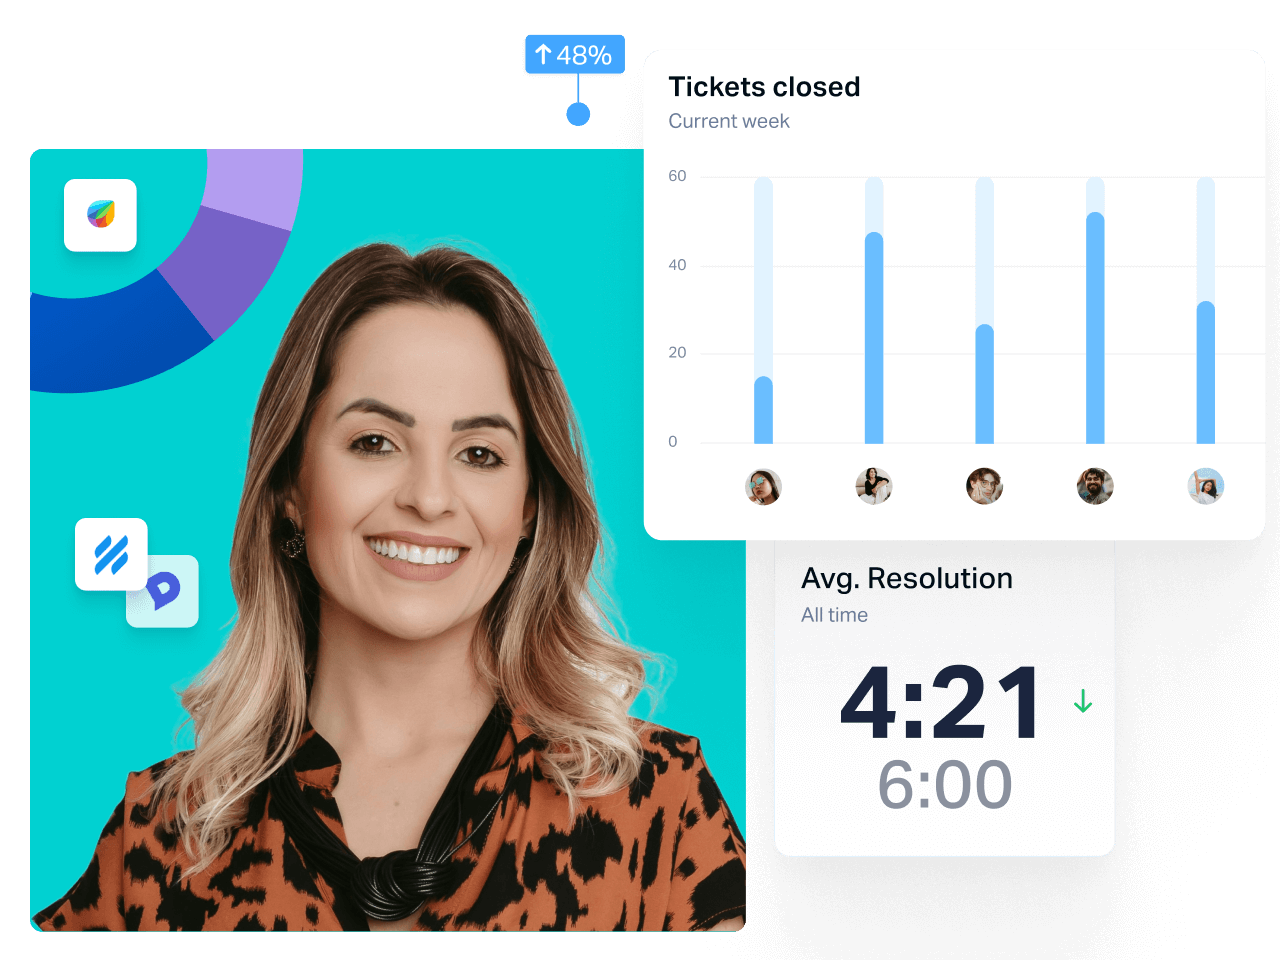
Visualize your queue, ticket, and response times in real time.
Harness real-time KPI visualization and motivating gamification to power your customer service team to support your customers even quicker, and better than before.

Features
How Plecto helps reduce response time by 50%
Live support KPI visualization
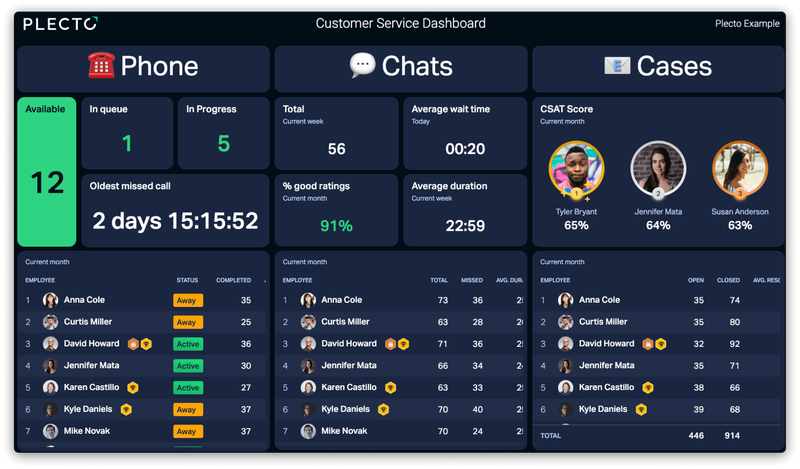
Visualize your call queue, tickets, and CSATs on easy-to-understand dashboards where you and your team can quickly react in real time.
Contests for friendly team fun
Avoid the service mood slump with fun, friendly competitions where all your team work together to support customers even quicker.
Personal notifications
Recognize and re-ignite your employee's motivation with notifications you can show on TV screens, or keep the kudos to a one-on-one message.
Reduce queues and response times with real-time dashboards
Customers hate waiting. Respond faster than your competitors.
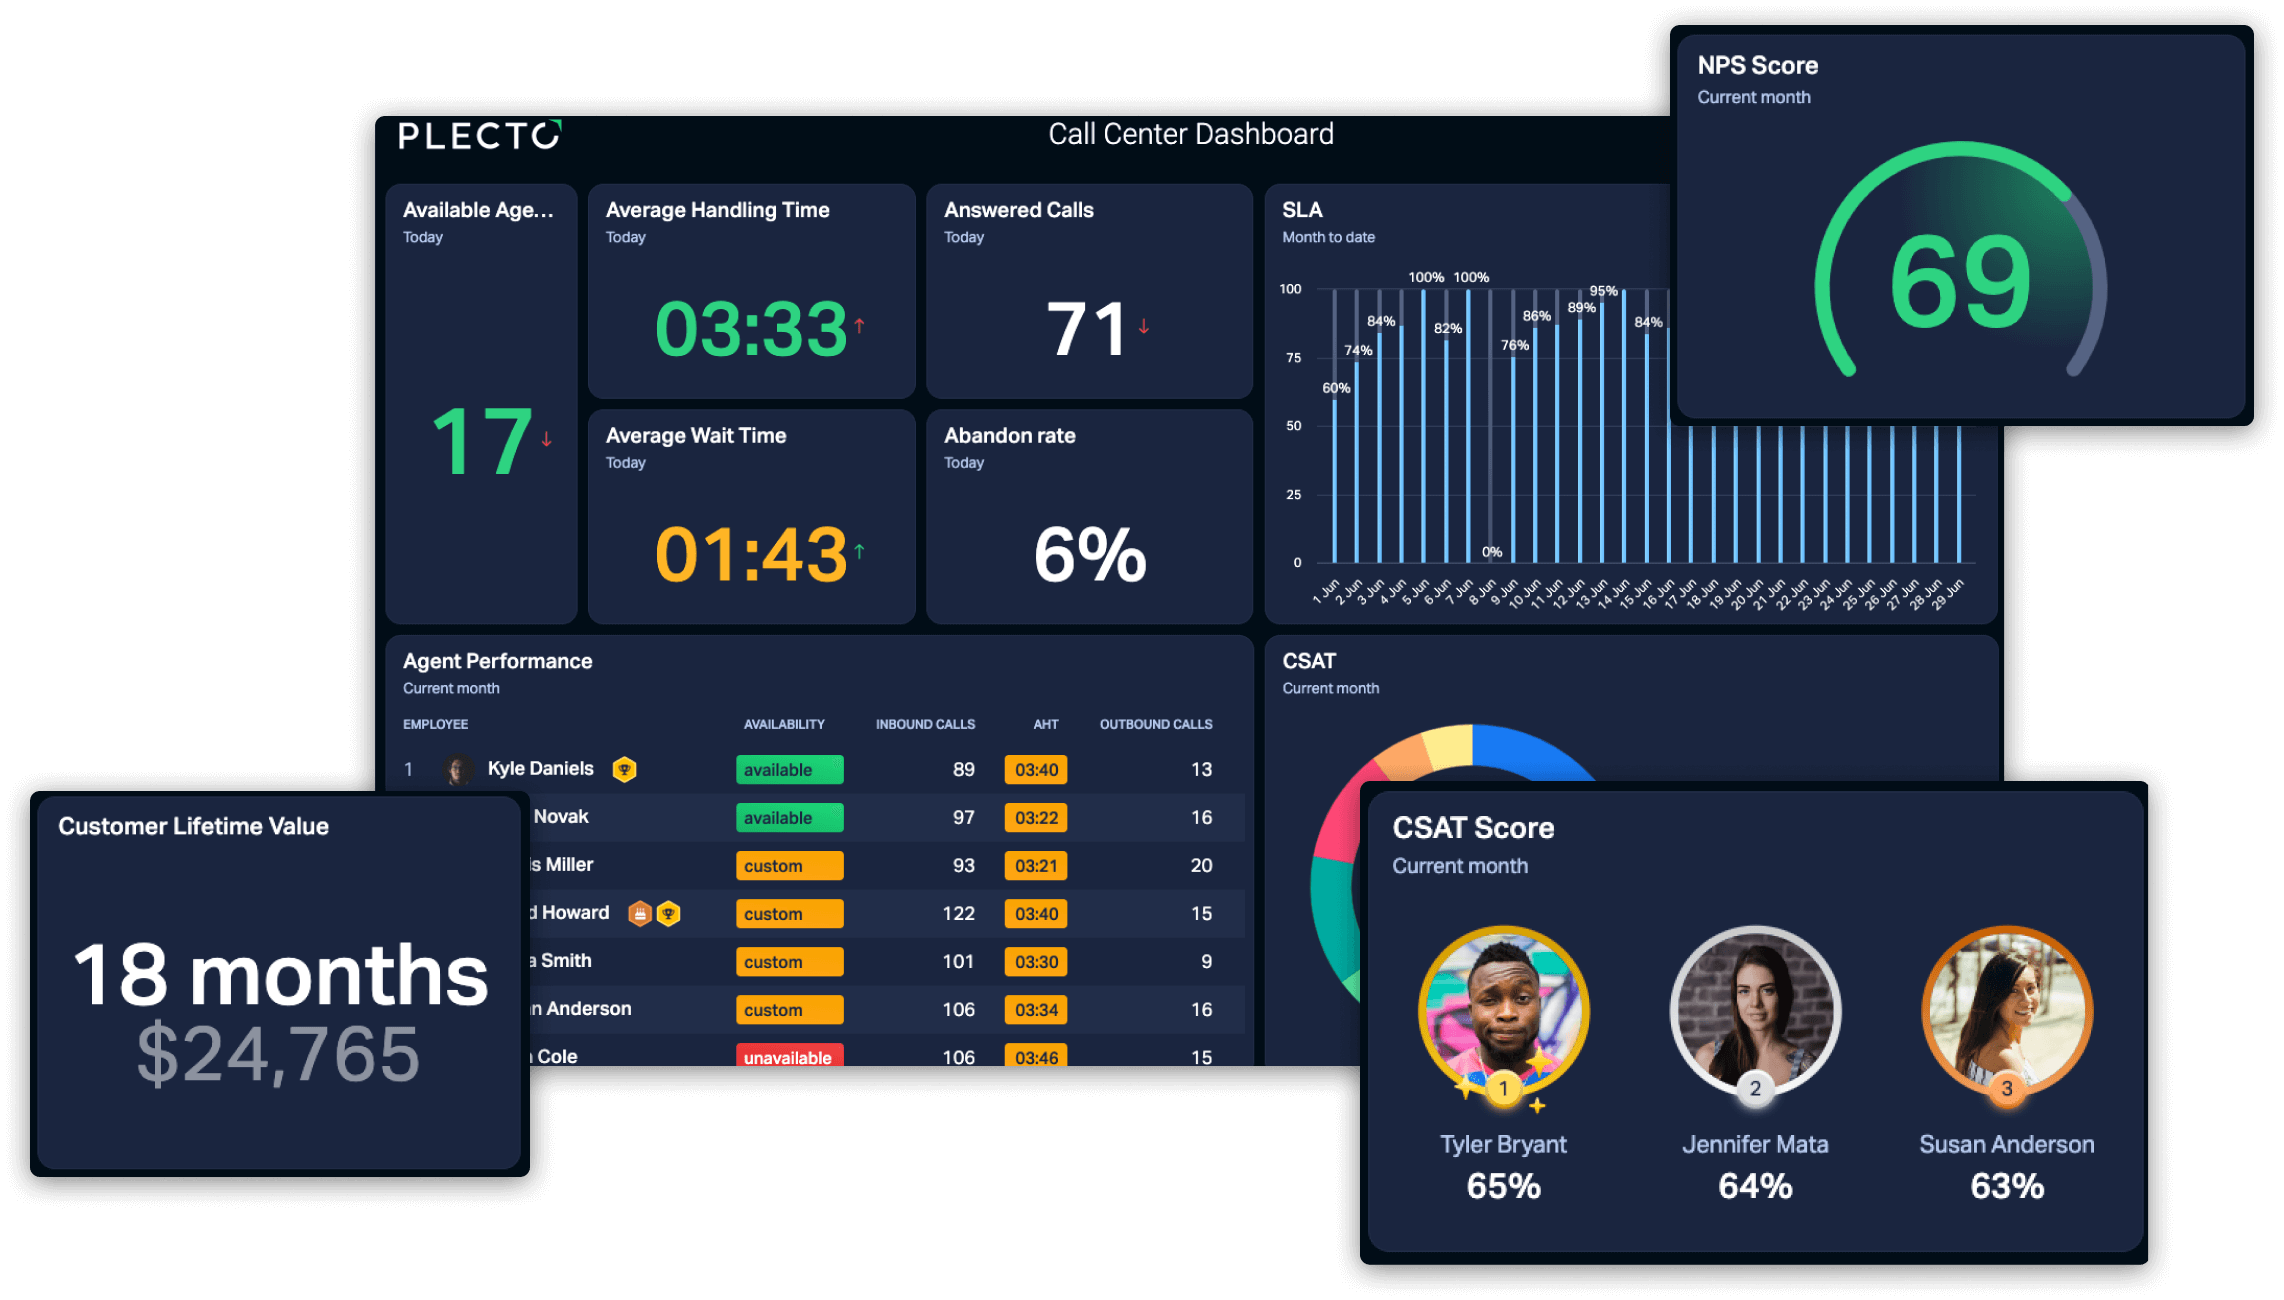
Show key team KPIs on screens around the office to spot areas where your agents can jump on different channels and help speed up your response time:
- Calls waiting, unsolved cases or tickets, or chats open or queued
- Agent availability
- Response time
- Wait time
Maximize motivation and celebrate your support team with gamification
Liven up your employees' everyday tasks with contests and more gamification features:
- Get your team working together to resolve tickets during a quick 2-day contest
- Give your selfless customer service agents some kudos for their hard work with celebratory notifications
- Award your employee who answers the most chats, calls, or cases with a virtual badge to ensure they feel valued
- The team reached a 95% CSAT? Offer them the chance to win a real-world reward from Plecto's Reward Store

“With Plecto, we shortened our response time from 6 minutes to 1 minute. The agents efficiency has definitely improved!”

Lennart Thomsen
System Responsible at REMA1000

“When we build up the team, we reached out to approximately 2000 customers a month, and now we reach out to around 3000 every month. This helps us reduce churn, and Plecto has definitely been a part of that journey.”

Nikolaj Boffy
Nordic Team Retention Manager, Nets A/S

Dashboards
Get started creating your customer service dashboards now.
Support data needs to be up to speed. We take care of the technical stuff, so you can focus on supporting your customers as best you can. You can get started visualizing the service and support KPIs you want in just a matter of minutes. Just pick how you'd like to get started!
Dashboard Builder
Select your system. Select your KPIs. Connect your own actual data. Done!
Drag-and-drop templates
Use building blocks by selecting from pre-made formulas and widgets made for teams like yours.
Dashboard templates
Download a complete dashboard based on a specific support system and KPI; for example, a Zendesk Chat dashboard.
Examples
Real-time service and support dashboard examples to inspire you
Get actionable, real-time insights into the performance of your customer service team with customizable dashboards for support teams.
Reward and celebrate the efforts of your support team
Working in customer service is no easy job, so introduce notifications, achievements and badges to recognize the top performance of your team members.
Learn more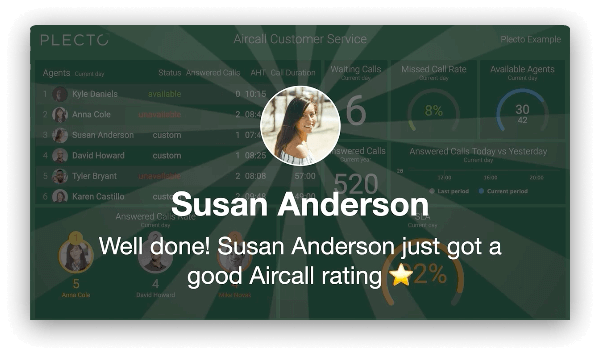
Get inspired with these customer service KPIs
Average Handling Time (AHT)
The average duration of a customer interaction.
Average First Response Time (FRT)
The average period of time it takes for an agent to respond to a customer query.
Average Time to Resolution
The average period of time it takes for a call, case or chat to be resolved.
Customer Satisfaction Score (CSAT)
Measure how happy customers are with the service you are providing.
Customer Retention Rate
This KPI measures the rate a business has retained customers over a specific time period.
Service Level Agreement
Measures how well you are adhering to your agreed-on standards for support.
Integrations
All your team's KPIs. All in one place.
Take your CRM, helpdesk, and telephony systems' KPIs and show your team how they're doing in one simple dashboard view in just seconds.
Start building your first dashboard today.
No credit card required.