 Sign in

SaaS dashboards
Build a SaaS dashboard that boosts your team's performance in real time
A SaaS dashboard connects your billing, CRM and support data so your team sees MRR, churn and pipeline as they change, and can act on them straight away.
Join 700+ data-driven companies already taking their performance to the next level

What is a SaaS dashboard?
A SaaS dashboard is a live view of the metrics that show how a subscription software business is performing, such as MRR, churn, pipeline and support response times. It pulls data from billing, CRM and support tools into one screen, so sales, success and finance teams work from the same numbers and can act before a trend becomes a problem.
A good SaaS dashboard answers four questions:
- Revenue: how much recurring revenue do we have, and how fast is it growing? (MRR, ARR, new MRR)
- Retention: how much revenue are we keeping? (churn MRR, net revenue retention)
- Efficiency: what does growth cost, and what is a customer worth? (CAC, LTV, pipeline)
- Customer experience: do customers get help fast? (first response time, CSAT)
In Plecto, a SaaS dashboard updates by itself as your data sources refresh. You connect your tools through 150+ integrations, turn the numbers into KPIs with formulas, and show them on office TVs, in the mobile app and in scheduled reports. Plecto does not replace your billing system or CRM. It reads the data they hold and turns it into live dashboards, targets, contests and coaching for your team.
How a SaaS dashboard accelerates your team's performance
Hit your MRR targets with live sales insights
Turn your pipeline into profit with performance insights and start smashing your MRR targets in no time at all.
Cut out churn
Pinpoint the trends in your team's performance and take immediate action to reduce churn and improve customer lifetime.
Boost employee activity
Data visualization helps the productivity of your team by making sure that top performance is recognized for everyone to see.
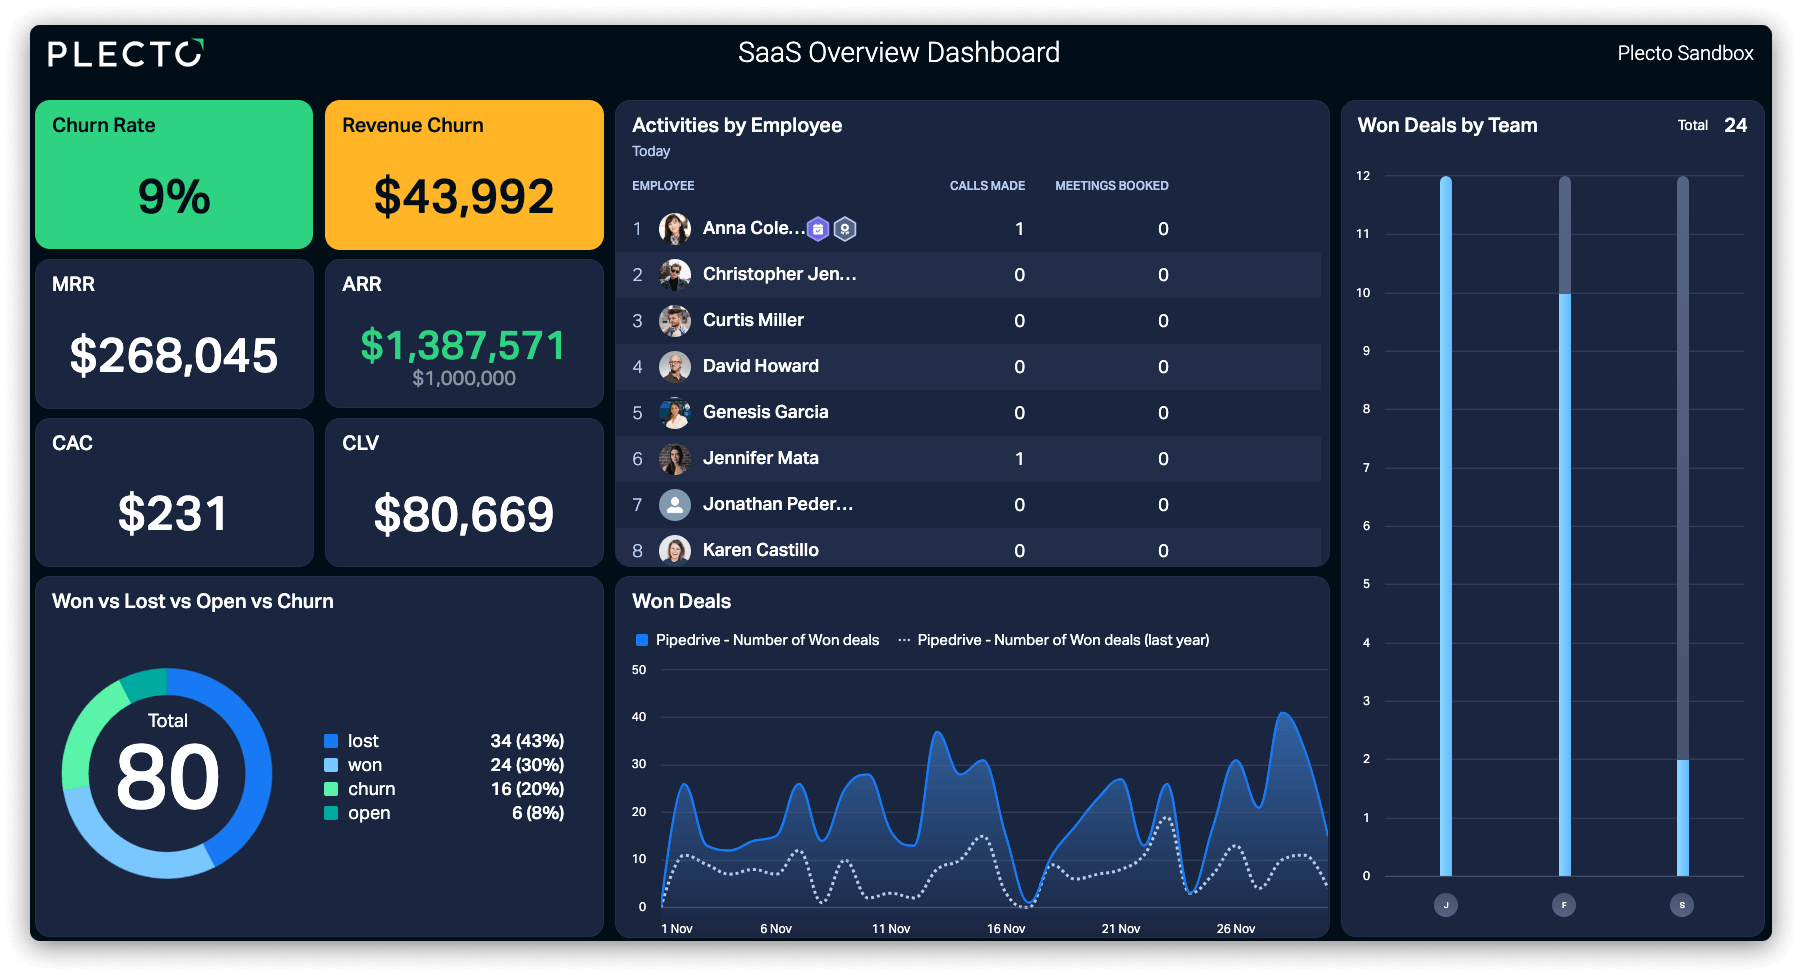
Boost team performance with a SaaS dashboard and a data-driven culture
Enhance sales & support with SaaS dashboards
Build SaaS metrics dashboards to identify what's working, what's not and then take immediate action. Get a complete overview of your KPIs and spot ways to take your sales and support team's performance to the next level.
Check out the top 10 SaaS KPIs you need to be tracking
Supercharge sales and support motivation with a SaaS dashboard
Celebrate wins on your SaaS dashboard
Hit a new high with ARR? Are you minimizing churn? Spark healthy competition that helps drive revenue and then celebrate your team's successes with instant notifications.
Engage your team with gamification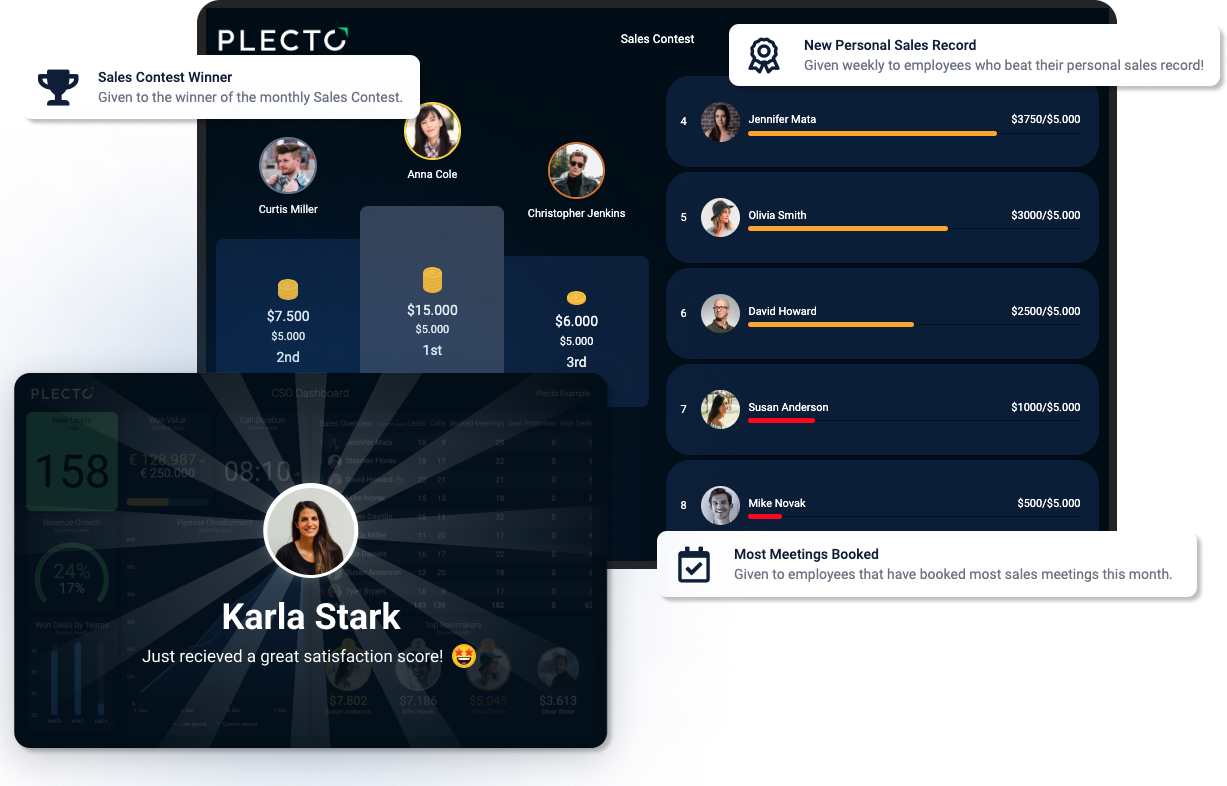
SaaS dashboard success stories

Discover how Ageras Nordic achieved the "best year in the company's history" with help of Plecto.

Learn how SaaS giant Pipedrive makes faster data-driven decisions with Plecto.

Read how Danish IIoT company Secomea grew inside sales by 600% in one year.
Centralize your sales and support data with our 150+ integrations
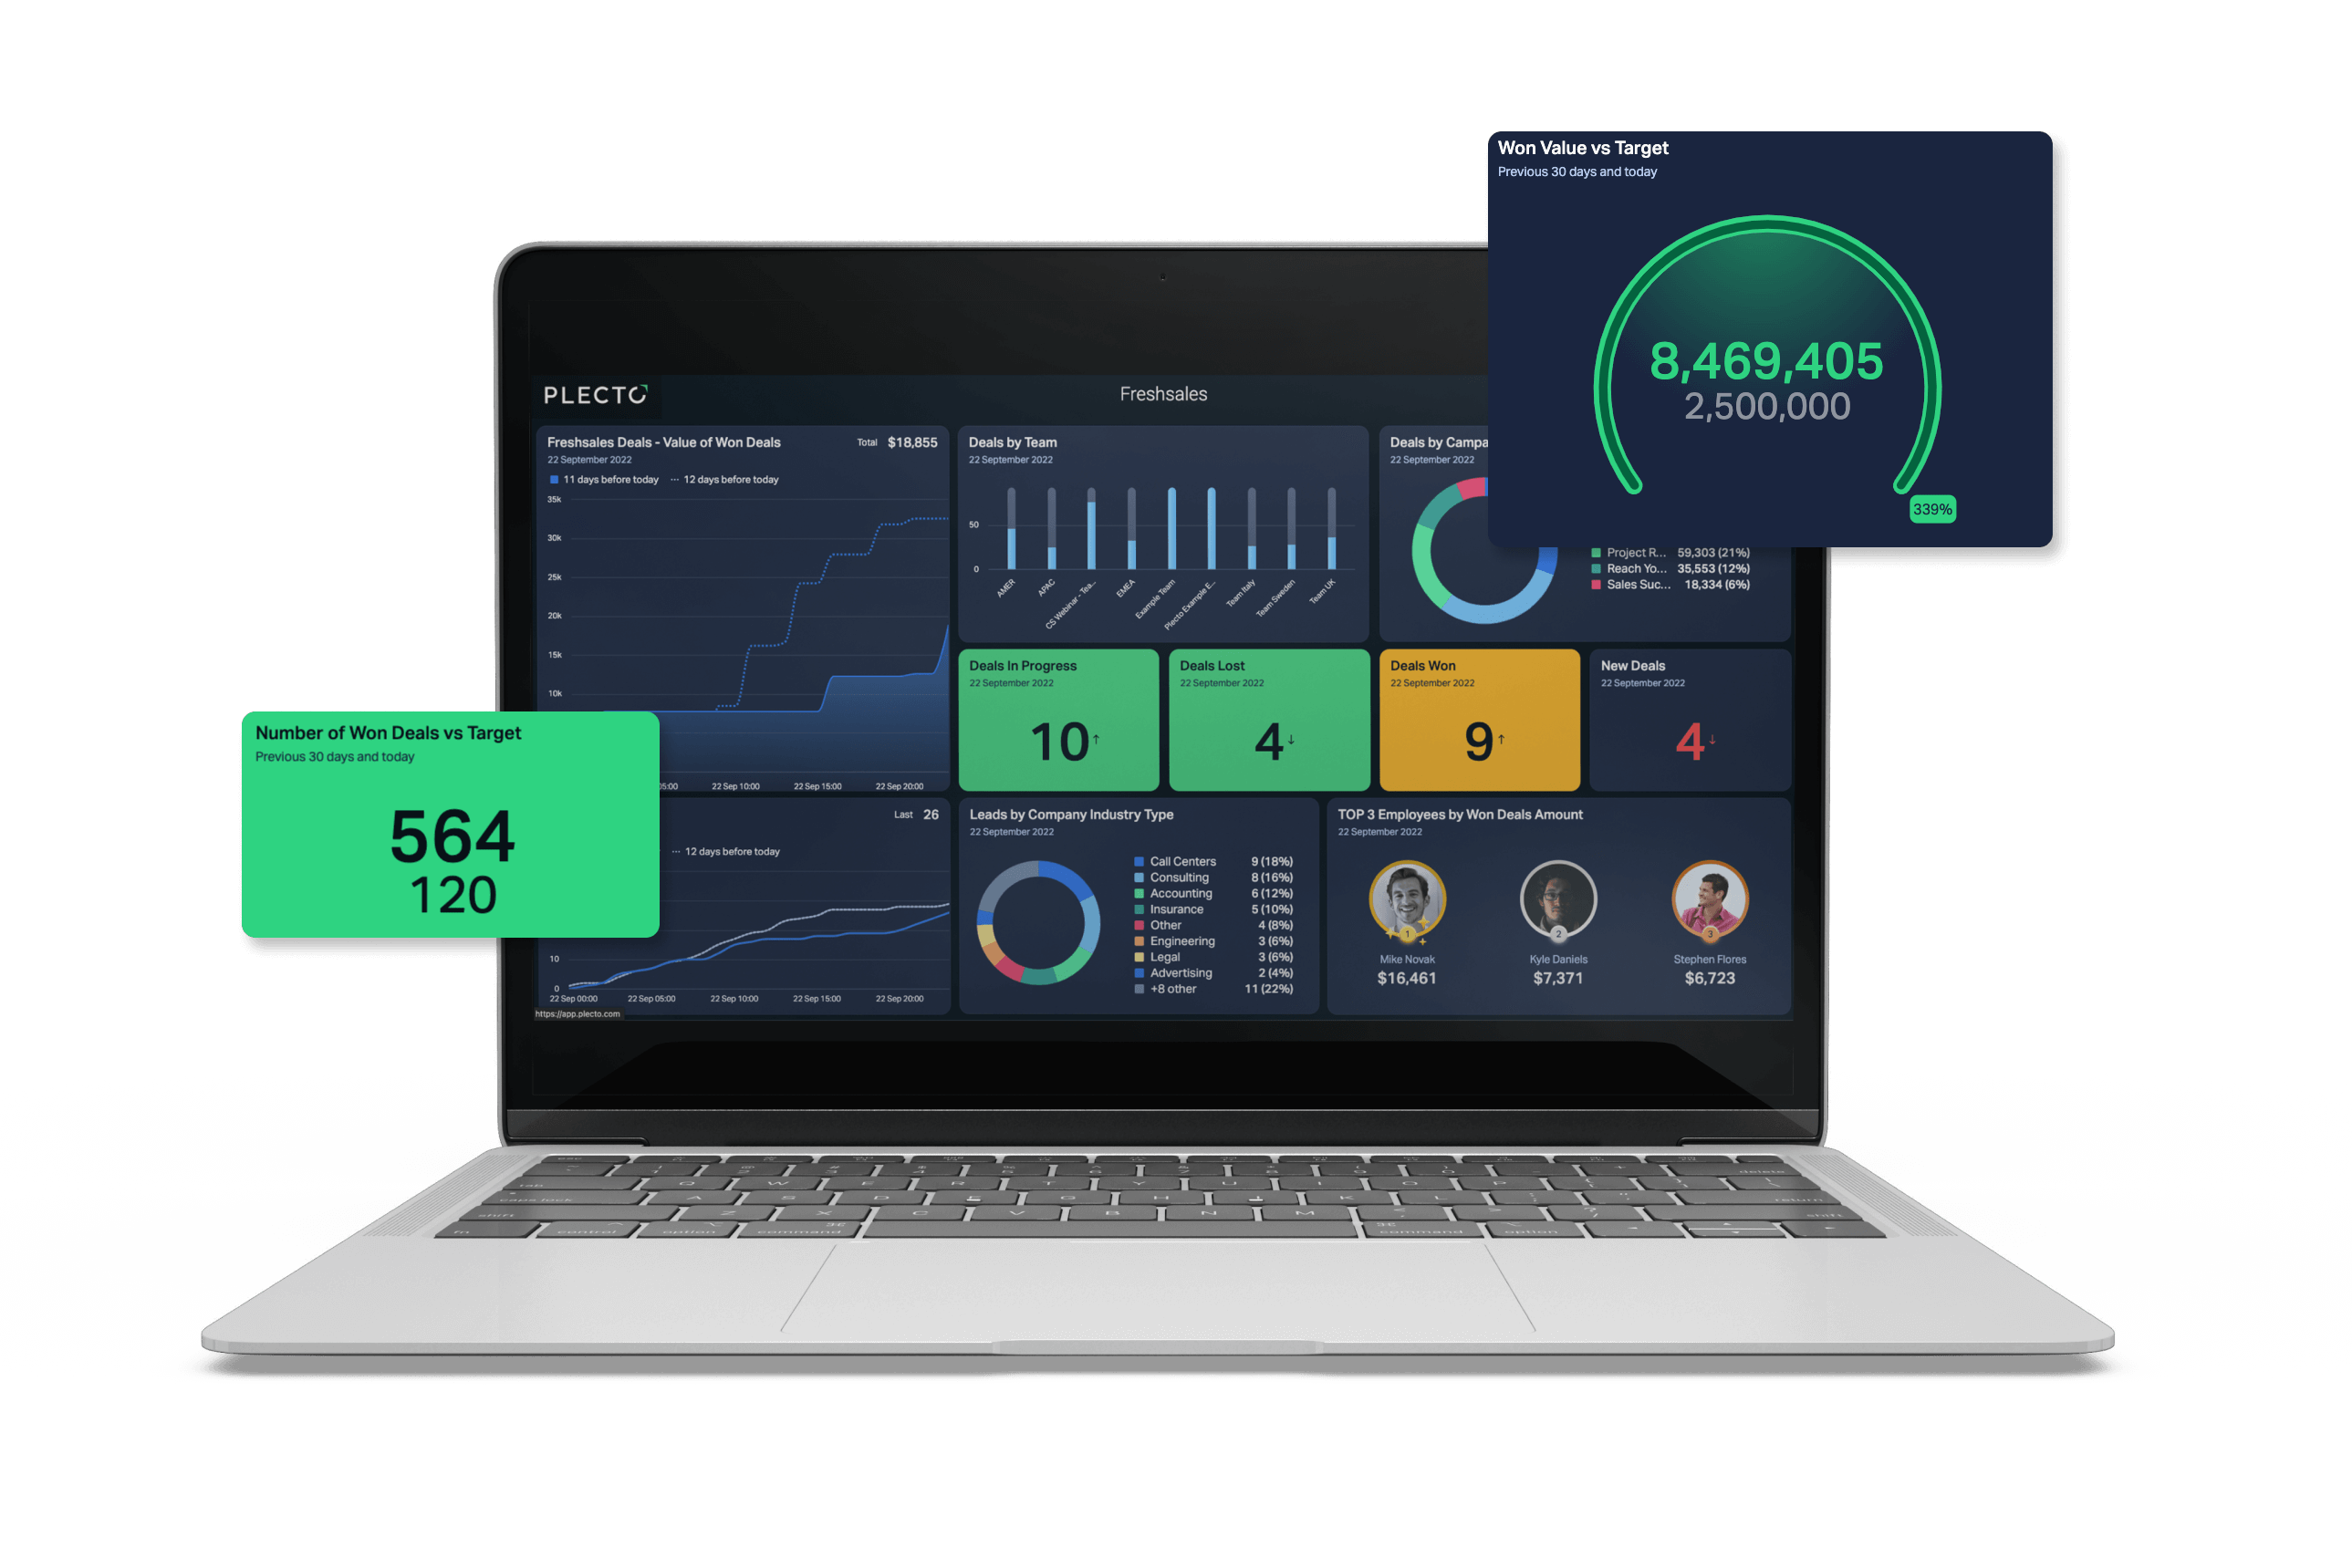
SaaS dashboard examples
Four SaaS dashboards teams build most often, and what each one shows.
| SaaS dashboard | Who uses it | Core KPIs | Typical data sources |
|---|---|---|---|
| Executive | CEO, CFO, leadership team | MRR, ARR, new MRR, churn MRR, pipeline | Billing, CRM |
| Sales and pipeline | Sales leaders and reps | New MRR, won deals vs target, weighted pipeline, win rate | CRM |
| Customer success and churn | Customer success, finance | Churn MRR, net revenue retention, renewals, CSAT | Billing, CRM, support |
| Support | Support managers and agents | First response time, resolution time, ticket backlog, CSAT | Helpdesk |
Executive SaaS dashboard example
The executive SaaS dashboard is the one-screen answer to "how is the business doing?". It shows MRR, ARR, new MRR and churn MRR for the month, plus pipeline for the next quarter, so leaders see growth and leakage side by side. Read more in our guide to the executive dashboard.
Sales and pipeline SaaS dashboard example
A sales SaaS dashboard shows new MRR booked, won deals against target, weighted pipeline value and win rate, per rep and per team. Data comes from your CRM, for example HubSpot, Salesforce or Pipedrive. See how Pipedrive uses Plecto in the Pipedrive customer story, or browse sales dashboards.
Customer success and churn SaaS dashboard example
This SaaS dashboard tracks how much revenue you keep. Start with churn MRR and add net revenue retention, upcoming renewals and customer satisfaction. Subscription data usually comes from a billing tool such as Chargebee (subscriptions and invoices) or Stripe (invoices and charges), joined with CRM or support data.
SaaS dashboard for support teams
Support teams protect retention. A support SaaS dashboard shows first response time, resolution time, ticket backlog and CSAT from tools like Zendesk Support, so agents and managers see queue health live. See the customer service dashboard page for examples.
Put your SaaS dashboard on every screen
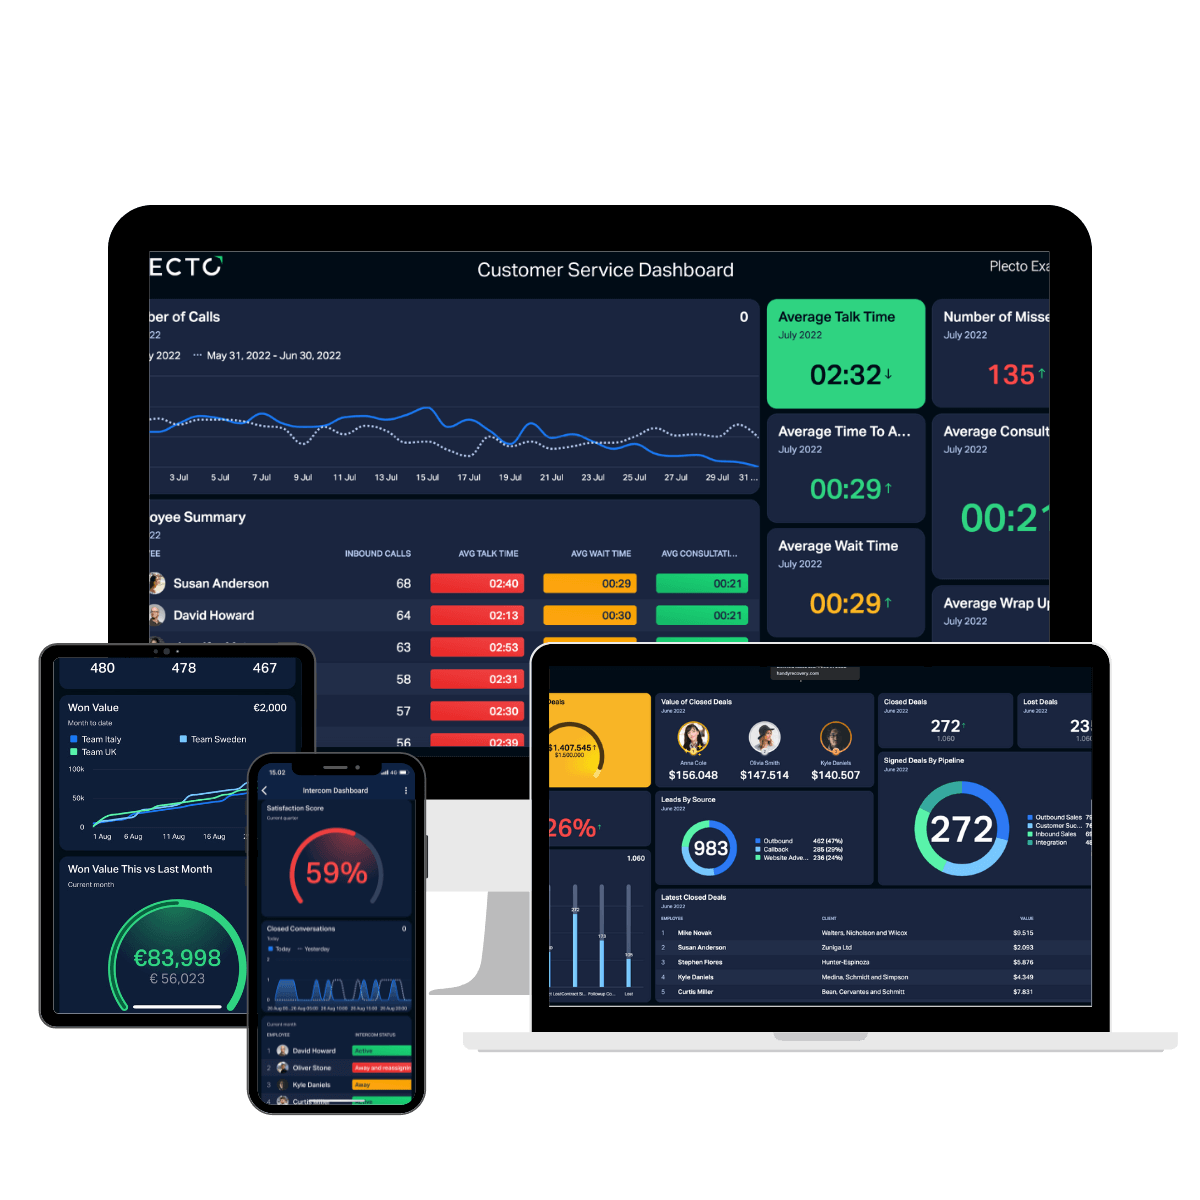
Transform your office into a hub of activity by putting your dashboards, notifications and contests on the big screen. Always want to stay in the loop? Use our app and take Plecto wherever you go.


KPIs to include on a SaaS dashboard
Start with the first five rows, then add retention and unit economics as your data allows.
| KPI | What it tells you | How it is calculated |
|---|---|---|
| MRR | Predictable subscription revenue per month | Sum of the monthly recurring revenue of active subscriptions |
| ARR | Expected yearly revenue from current subscriptions | MRR × 12 |
| New MRR | Revenue added by new subscriptions | Sum of MRR from new subscriptions in the period |
| Churn MRR | Recurring revenue lost to cancellations and downgrades | Sum of MRR from churned subscriptions in the period |
| Customer churn rate | Share of customers you lose | Customers lost ÷ customers at start of period × 100 |
| Net revenue retention | Whether existing customers grow or shrink in value | (Starting MRR + expansion − contraction − churn) ÷ starting MRR × 100 |
| CAC | Cost of winning a new customer | (Sales cost + marketing cost) ÷ new customers |
| Customer lifetime value (LTV) | What a customer is expected to spend over the relationship | Average monthly revenue per customer ÷ monthly churn rate (simple version) |
| LTV:CAC | Whether growth pays for itself | LTV ÷ CAC |
| Weighted pipeline value | Revenue you can expect from open deals | Deal value × probability of closing, summed |
| Lead velocity rate | Growth of qualified leads month over month | (Qualified leads this month − last month) ÷ last month × 100 |
| CSAT | How satisfied customers are with support | Satisfied responses ÷ total responses × 100 |
Not sure which to prioritize? Our guide to the top 10 SaaS KPIs explains each one, and the custom KPIs page shows how to build metrics such as NPS or lead velocity rate with formulas.
How to build a SaaS dashboard
Six steps from raw billing, CRM and support data to a live SaaS dashboard.
-
Pick the audience and three to five KPIs. A SaaS dashboard for the CEO needs different numbers than one for the support floor. Fewer metrics, each with a target, beat a wall of charts. Plecto's dashboard best practices cover layout and what to leave out.
-
Connect your data. Use Stripe or Chargebee for billing, HubSpot, Salesforce or Pipedrive for deals, and Zendesk Support or Freshdesk for tickets. Chargebee data includes subscriptions and invoices, and HubSpot deals refresh every 2 minutes. The Stripe integration is currently in beta; see Stripe dashboard examples for invoice, payment and refund views. Numbers that live in a spreadsheet can come in through the Excel or Google Sheets integrations. See step 1: integrate your data.
-
Create formulas for your KPIs. A formula turns data into a KPI, such as churn MRR or won deals against target. MRR needs a field with each subscription's monthly amount, from your billing subscriptions or a recurring-revenue field in your CRM. The AI formula assistant (beta) can help you write them. See step 2: create formulas.
-
Build the dashboard. Go to Dashboards > New dashboard, then use the dashboard builder for up to five widgets from a connected system, or start from an empty dashboard. Read how to create a dashboard.
-
Add targets and conditional colors. Compare each KPI with its goal and use conditional colors so anyone can see at a glance whether a number is on track.
-
Share it where the team looks. Put it on office screens (see the TV dashboards guide), open it in the mobile app, send notifications when a target is hit, and turn it into scheduled reports.
“We wanted to become a more data-driven company and meet the needs of a scaling support and sales teams, so Plecto was the obvious choice.”

Daniel Figueiredo
Support & Sales Project Analyst

“During 2022, we have, in the Nordic countries, achieved the best results we have ever achieved in our entire history. Of course, the people are a huge factor in this, but visualization of sales certainly improved the numbers, too.”

Jesper Sebastian Larsen
Head of Sales Nordic at Ageras

“Plecto has been amazing at motivating the team. I’m able to motivate my sales reps by having them see what they’re doing, so we’re not operating blindly, and then promote healthy competition based on that.”

Alexandra Francis
Global Director of Inside Sales at Secomea
SaaS dashboard FAQ
Cover revenue, retention, efficiency and customer experience: MRR, ARR and new MRR; churn and net revenue retention; CAC, LTV and pipeline; and support response times and CSAT. Show each against a target. Keep one SaaS dashboard to three to five KPIs per audience rather than combining everything on one screen.
It depends on the job. Business intelligence tools suit deep, ad-hoc analysis by analysts, and your billing tool's own reports suit revenue questions. KPI dashboard software such as Plecto suits teams that want sales, support and revenue KPIs live on a screen with targets, contests and coaching for the people who move the numbers. Our SaaS KPI dashboard software comparison sets Plecto against subscription analytics and BI tools.
Connect your billing, CRM and support tools, create formulas for your KPIs, and build the dashboard from those formulas. It then updates automatically as data arrives: Stripe invoices and charges update instantly through webhooks and every 15 minutes, and HubSpot deals every 2 minutes. Add scheduled reports to send the same numbers to management.
MRR is your predictable subscription revenue per month. ARR is the yearly equivalent, calculated as MRR × 12. Use MRR for short-term trends and monthly targets, and ARR when you plan or report on a yearly view, for example for annual contracts or investor updates.
Start with MRR, ARR, new MRR, churn MRR and customer churn rate. They show revenue and retention with the least setup. Add CAC, pipeline value, net revenue retention and LTV:CAC once your billing and CRM data are connected. Our guide to the top 10 SaaS KPIs explains each metric.
Yes. Plecto dashboards can run on office TVs, with several dashboards rotating in a slideshow, and open in the Plecto mobile app for iOS and Android. Teams often put the pipeline and support dashboards on the floor and keep the executive SaaS dashboard for the leadership team.
Try Plecto free for 14 days.
No credit card required.