 Sign in
Real-time sales KPI visualization
Top targets with motivating, real-time sales KPI visualization
Plecto is real-time sales dashboard software. It turns your CRM and phone data into live KPI dashboards, leaderboards and contests on office TVs, desktops and phones, so every rep can see where they stand against target.

Features
How Plecto helps boost sales by 23%
Live sales KPI visualization
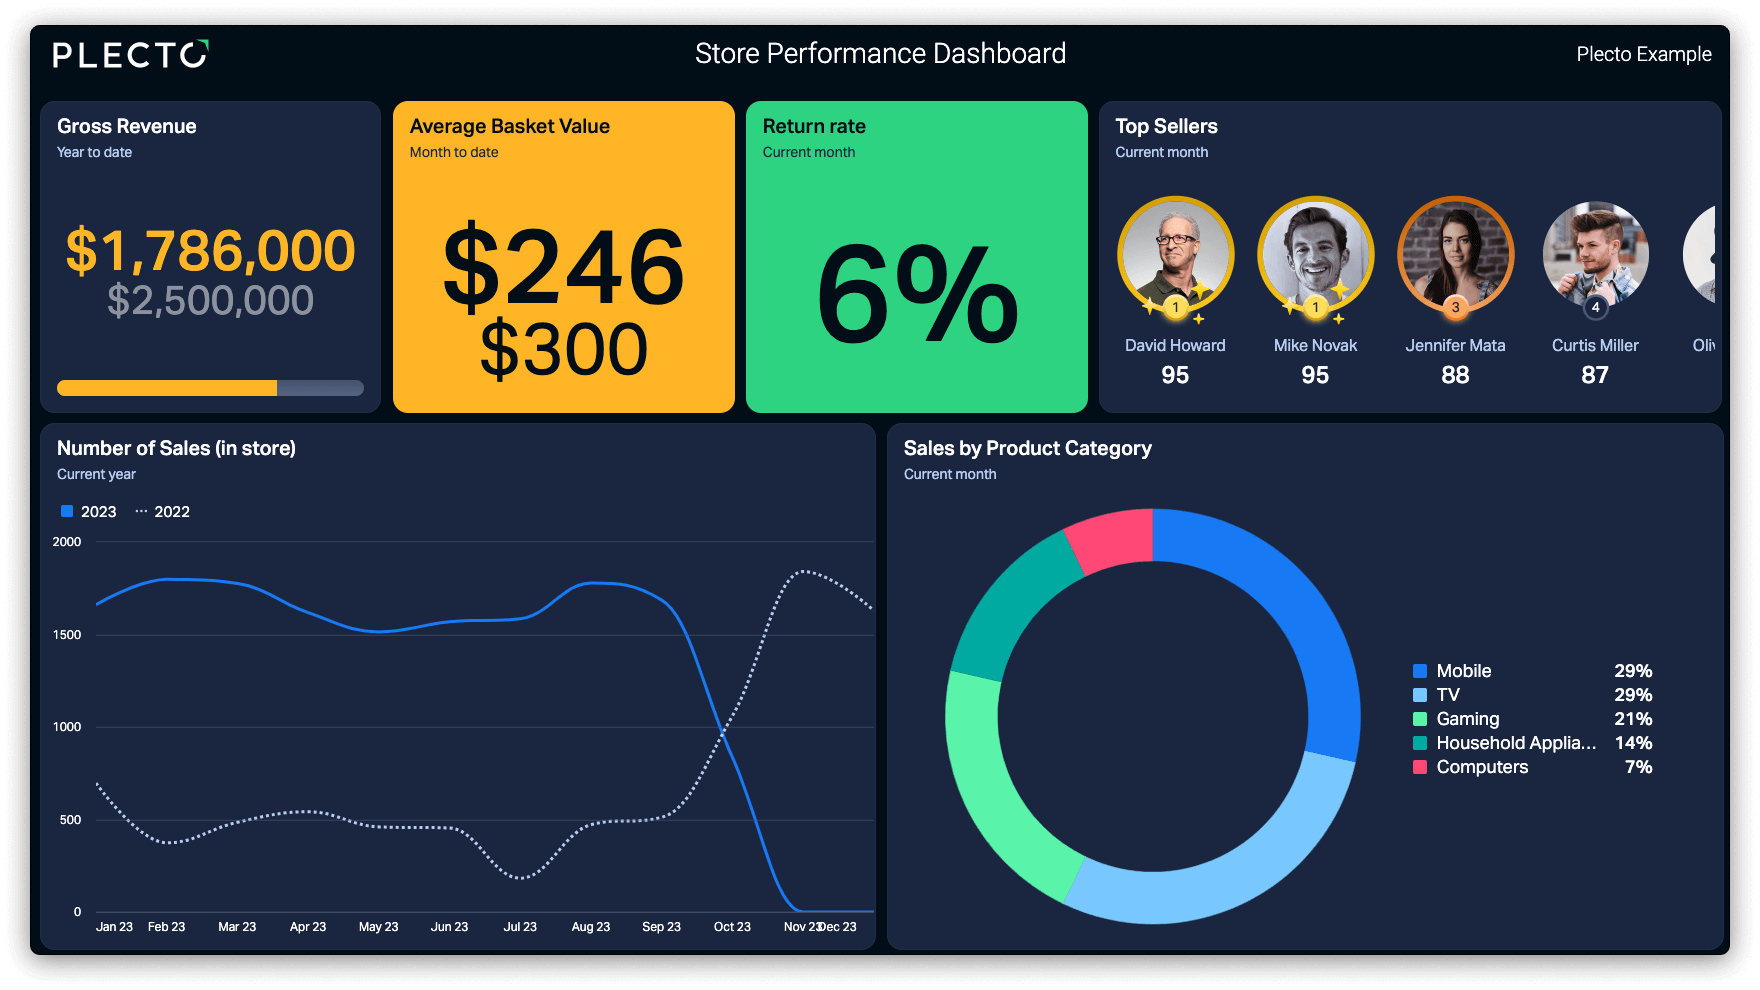
Visualize your key KPIs on easy-to-understand dashboards where you and your team can identify where action needs to be taken.
Contests for a competitive edge
Sales should be fun, especially for competitive salespeople at heart. Run contests and watch your team race to the top of the charts.
Funny, personalized notifications
Celebrate wins in real time with notifications.Let employees choose their own video to show. Set them to be shown on TVs when a significant sale is made.

“As soon as you visualize the results for the sales in the commercial department, there is this ignition. It just sets them on fire and makes them do more for better performance.”

Nina B. Michaelsen
Head of Sales, G4S

“The biggest impact has been gamification. The team and cross-regional overview and the possibility to work with the achievements are great for giving the employees the opportunity to compare their sales power.”

Remo Pastori
Sales Process Manager at Sunrise

Boost calls by 50%
“Our sales reps love Plecto. They're turning to the dashboards to see how everyone's going, and waiting for the notification when someone makes a deal.”

Matt Vickers
Operations Manager at The Insurance Surgery
Integrations
Does Plecto work with HubSpot, Salesforce and Pipedrive?
Yes. Plecto connects to HubSpot, Salesforce, Pipedrive and the rest of your CRM, helpdesk and telephony systems through 150+ integrations, and shows every KPI in one sales dashboard.
Dashboards
Get started creating your sales dashboard straight away.
Data doesn't need to be serious, scary spreadsheets. We take care of the complicated stuff, so you can focus on landing more sales. You can get started visualizing the sales KPIs you want in just a matter of minutes. Just pick how you'd like to get started!
Dashboard builder
Select your system. Select your KPIs. Connect your own actual data. Done!
Drag-and-drop formula templates
Use building blocks by selecting from pre-made formulas and widgets made for teams like yours.
Dashboard templates
Download a complete dashboard based on a specific sales system and KPI; for example, a HubSpot Deals dashboard.
Examples
What does a real-time sales dashboard look like?
Smash your sales targets with a sales manager dashboard. Get actionable insights into your team’s performance at a glance.
Go to Sales Manager Dashboard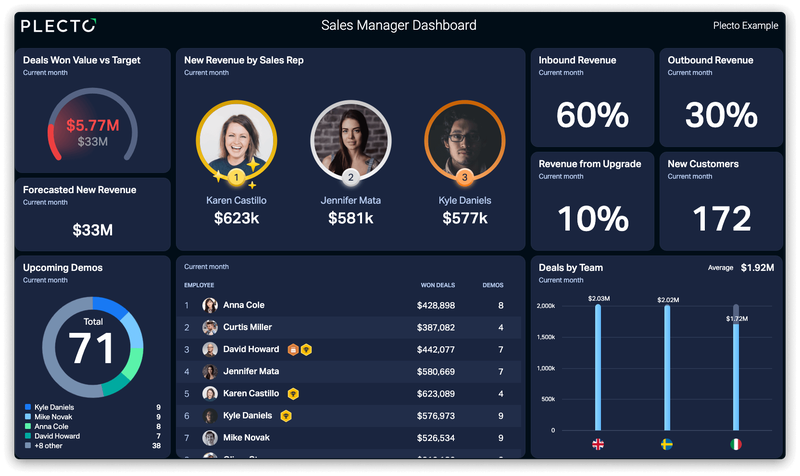
Get the full insight into your sales pipeline with real-time sales opportunities dashboards.
Go to Sales Opportunities Dashboard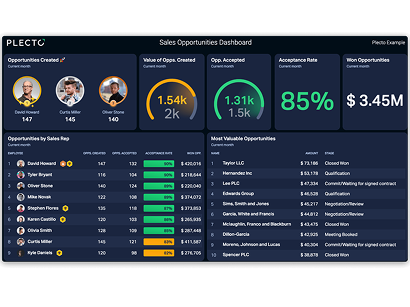
Identify where the new business is coming from with a real-time dashboard for tracking sales revenue.
Go to Sales Revenue Dashboard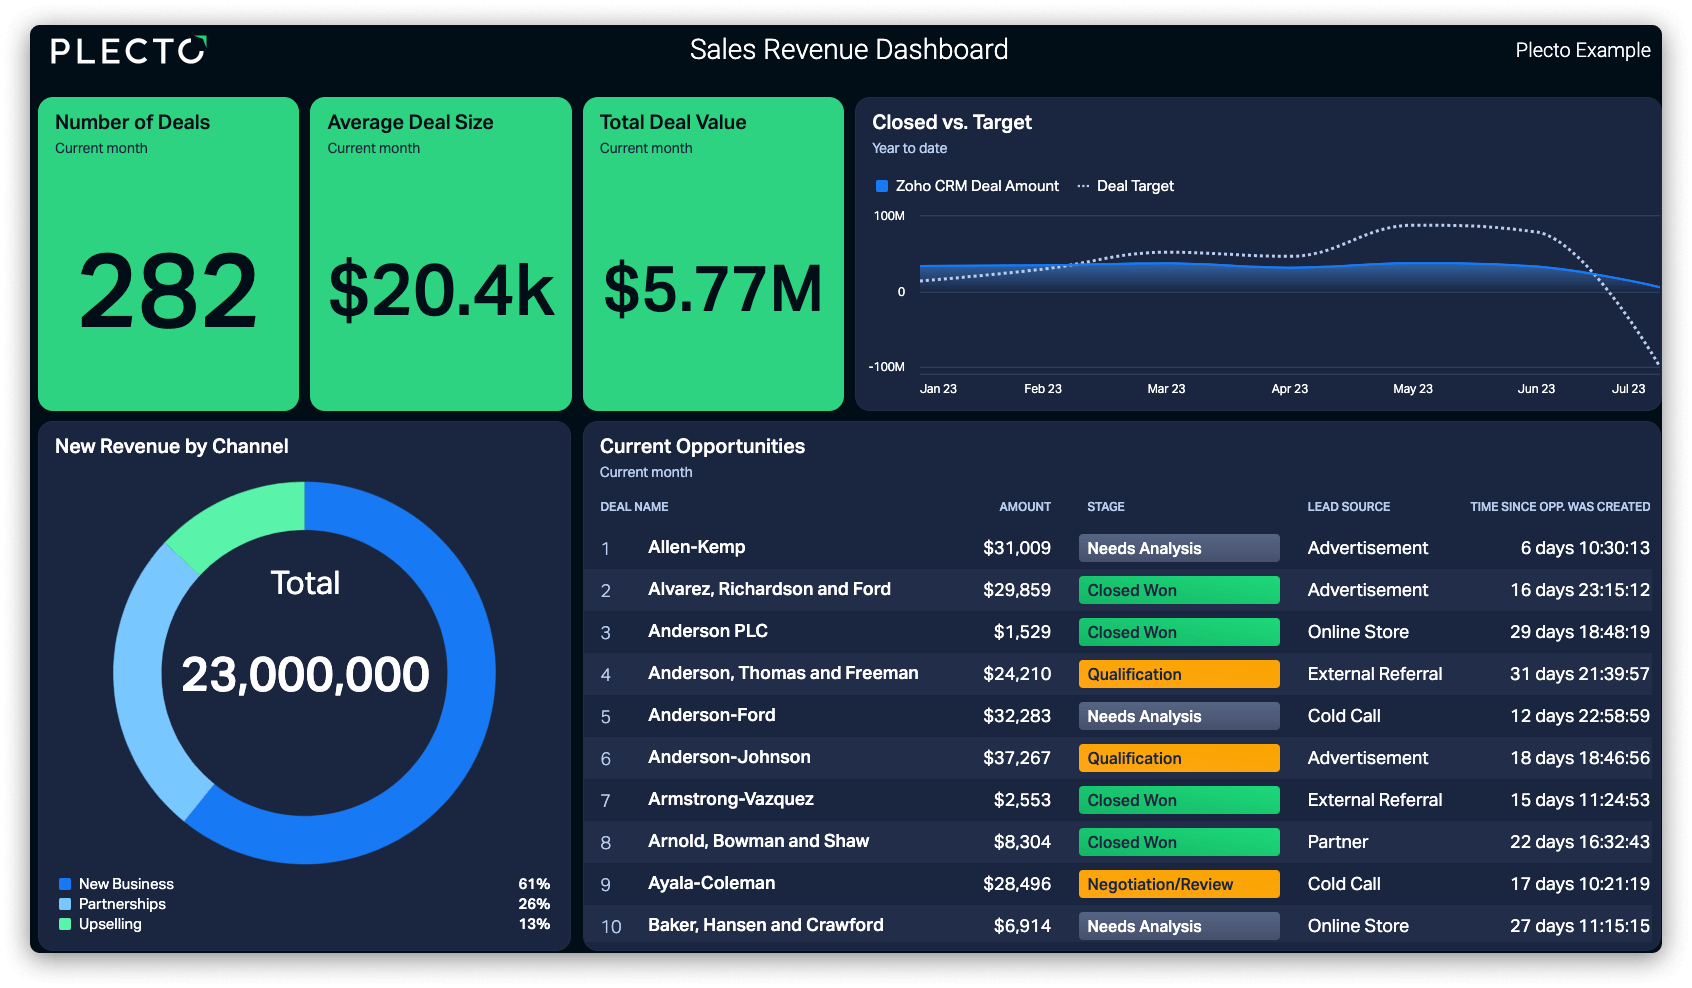
Can I add sales leaderboards and contests to my dashboards?
Yes. Plecto is sales dashboard software and sales gamification software in one platform.
Harness everyone's competitive instinct and inject some fun into the workday with Plecto's gamification features, including:
- Sales leaderboards
- Contests
- Notifications
- Achievements
- Spin the Wheel
- Reward Store
Discover Plecto's Sales Commission Calculator
A fixed percentage on every dollar of revenue — simple and predictable.
Guaranteed pay per rep, before any commission.
Revenue an average rep closes in the commission period.
Used to roll a single rep's plan up to the whole team.
Paid on every dollar of revenue.
A flat 10% on all revenue closed.
Total compensation breakdown
Illustrative comp modelling — build and automate your exact plan in Plecto.
Assumes revenue and base salary cover the same period; figures are estimates.
Sales customers already crushing KPIs with Plecto
Making more calls
50% increase in calls by visualizing employees Aircall data on Plecto dashboards
Best year on record
Plecto sales dashboards help Ageras Nordic achieve their best revenue year on record
Reports
Automate your sales reports
We get it, every sales rep wants to spend their time closing deals instead of compiling reports. Our reporting feature automates this, saving you bags of time.
Learn more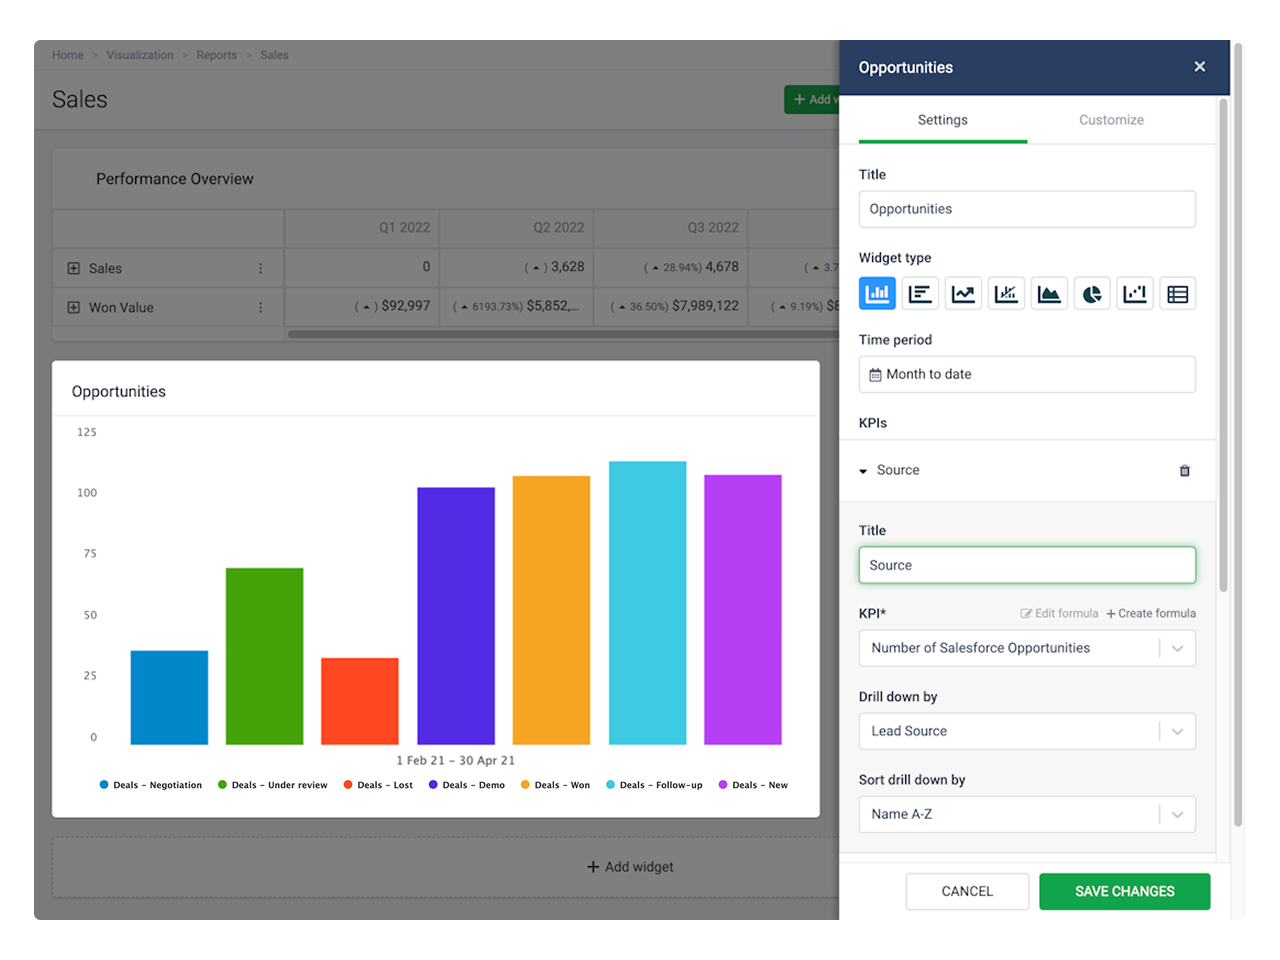
CRM integrations
Sales TV dashboards and leaderboards on your CRM data
Plecto turns your CRM into a real-time sales dashboard and leaderboard that the whole team can see on an office TV. Connect HubSpot, Salesforce, Pipedrive or any of 150+ integrations, pick the KPIs your reps are measured on, and put the dashboard on a slideshow for every TV in the office at no extra cost.
Salesforce
Opportunities and any custom object on a live Salesforce dashboard.
Sales dashboard software: frequently asked questions
The best sales dashboard software for a sales team updates in real time, pulls data from every system your reps work in, and is built to be shown on screens the whole team can see. Plecto is built for exactly that: it connects to your CRM, phone and helpdesk systems through 150+ integrations and adds leaderboards, contests and coaching on top of the numbers. If you mainly need advanced BI analysis for data analysts, tools like Power BI or Tableau are a different fit. See how they compare with Plecto.
Yes. Build a slideshow that rotates your sales dashboard, leaderboard and live contests, and play it on the sales floor TV through the Plecto TV app or a TV browser. The TV shows the same numbers as the desktop, refreshed as each data source updates. The TV dashboards guide explains the setup.
Yes. Connect HubSpot, Salesforce or Pipedrive to Plecto, pick the KPIs you want to rank reps on, such as deals won, revenue or calls made, and show the sales leaderboard on a dashboard or a TV. You can combine CRM data with your phone system in the same leaderboard.
Plecto is priced per license per month, and you only need licenses for the employees you track. Admins and employees who only view dashboards can do so free of charge. Dashboards are included on every plan, and contests are included on the Large and Enterprise plans. See pricing, or start a 14-day free trial with no credit card required.
Before Plecto, leads, sales and call data sit in different systems, individual progress is hard to find, and feedback is based on outdated numbers. With Plecto, sales KPIs are shown simply for manager and team:
- Get a real-time team performance overview
- Analyze individual contributions
- Identify key areas for improvement
- Give actionable, personal feedback
Which sales KPIs should a sales dashboard track?
New Business Revenue
The bread and butter of sales KPIs. Track how much new revenue you are generating.
Revenue per Sales Rep
Measure individual performance by how much new business each rep is generating.
Win Rate
The percentage of qualified deals in the sales pipeline that are won.
Hit Rate
Quantifies the percentage of meetings or calls that result in closed deals.
Conversion Rate
This KPI measures the percentage of leads that are converted into new customers.
Project Pipeline Sales Value
Tracks how much projected value is in your sales pipeline.
Start building your first dashboard today.
No credit card required.