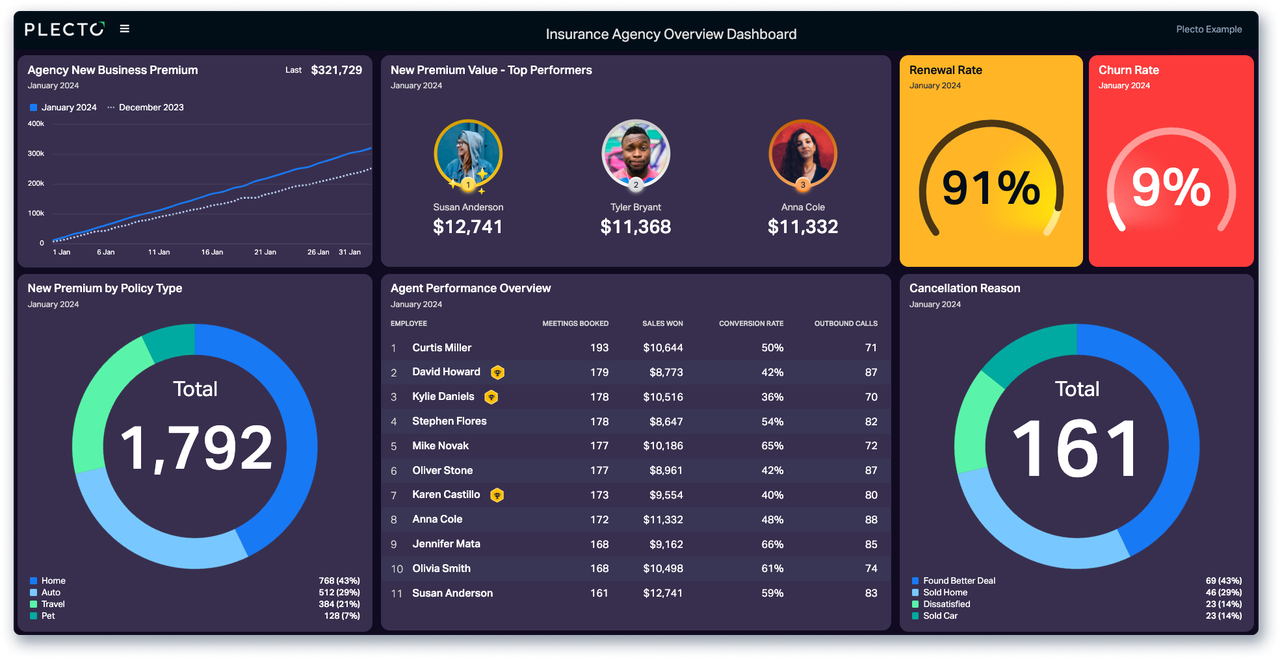
Optimize your agency's performance with insurance dashboards

Insurance dashboards help agencies take strategic decisions based on data and not feeling. Anyone in the insurance game knows that the industry is very target-based with all business areas assigned ambitious targets and KPIs that they need to hit.

Dashboard visualization enables teams to gain a better insight into these targets, and know exactly where they stand regarding their performance. The following examples below cover all areas of the insurance business - from providing a broad overview of an agency's performance, to focusing on a specific area of your business, such as retentions.

Insurance Agency Overview Dashboard

What's great about this dashboard?

The dashboard above provides employees with a high-level overview of their agency's performance. Its focus is on measuring the metrics that are critical to business success, such as New Business Premiums, Renewal Rate and more.
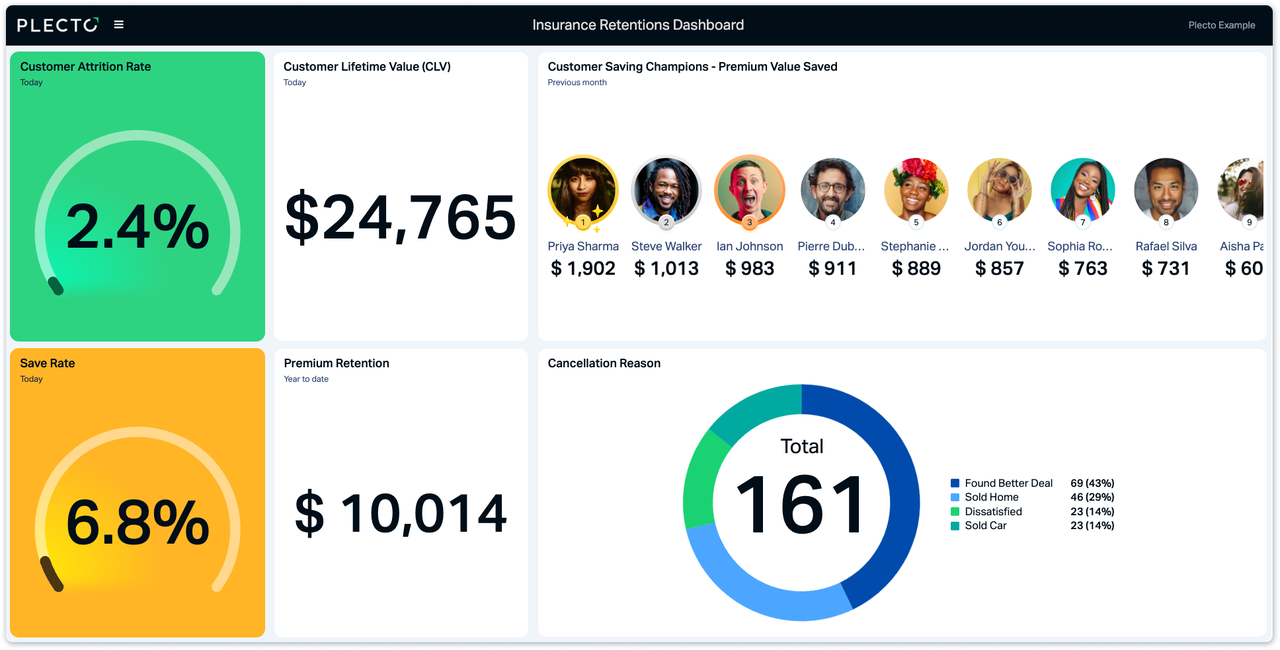
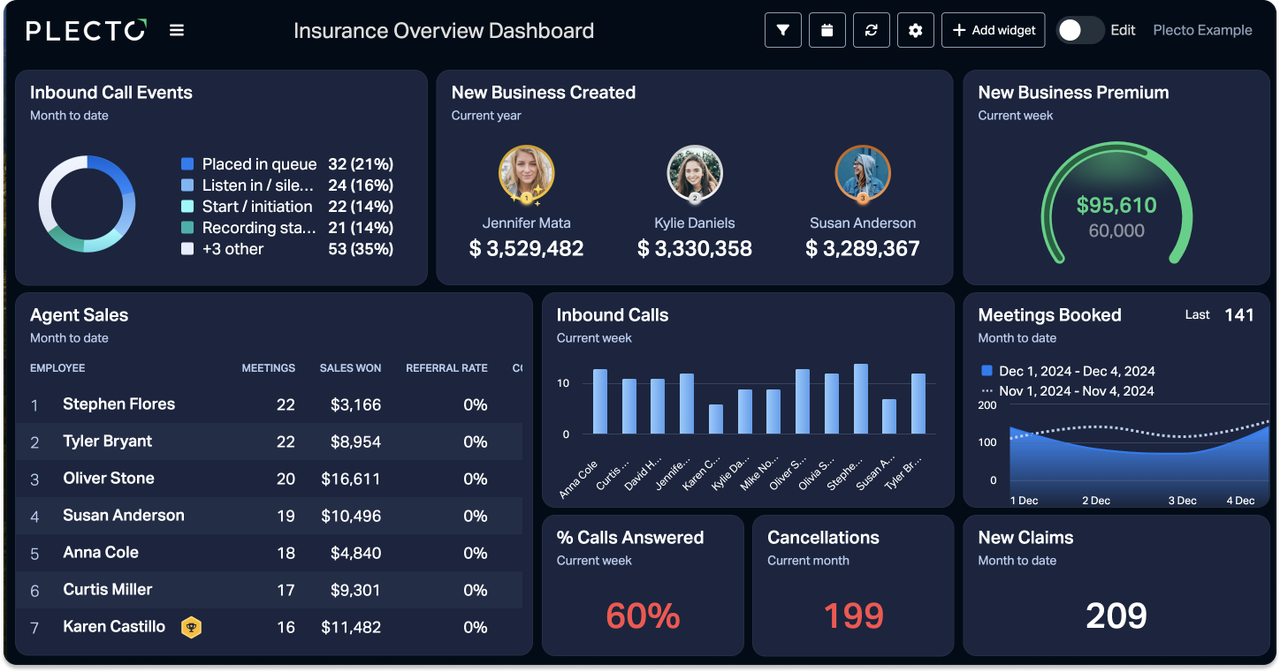
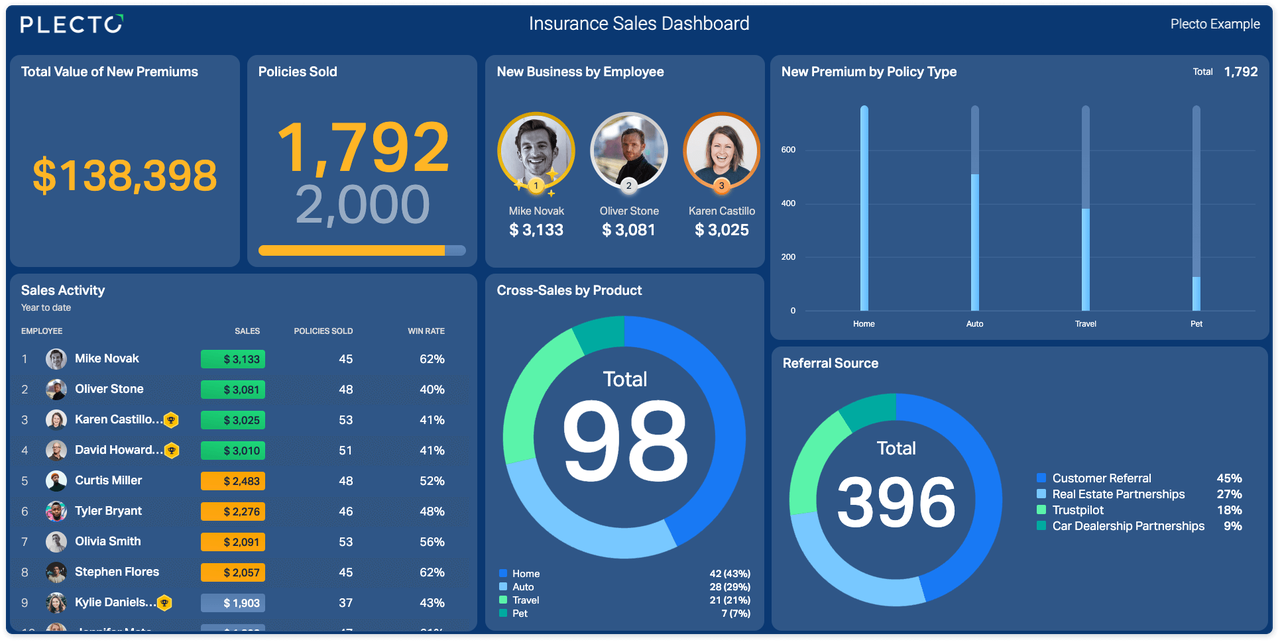
This dashboard also makes sure that its employees front and center, showcasing how much new business they are producing. It's for this reason that this dashboard is essential daily viewing for both management and front-line employees.

Insurance Retentions Dashboard

How can you use a retention dashboard?

Reach your retention goals by showcasing your customer-saving champions and cancellations on this equally motivating and informative dashboard that balances both high-level metrics and frontline insurance customer service KPIs like customer lifetime value (CLV), subscription save rate, and attrition.

Use the dashboard to understand why your customers are canceling their insurance subscription – so you can address any pricing, competitor, or lifestyle changes to remain the number one choice for your customers!

Sales & Service Insurance Dashboard

Want an alternative insurance KPIs overview?

Combine both sales and service performance with high-level and frontline KPIs on the ultimate insurance overview dashboard. This overview is the perfect snapshot for any sales or service manager, while also focusing on putting your employee's front foot forward and actively doing more of the activities that matter.

This dashboard helps you keep your calls in check by visualizing your answer rate, how many calls you've taken, and what your employees spend their time talking about. Keep converting more by showing your team how many meetings they've booked – and more importantly, the value of new business created from them!

Insurance Sales Dashboard

Identify the policies - and agents - that are selling

Many agencies and brokers offer numerous different policies - with dozens of different agents selling them. So, how do you identify what's selling and who's doing that selling? This insurance sales dashboard provides a clear overview of your premium performance by answering the following questions:

  1. Which agents are selling the most?
  2. Which policies are selling best?
  3. How much new biz are we generating?

Insurance Calls Dashboard

Essential daily viewing for customer-facing agents and managers

Whether the agent's focus is support, sales, retentions, or a combination of the three - one thing is certain - they'll be spending a significant amount of time on the phone.

That's exactly where this Insurance Calls Dashboard comes in. This is an activity-based dashboard that provides customer-facing employees with immediate access to their daily and/or weekly performance. Its straightforward design enables team members to stay on top of service levels, and immediately react to any issues.