 Sign in
Real-time Reports
Save your time and resources by automating reports
Say goodbye to monotonous manual reporting. Say hello to effortless efficiency with Plecto's automated reports.
Why Plecto reports?
All-in-one. Automated. Real-time reporting.
Reports you can customize to suit your needs
Plecto's reports can be displayed as graphics and support drill-downs by specific key figures (e.g. data source fields, teams or employees), as well as trend lines and stacked bar or area charts.
- Conditional colors so you can select what “good” performance looks like to you
- Each chart supports up to 20 KPIs
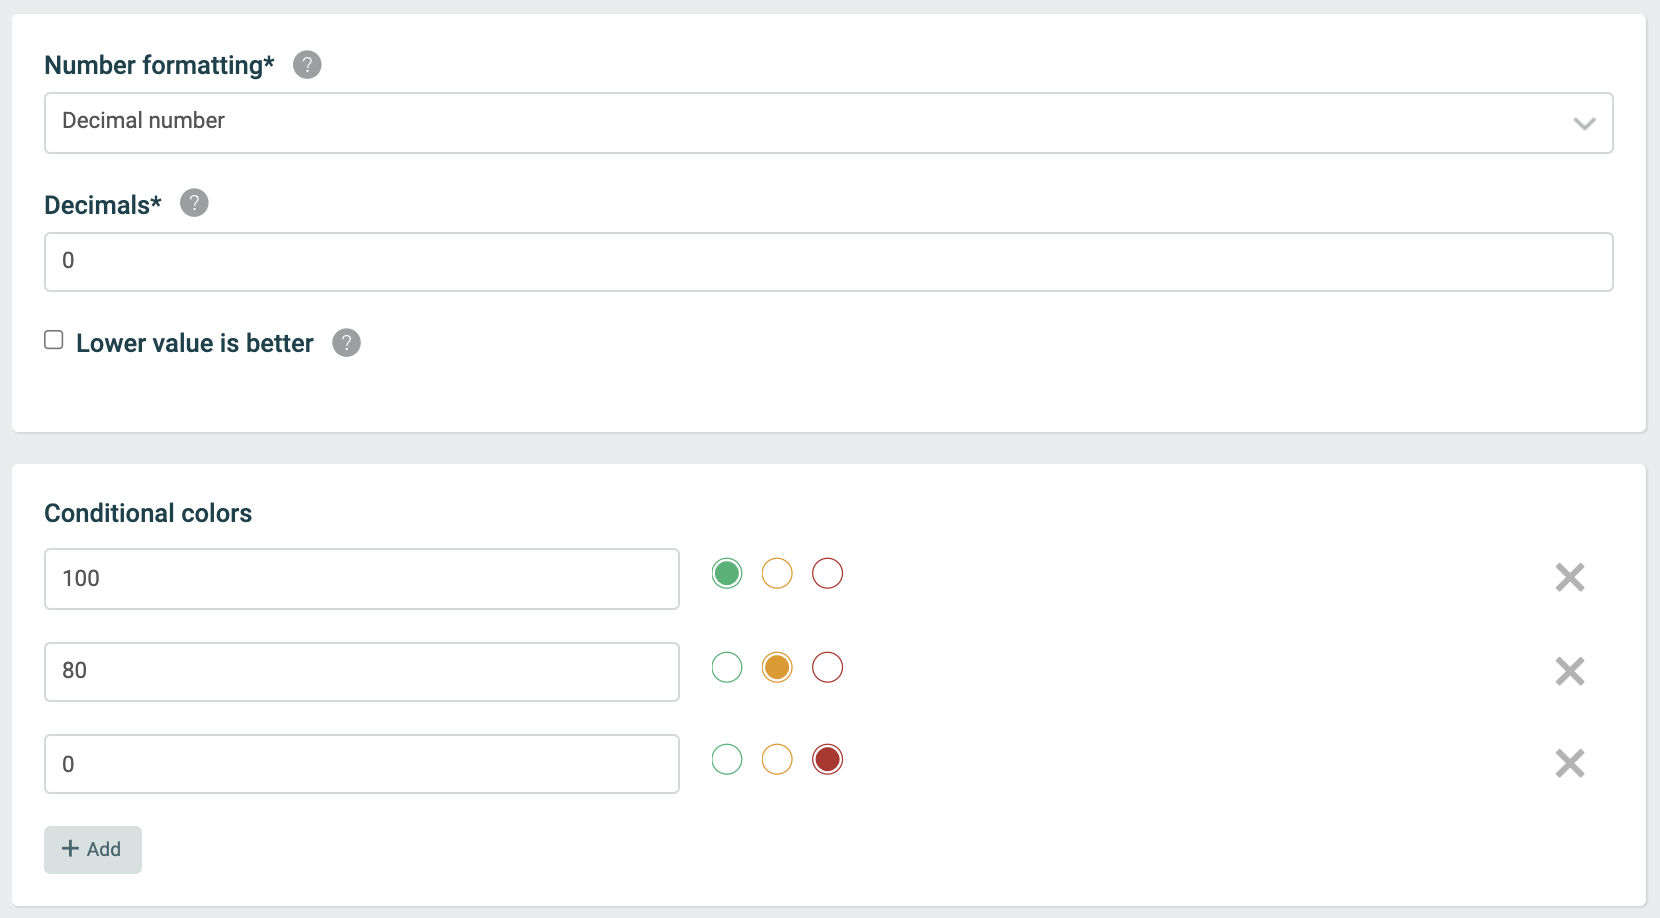
Reports that look so good, they’ll make you look good
- Data visualization in 8 different formats, including line charts, area charts, pie charts, and tables
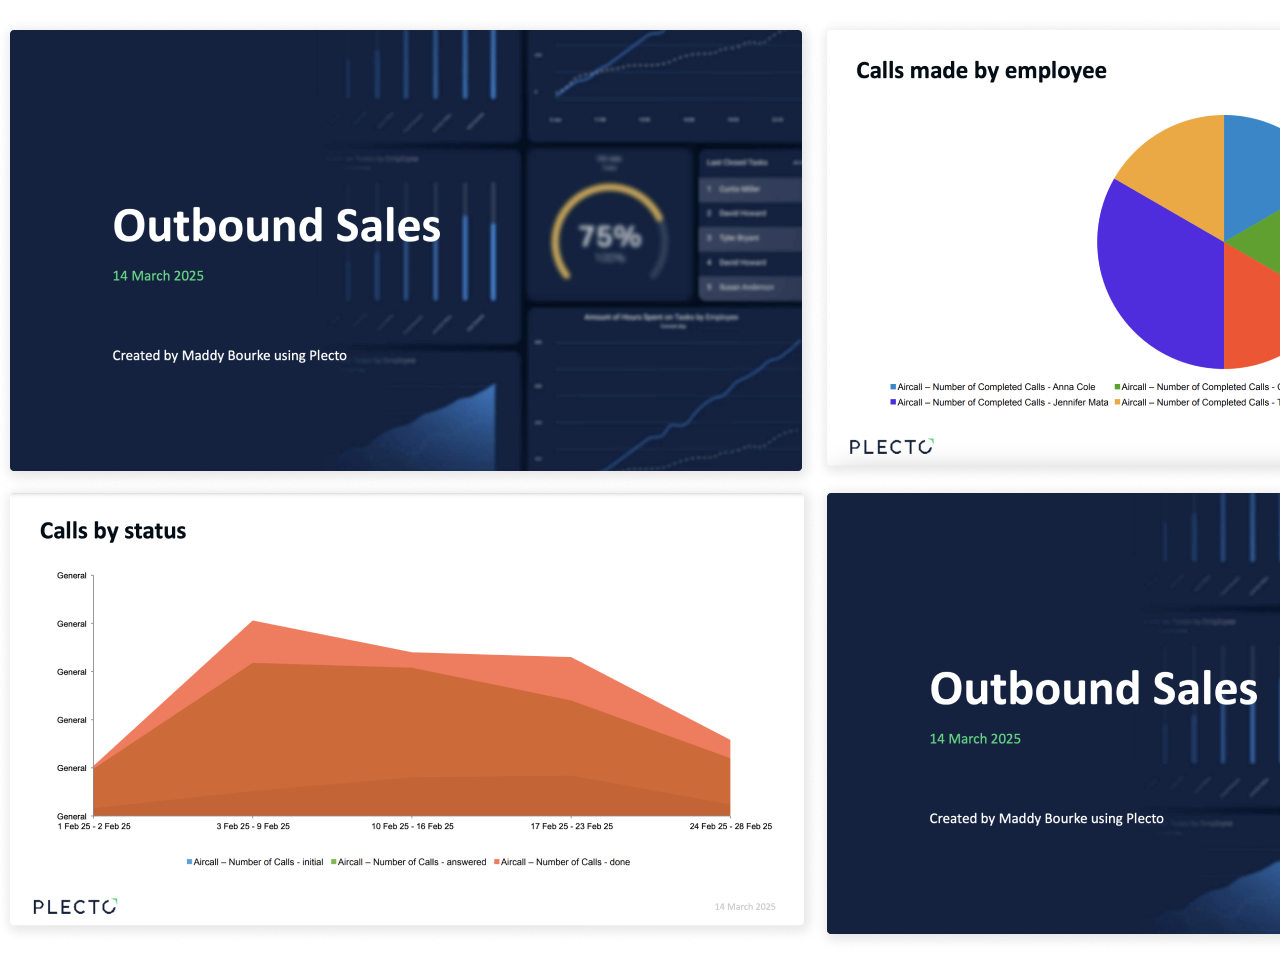
- Instantly export your reports in formatted and themed PowerPoint presentation versions
- Instant previews, filter options and more
- Real-time report data without having to reload the page
Create unlimited reports the way you want them
Plecto provides unlimited reports whenever you need them, giving your team a comprehensive overview of the business without any restrictions.
- No limit on the number of reports you can create
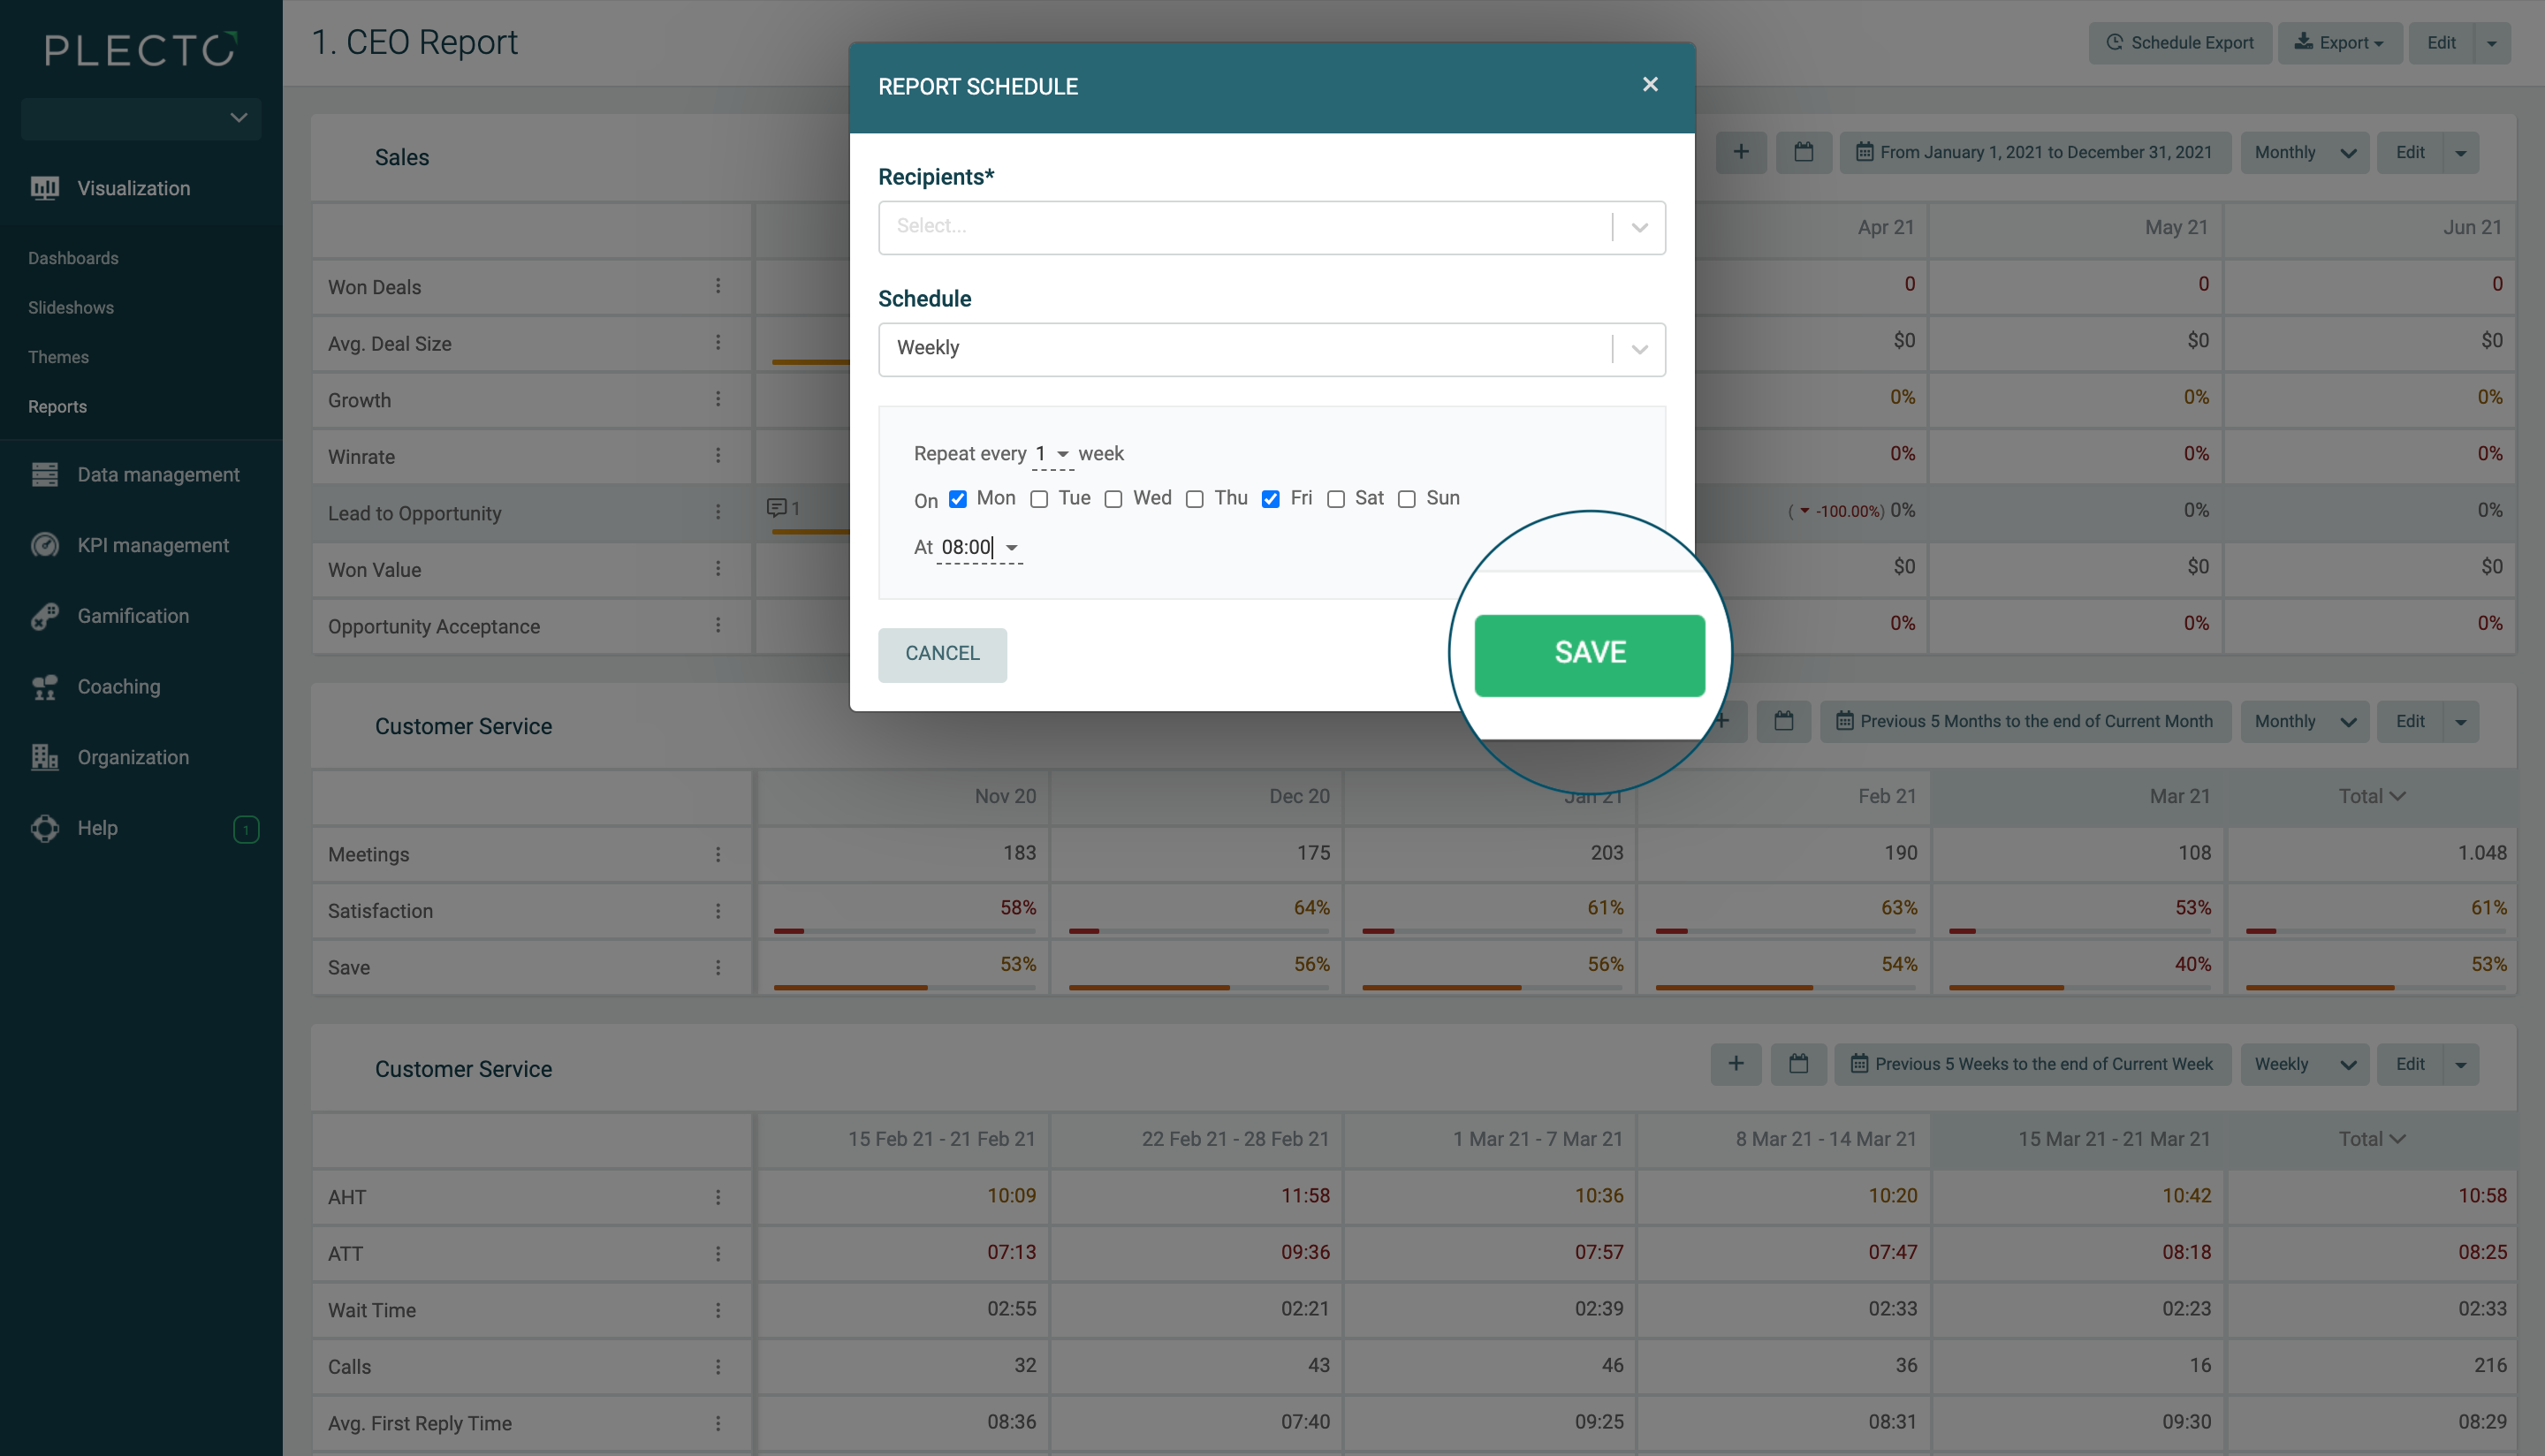
- Schedule for you or your colleagues to receive reports directly in your inbox at any time
- Export your reports as presentations whenever you need
Combine KPIs from different systems using formulas you’ve already created
Select the data and KPIs you want and visualize them all in a single-page report. This will provide you and your team with a comprehensive overview of all areas of your business, enabling you to identify your company's strengths and weaknesses with greater accuracy.
- Re-use the same formulas you’ve used on dashboards, just in different formats and the option to go more in-depth
- Combine KPIs from your CRM, telephony system, prospecting tool, or any other of your everyday apps to get a holistic view of your team’s performance
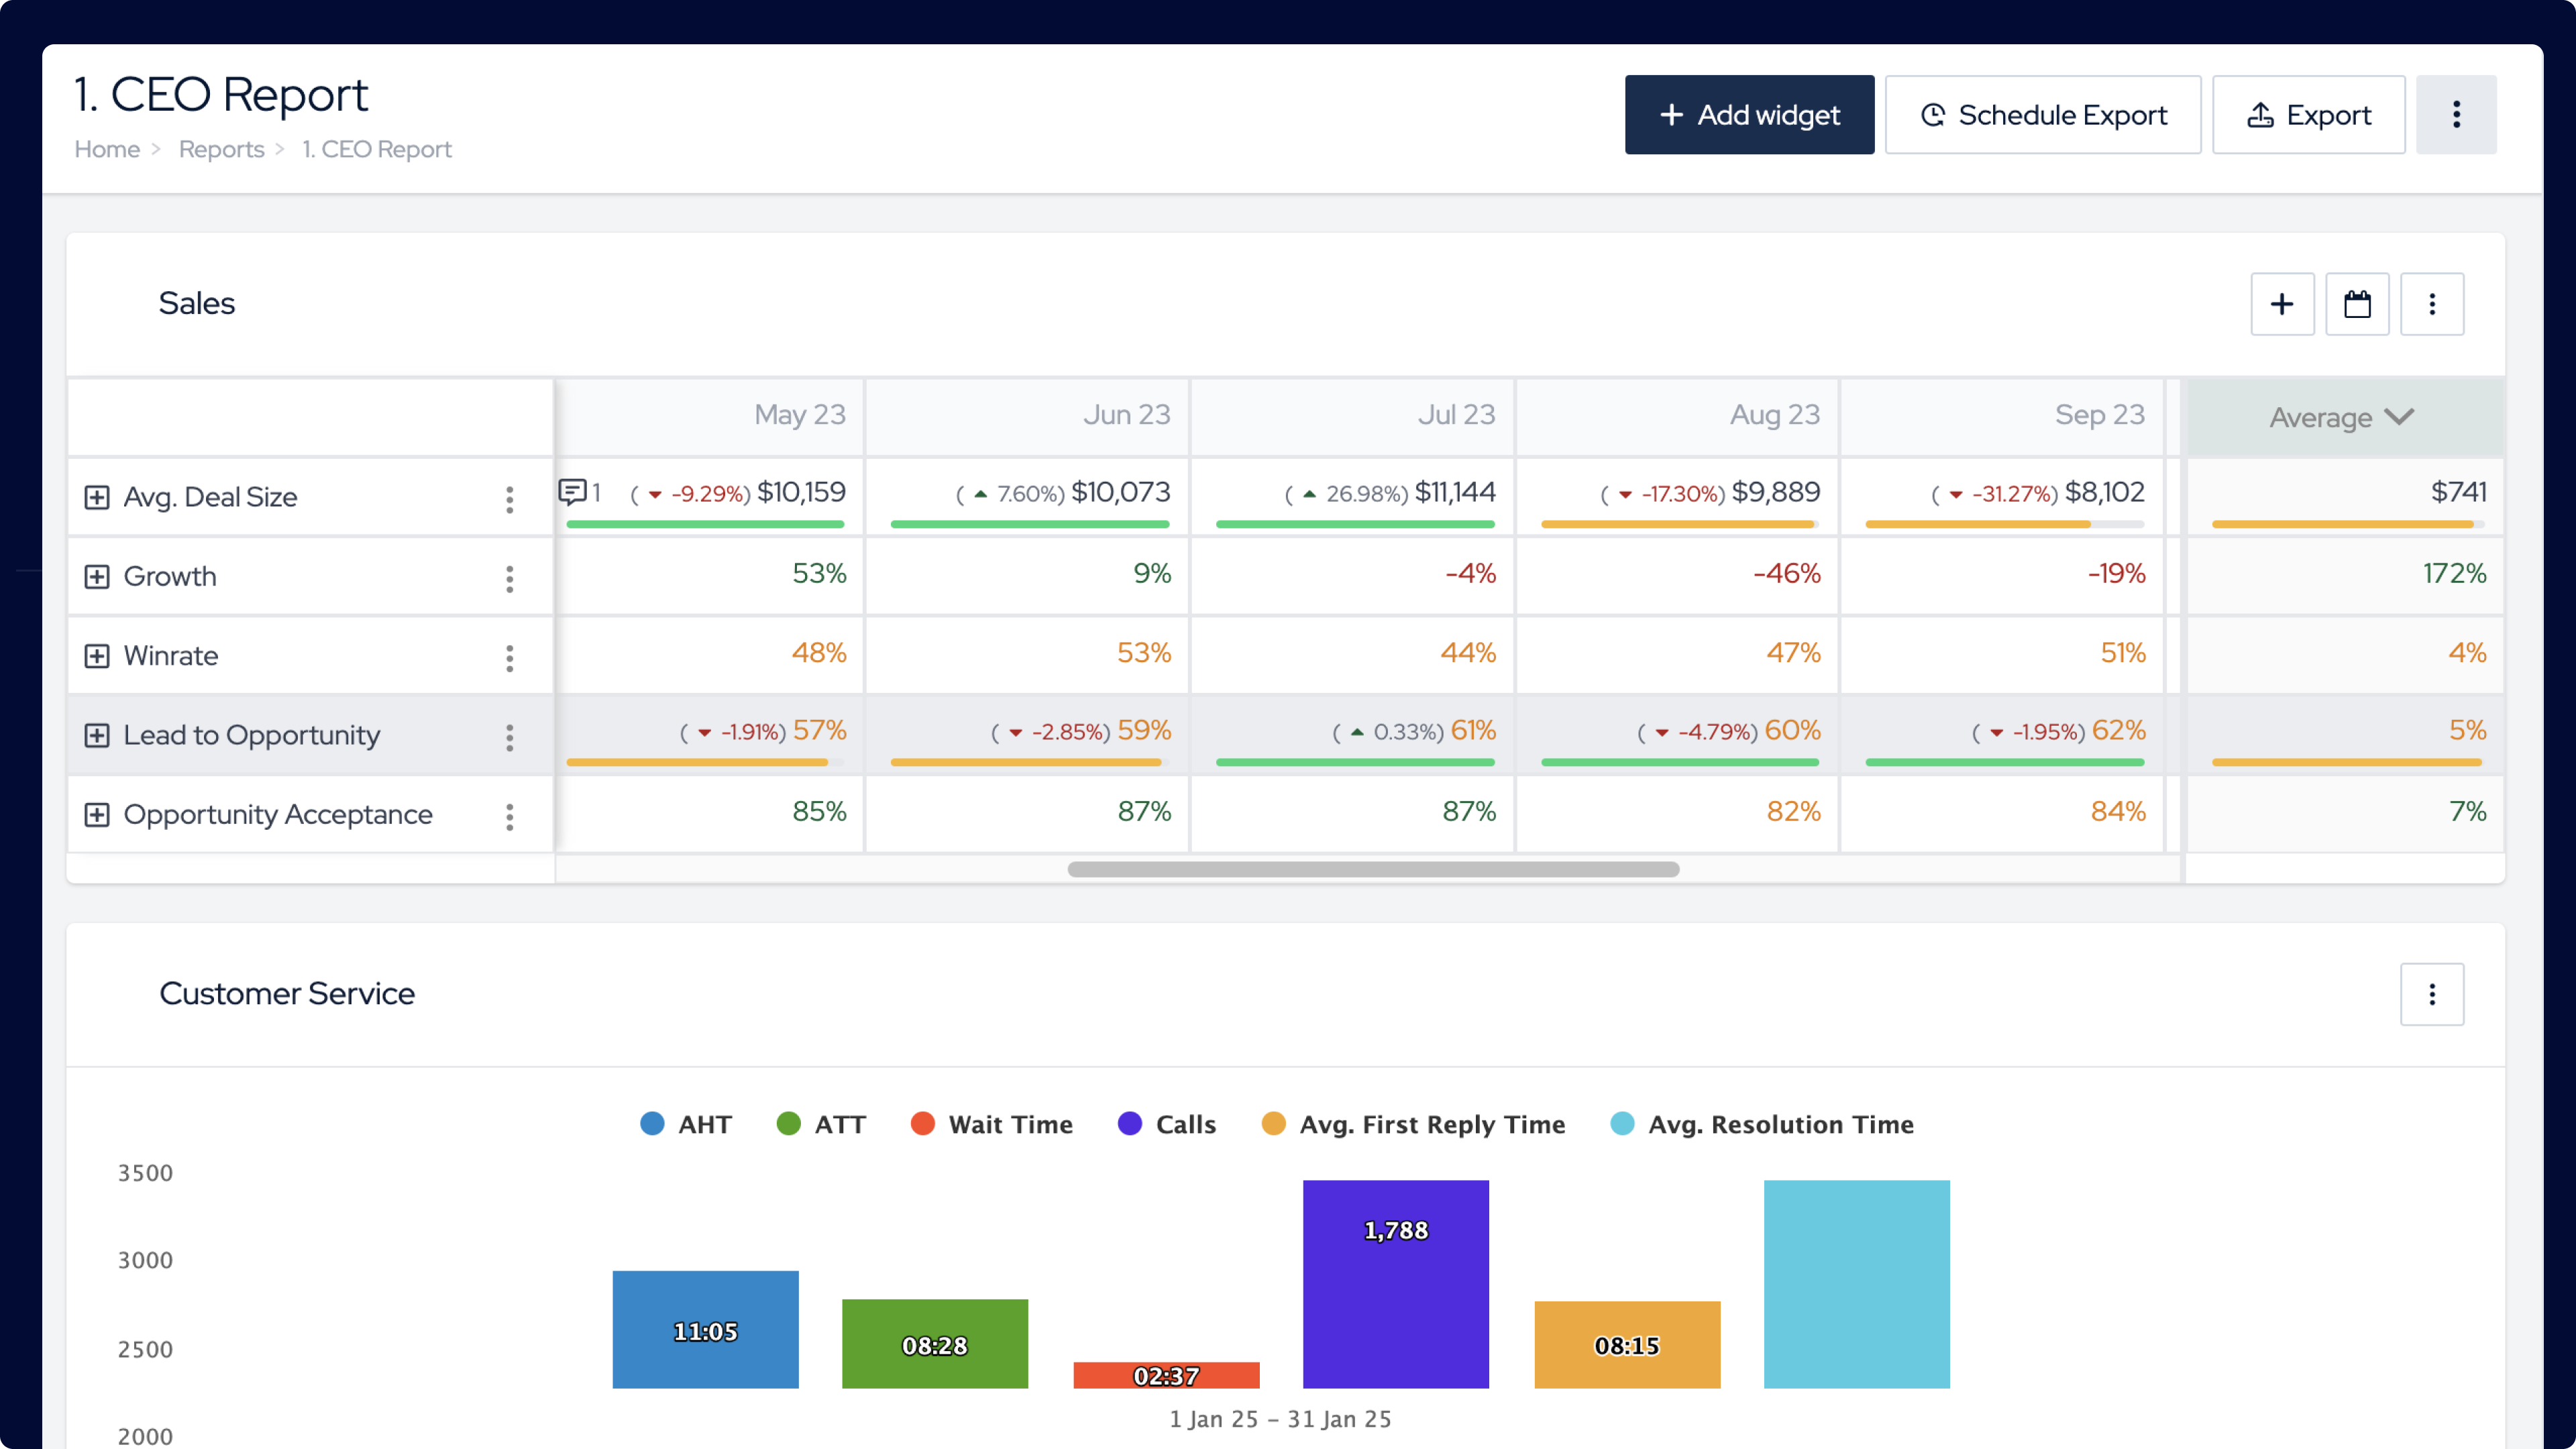
Instantly export your reports as ready-to-present in the following formats:
- PowerPoint
- PowerPoint as images
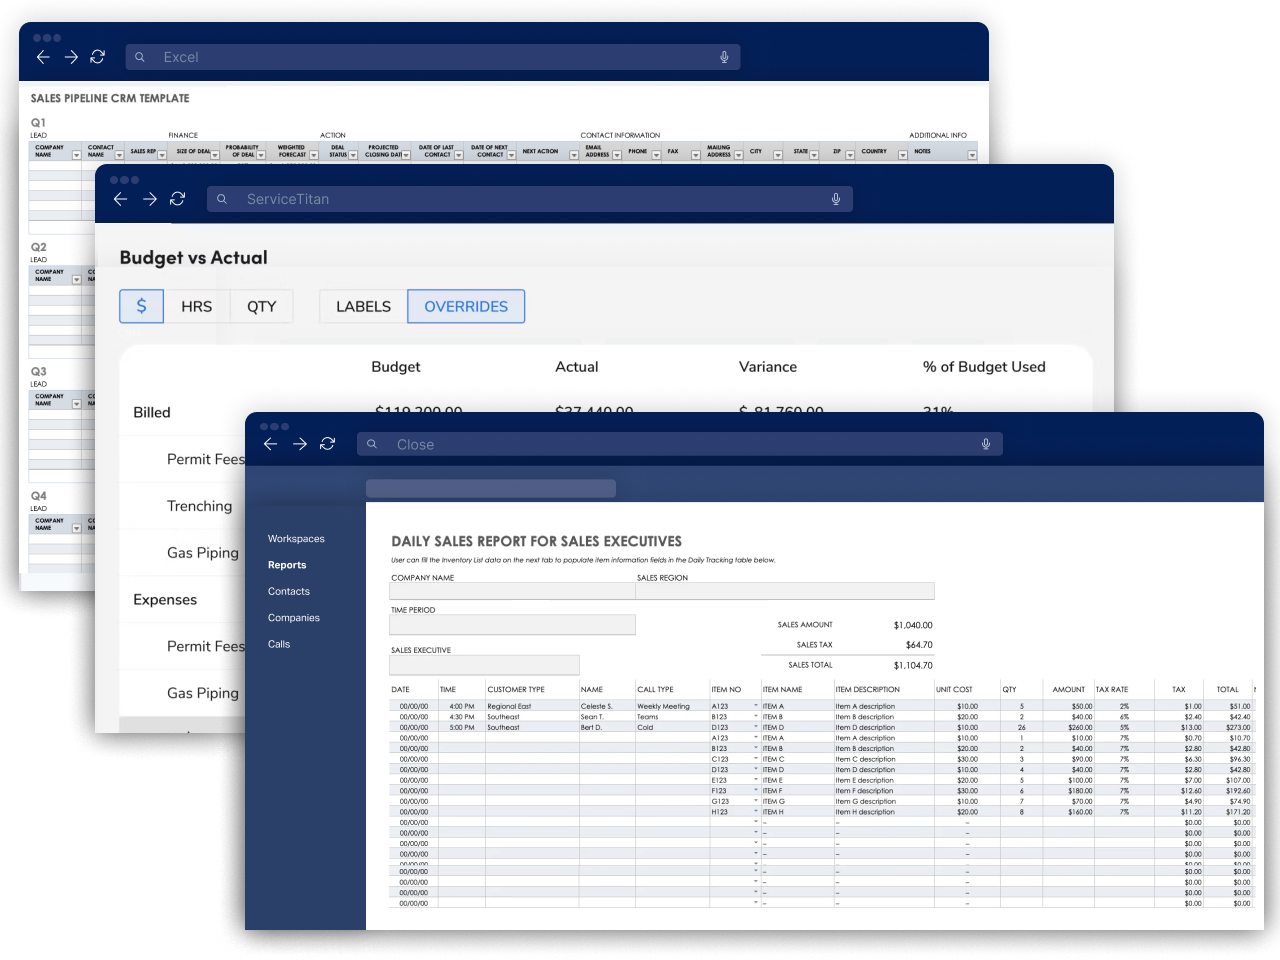
- Excel spreadsheet
Integrations
All your team's KPIs. All in one place.
Take your CRM, helpdesk, and telephony systems' KPIs and show your team how they're doing in one simple dashboard view in just seconds.

“We're saving at least 8 hours a day just on team leaders not having to organize and gather data manually. On top of that, Plecto saves us a full-time employee every month!”

Johan Hilding
CEO and Co-Founder @ Förebygg

“I never need to use time on dragging out reports; when you have Plecto, you get everything in one solution.”

Nickolaj Boffy
Nordic Retention Team Manager @ Nets
How reports work
Meeting-ready report presentations made in minutes. Here's how...
Step 1. Setup once
Choose what's on your reports from the formulas you've already created. Set once, enjoy forever with automatic, real-time updates.
Step 2. Schedule
Want to receive your reports directly in your inbox at 9am everyday? Customize and schedule to suit your reporting needs.
Step 3. Export
Export recurring real-time reports or even as ready-made Powerpoint presentations whenever and as often as you need them.
Simpler than alternatives.
No coding or BI skills needed.
It's never been easier to go deeper into your data. Use filters to see whose performing and which areas are driving the most revenue without needing niche BI knowledge or waiting on a budding analyst to tell you how your team's performing in a language you don't understand.
Sign Up