
Real estate dashboard examples
Live KPI dashboard insights for real estate teams to level up
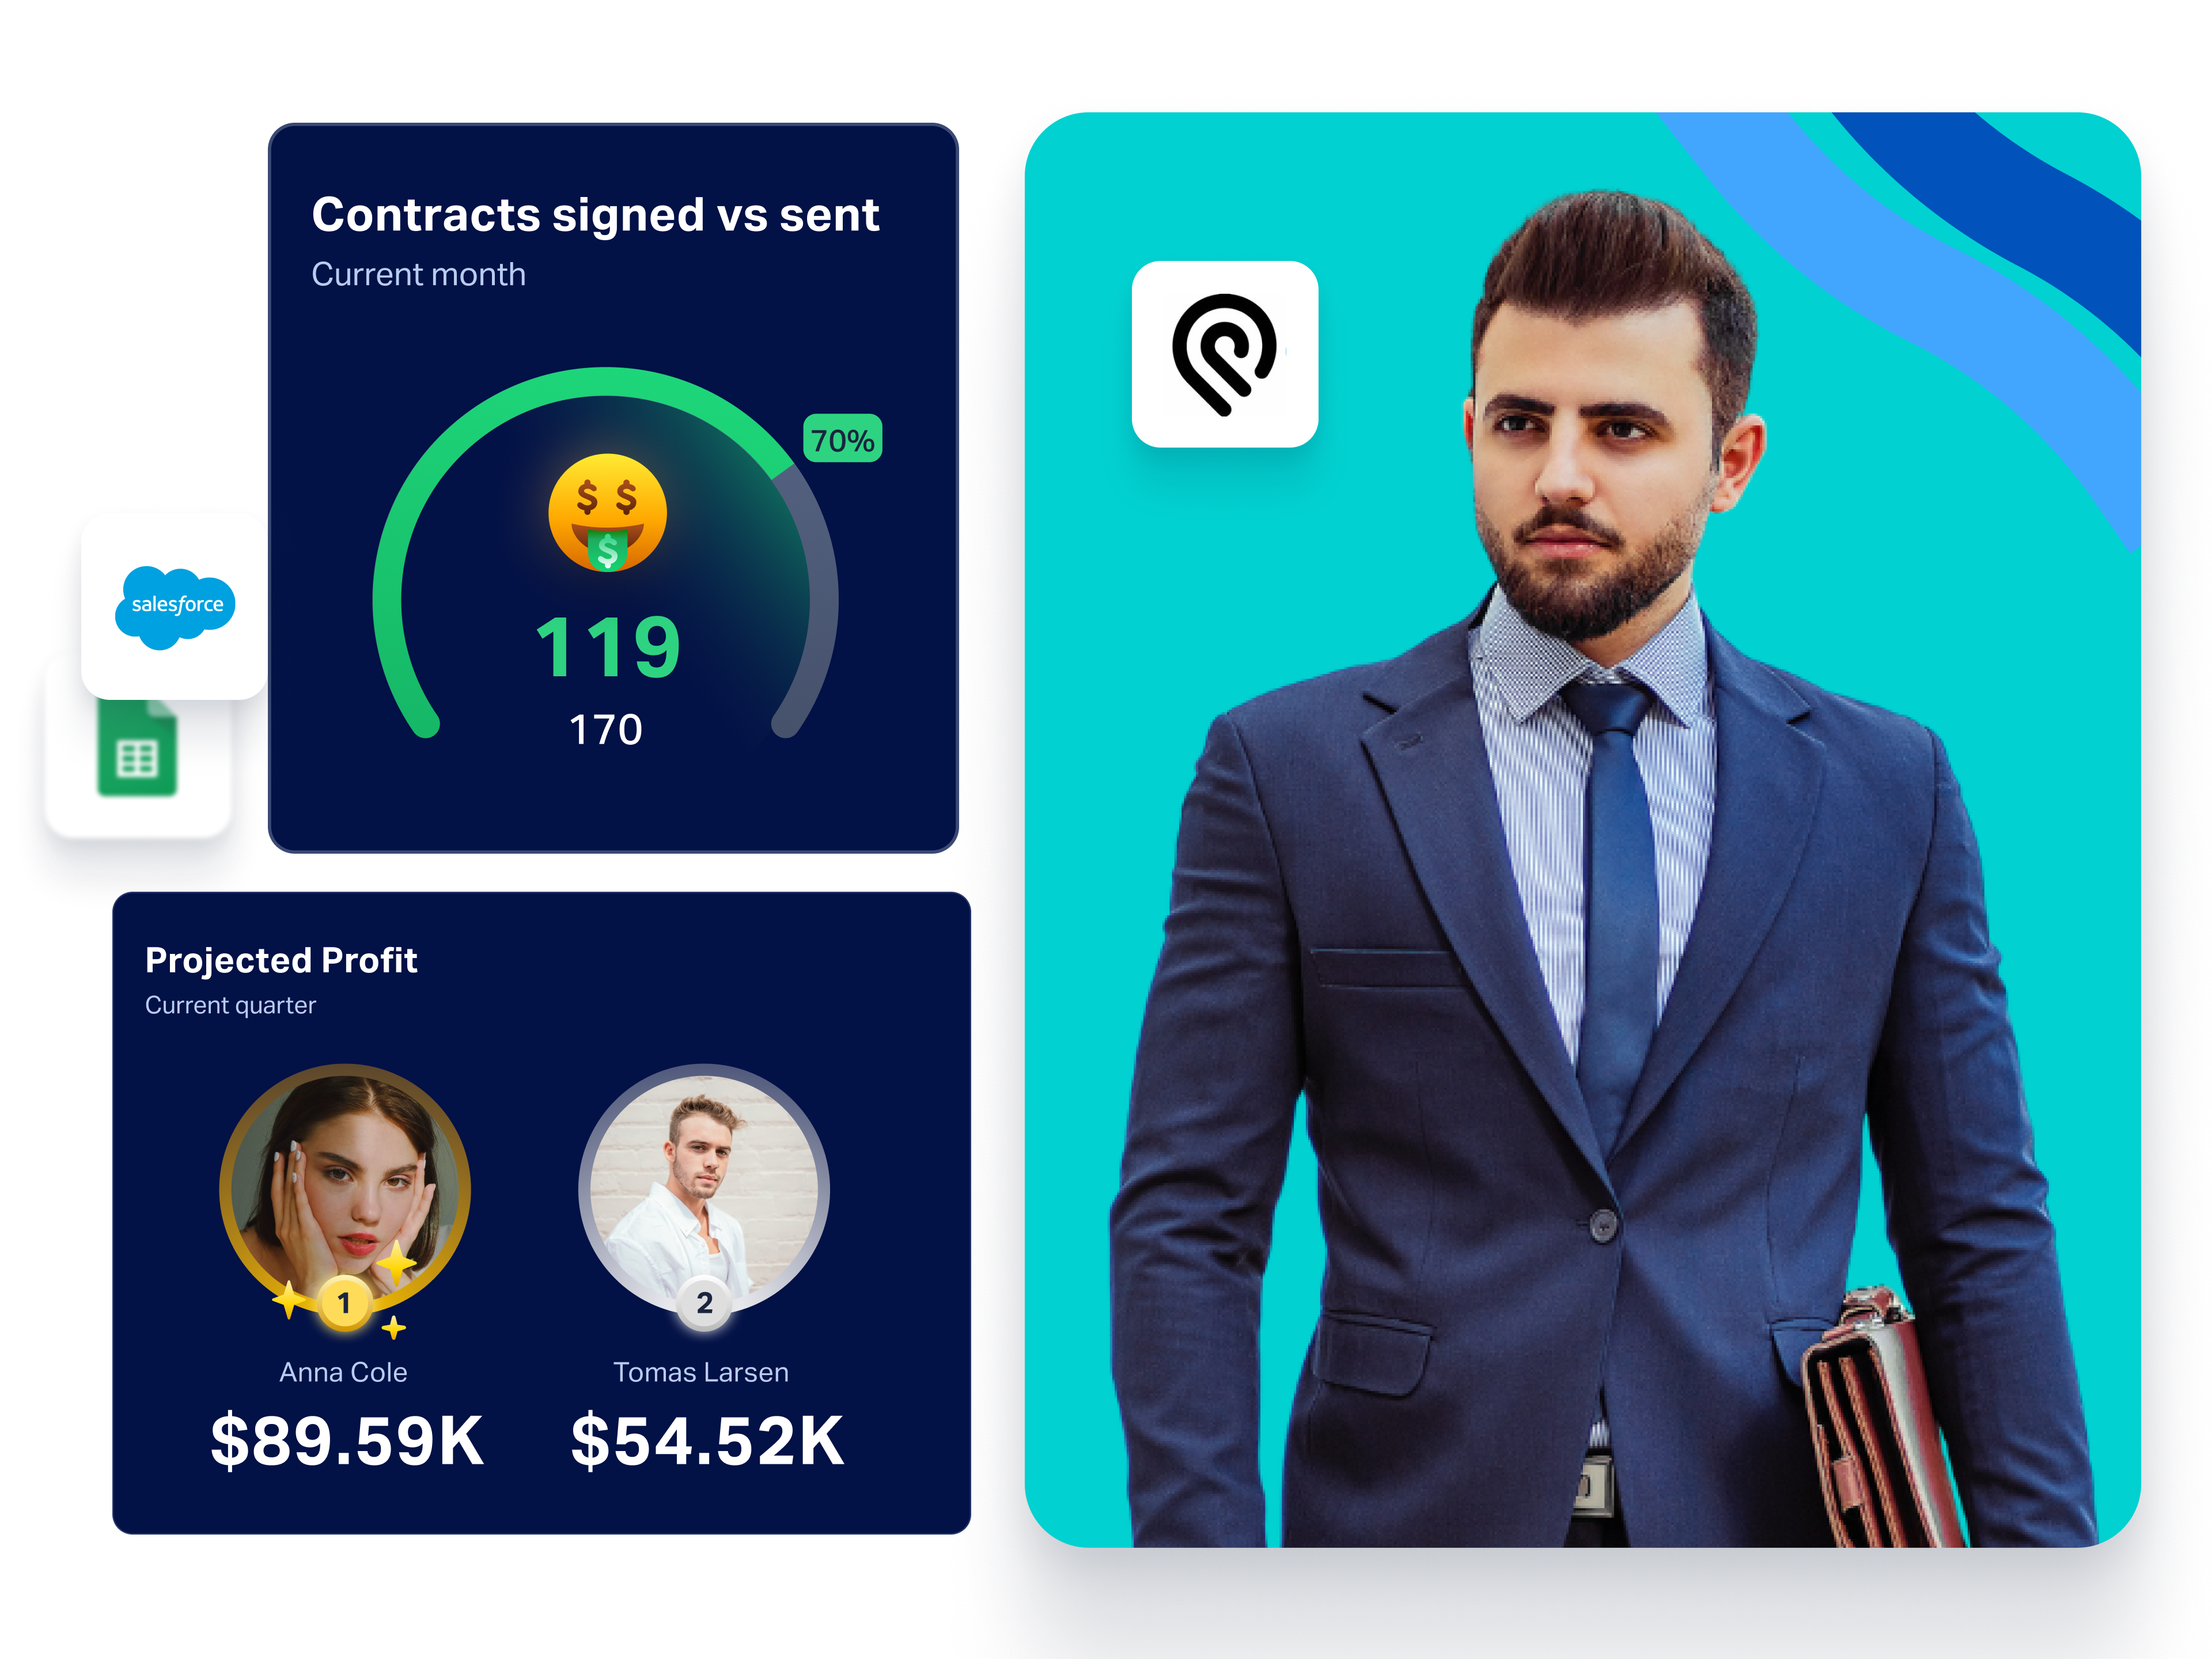
Visualize KPIs across acquisitions, dispositions, lead management, and marketing—designed for sales or lead managers, campaign stakeholders, and wholesalers who need full visibility to make faster decisions.
Dashboard Example 1
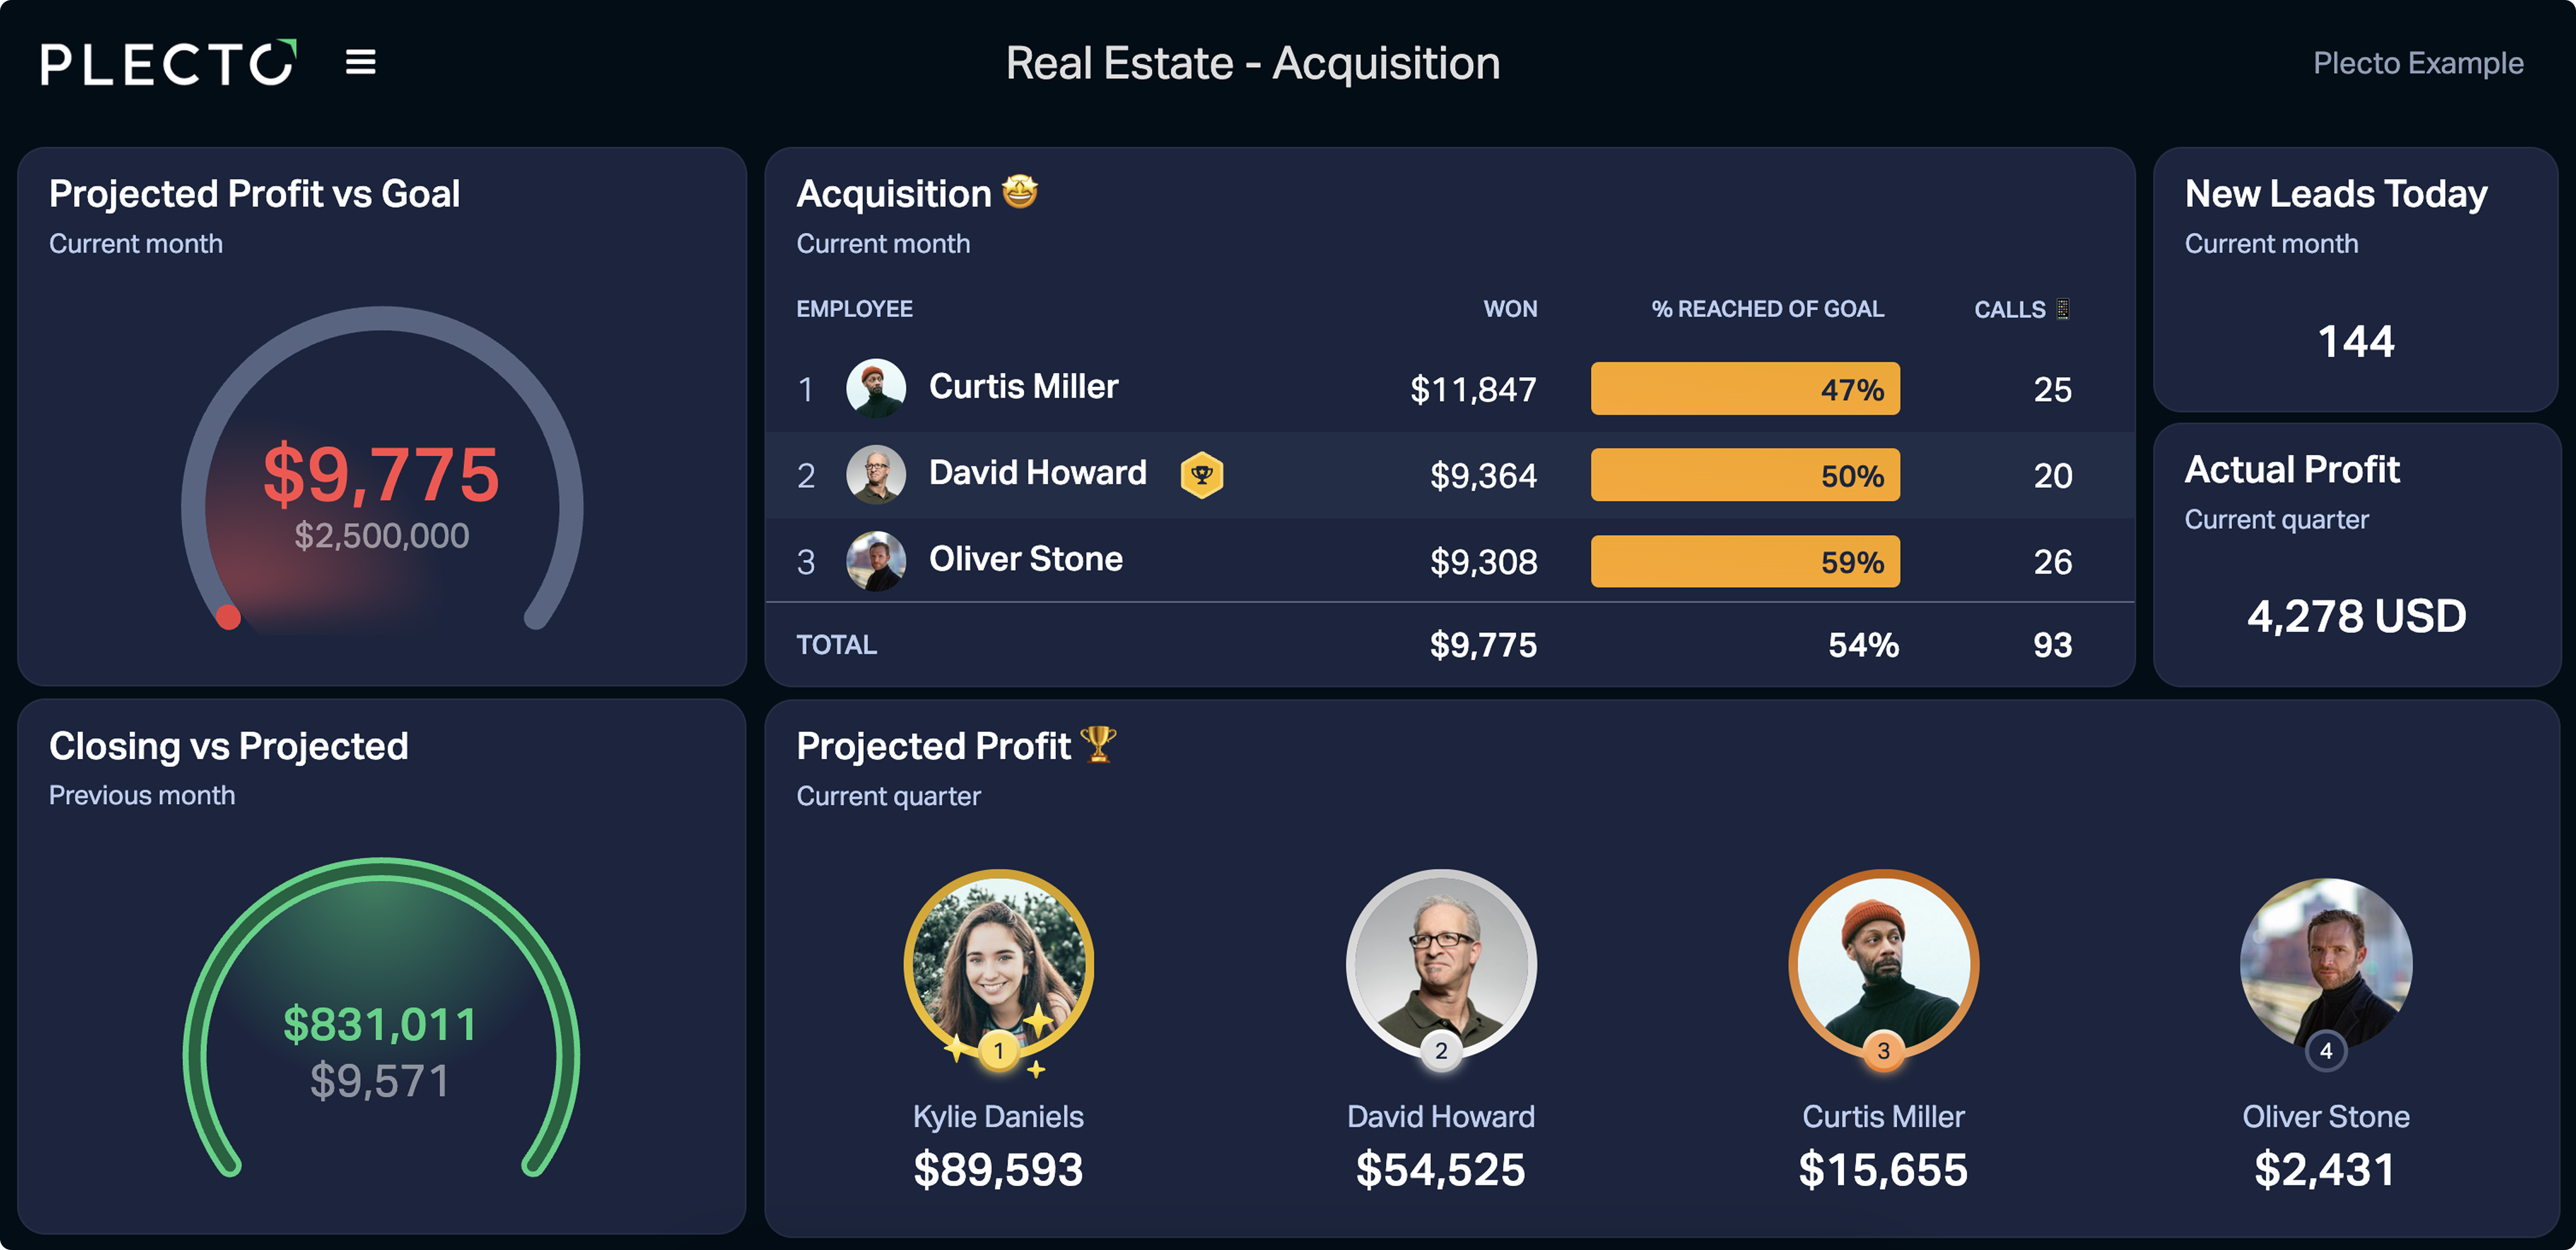
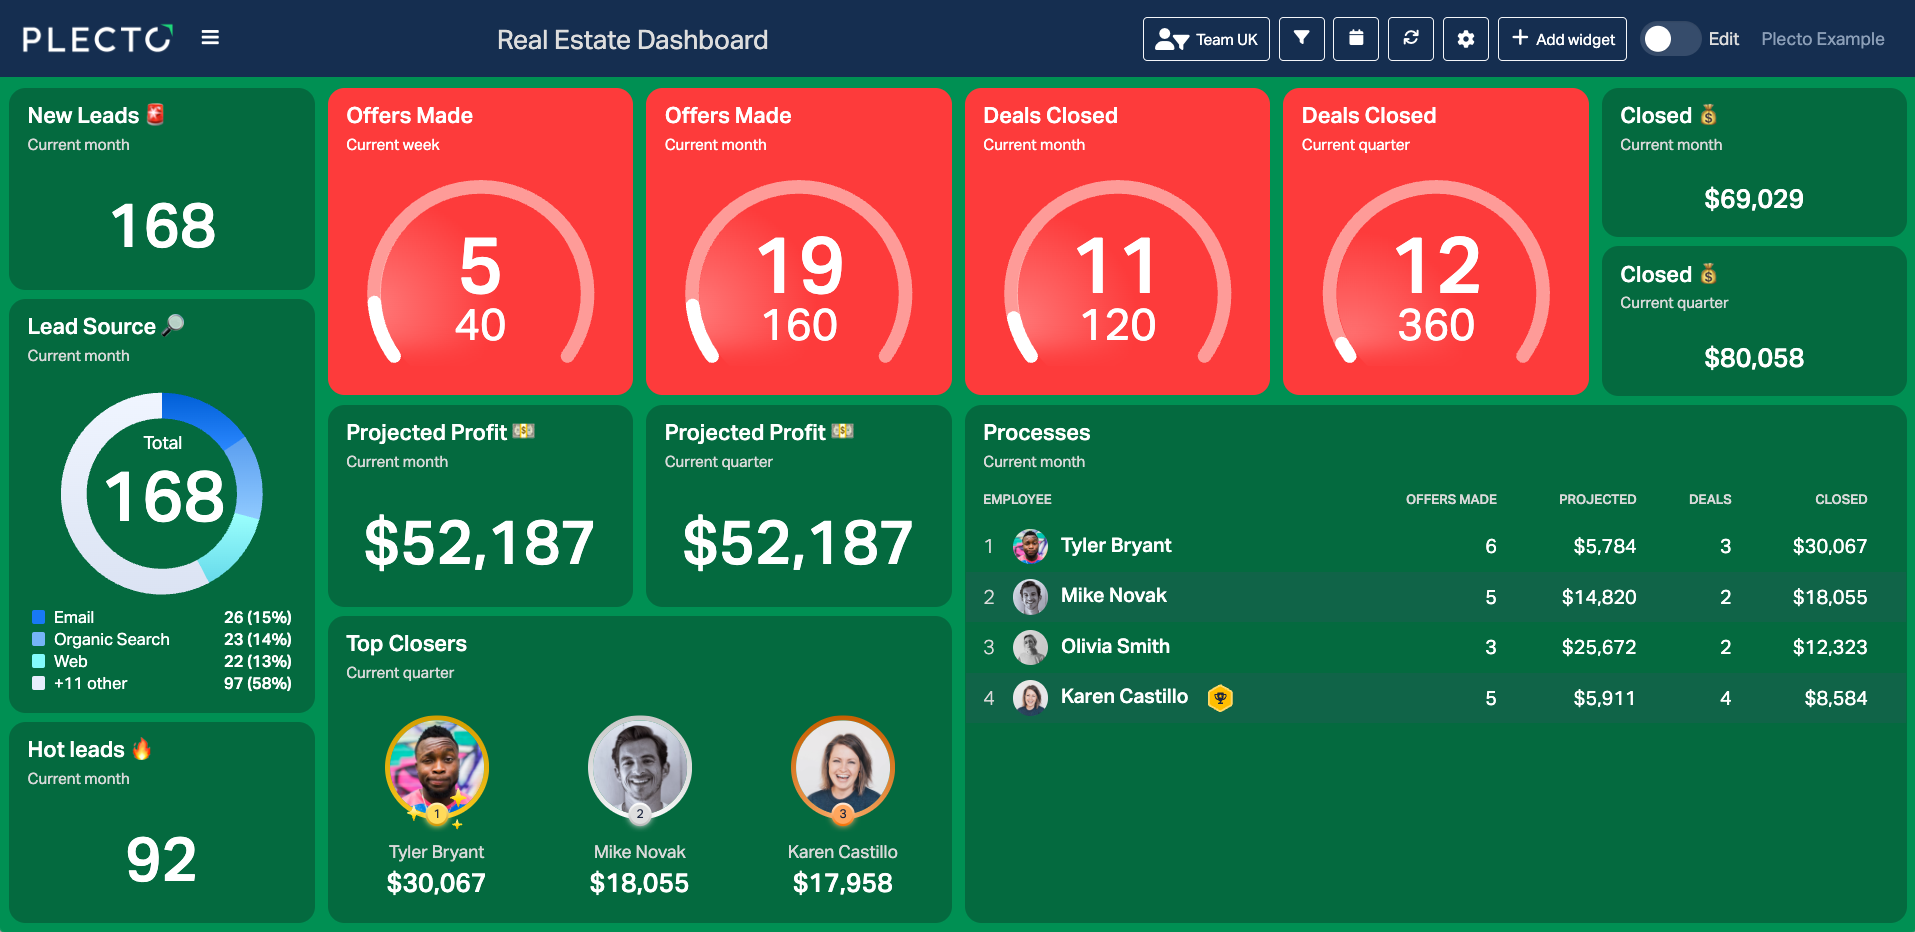
Real Estate Acquisitions Team Dashboard Example
Get a real-time view of your acquisitions pipeline—track offers made, appointments completed, deals under contract, and rep performance. Perfect for sales managers, acquisitions reps, and owners looking to coach their team and hit revenue targets.
Benefits
Why use real estate dashboards?
Track deals in real time
See active contracts, appointments set, offers made, and pipeline value—so you always know where every lead and deal stands.
Uncover pipeline slowdowns
Spot aging leads, unworked opportunities, or properties stuck in contract. Take action before deals fall through or timelines slip.
Boost team performance
Compare rep activity across acquisitions and dispositions. Highlight top closers, motivate with leaderboards, and hold the team accountable.
Improve marketing ROI
Monitor CPL, cost per contract, and lead quality by channel—across direct mail, PPC, cold calls, and more. Cut waste, double down on what works.
Align teams around revenue
Connect marketing, lead management, and sales with one source of truth. Everyone—from lead managers to owners—sees how their role drives closings.
Drive employee motivation and retention
Getting recognition, comparing performance, and seeing their own commission keeps reps engaged, competitive, and striving toward team goals.
Dashboard Example 2
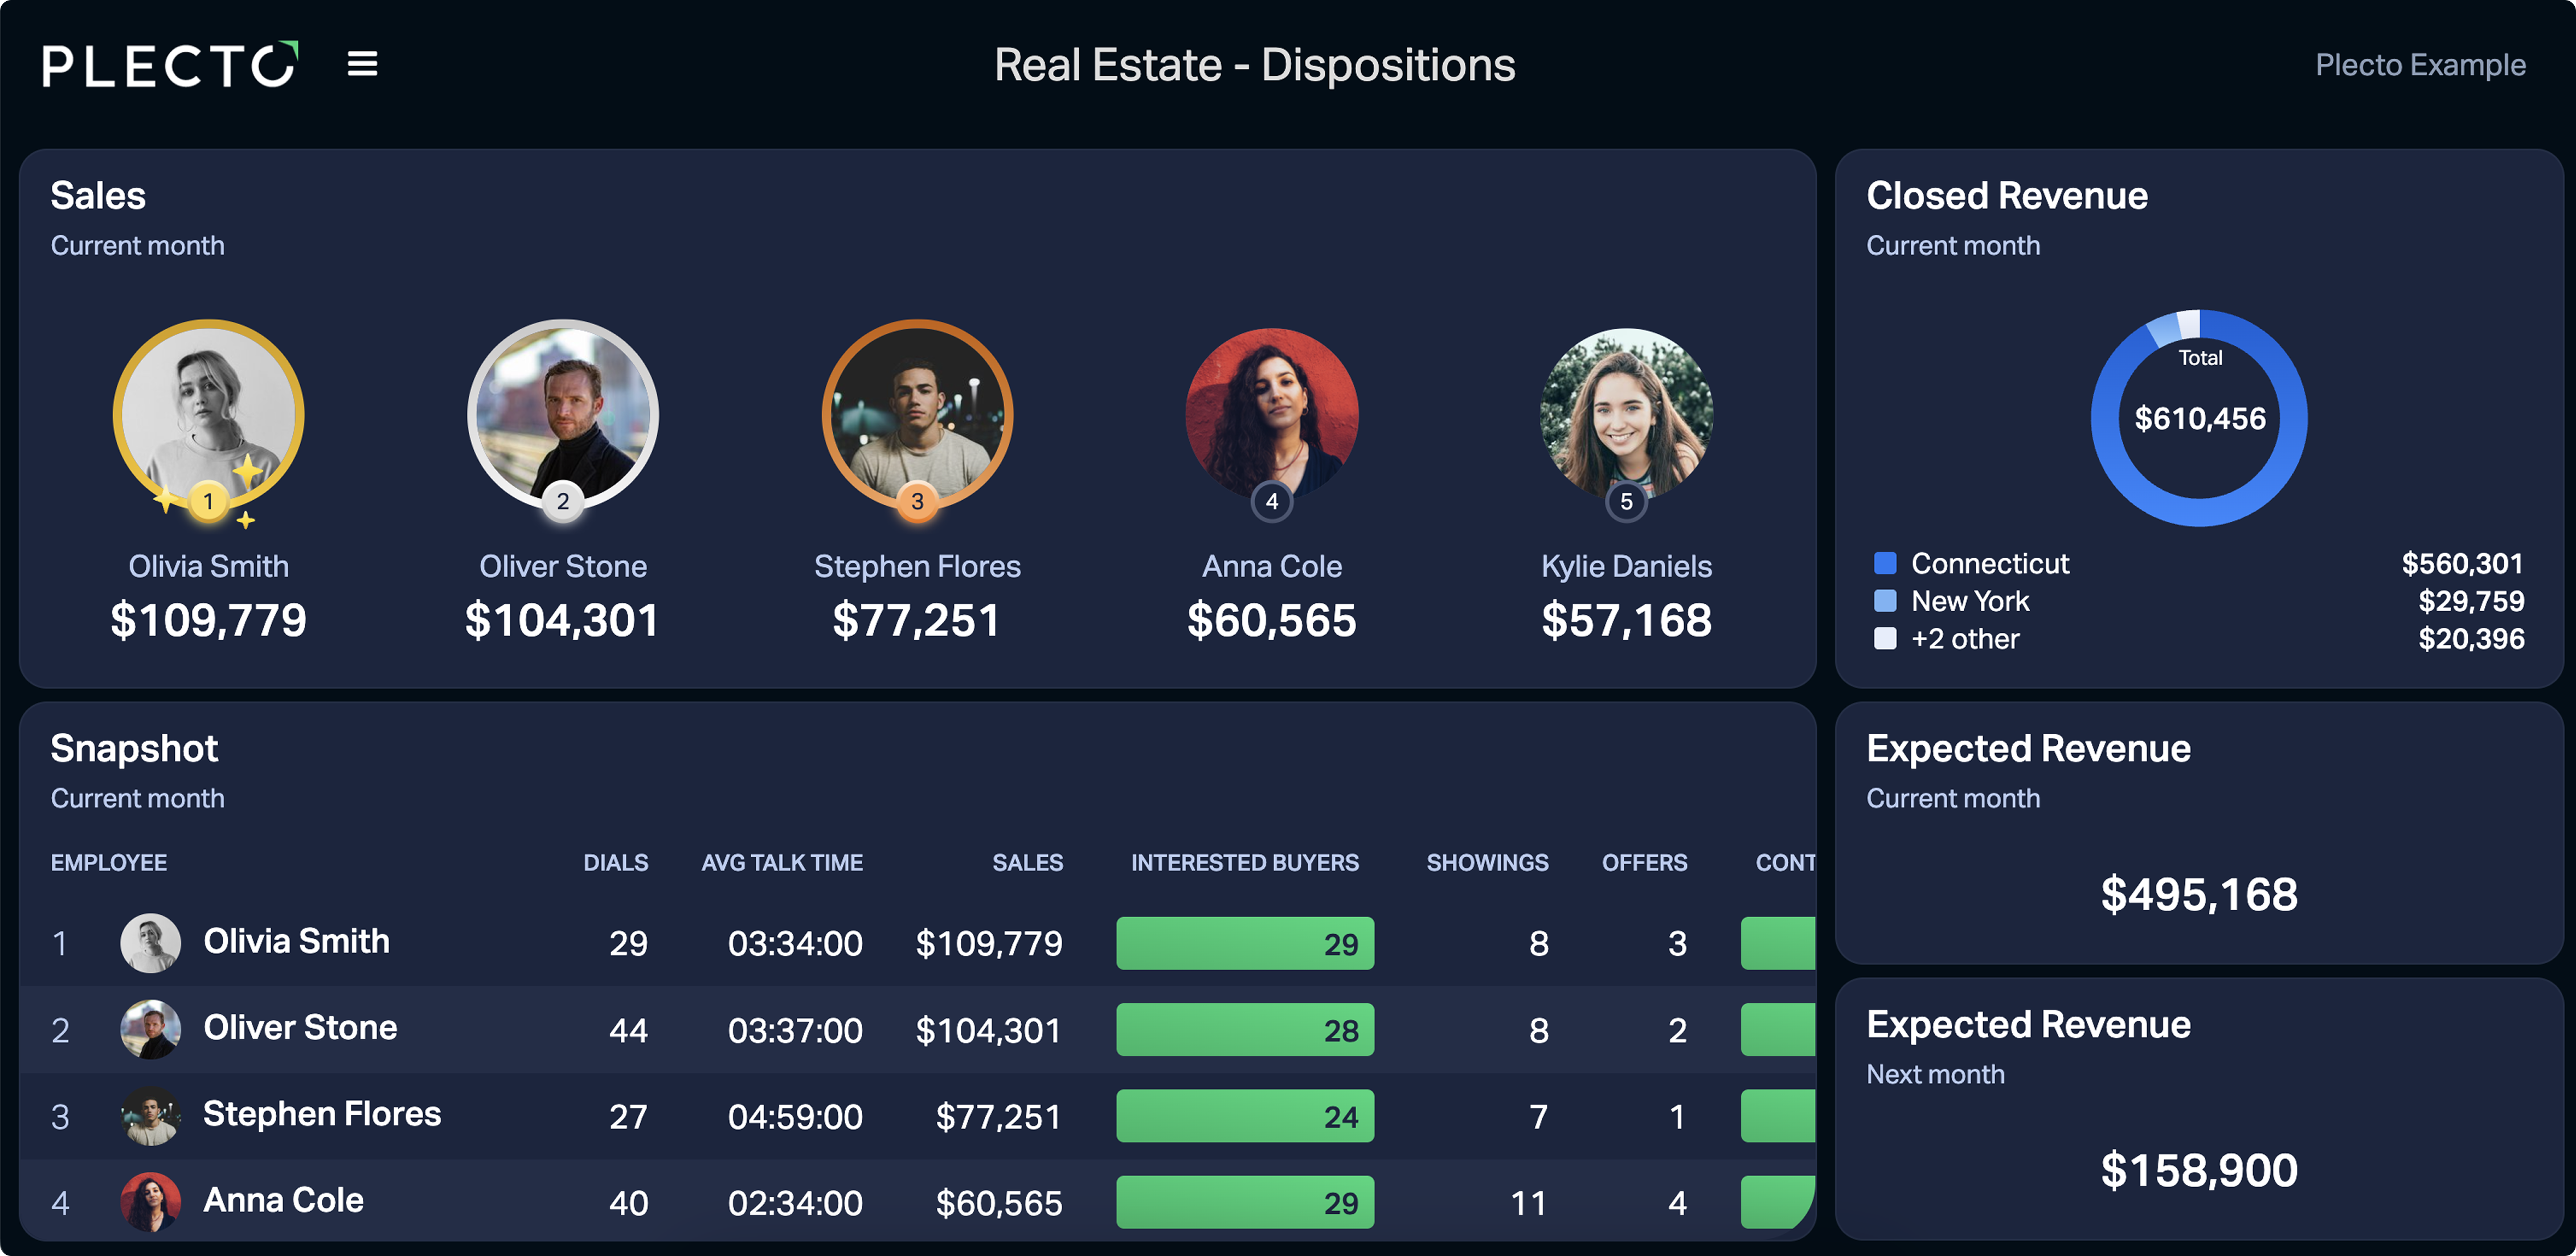
Real Estate Dispositions Team Dashboard Example
Monitor call and buyer activity, deal status, and revenue progress (perhaps even by location) to keep closings on track and profitable. Ideal for dispositions managers and sales leaders who want to move contracts fast and optimize margins.

“From a manager's perspective, I really like Plecto's overview of all results, all activities. Now I can see every day, even when I’m not at the office, what’s going on right now.”

Martin Berg
Owner and Estate Agent
Dashboard Example 3
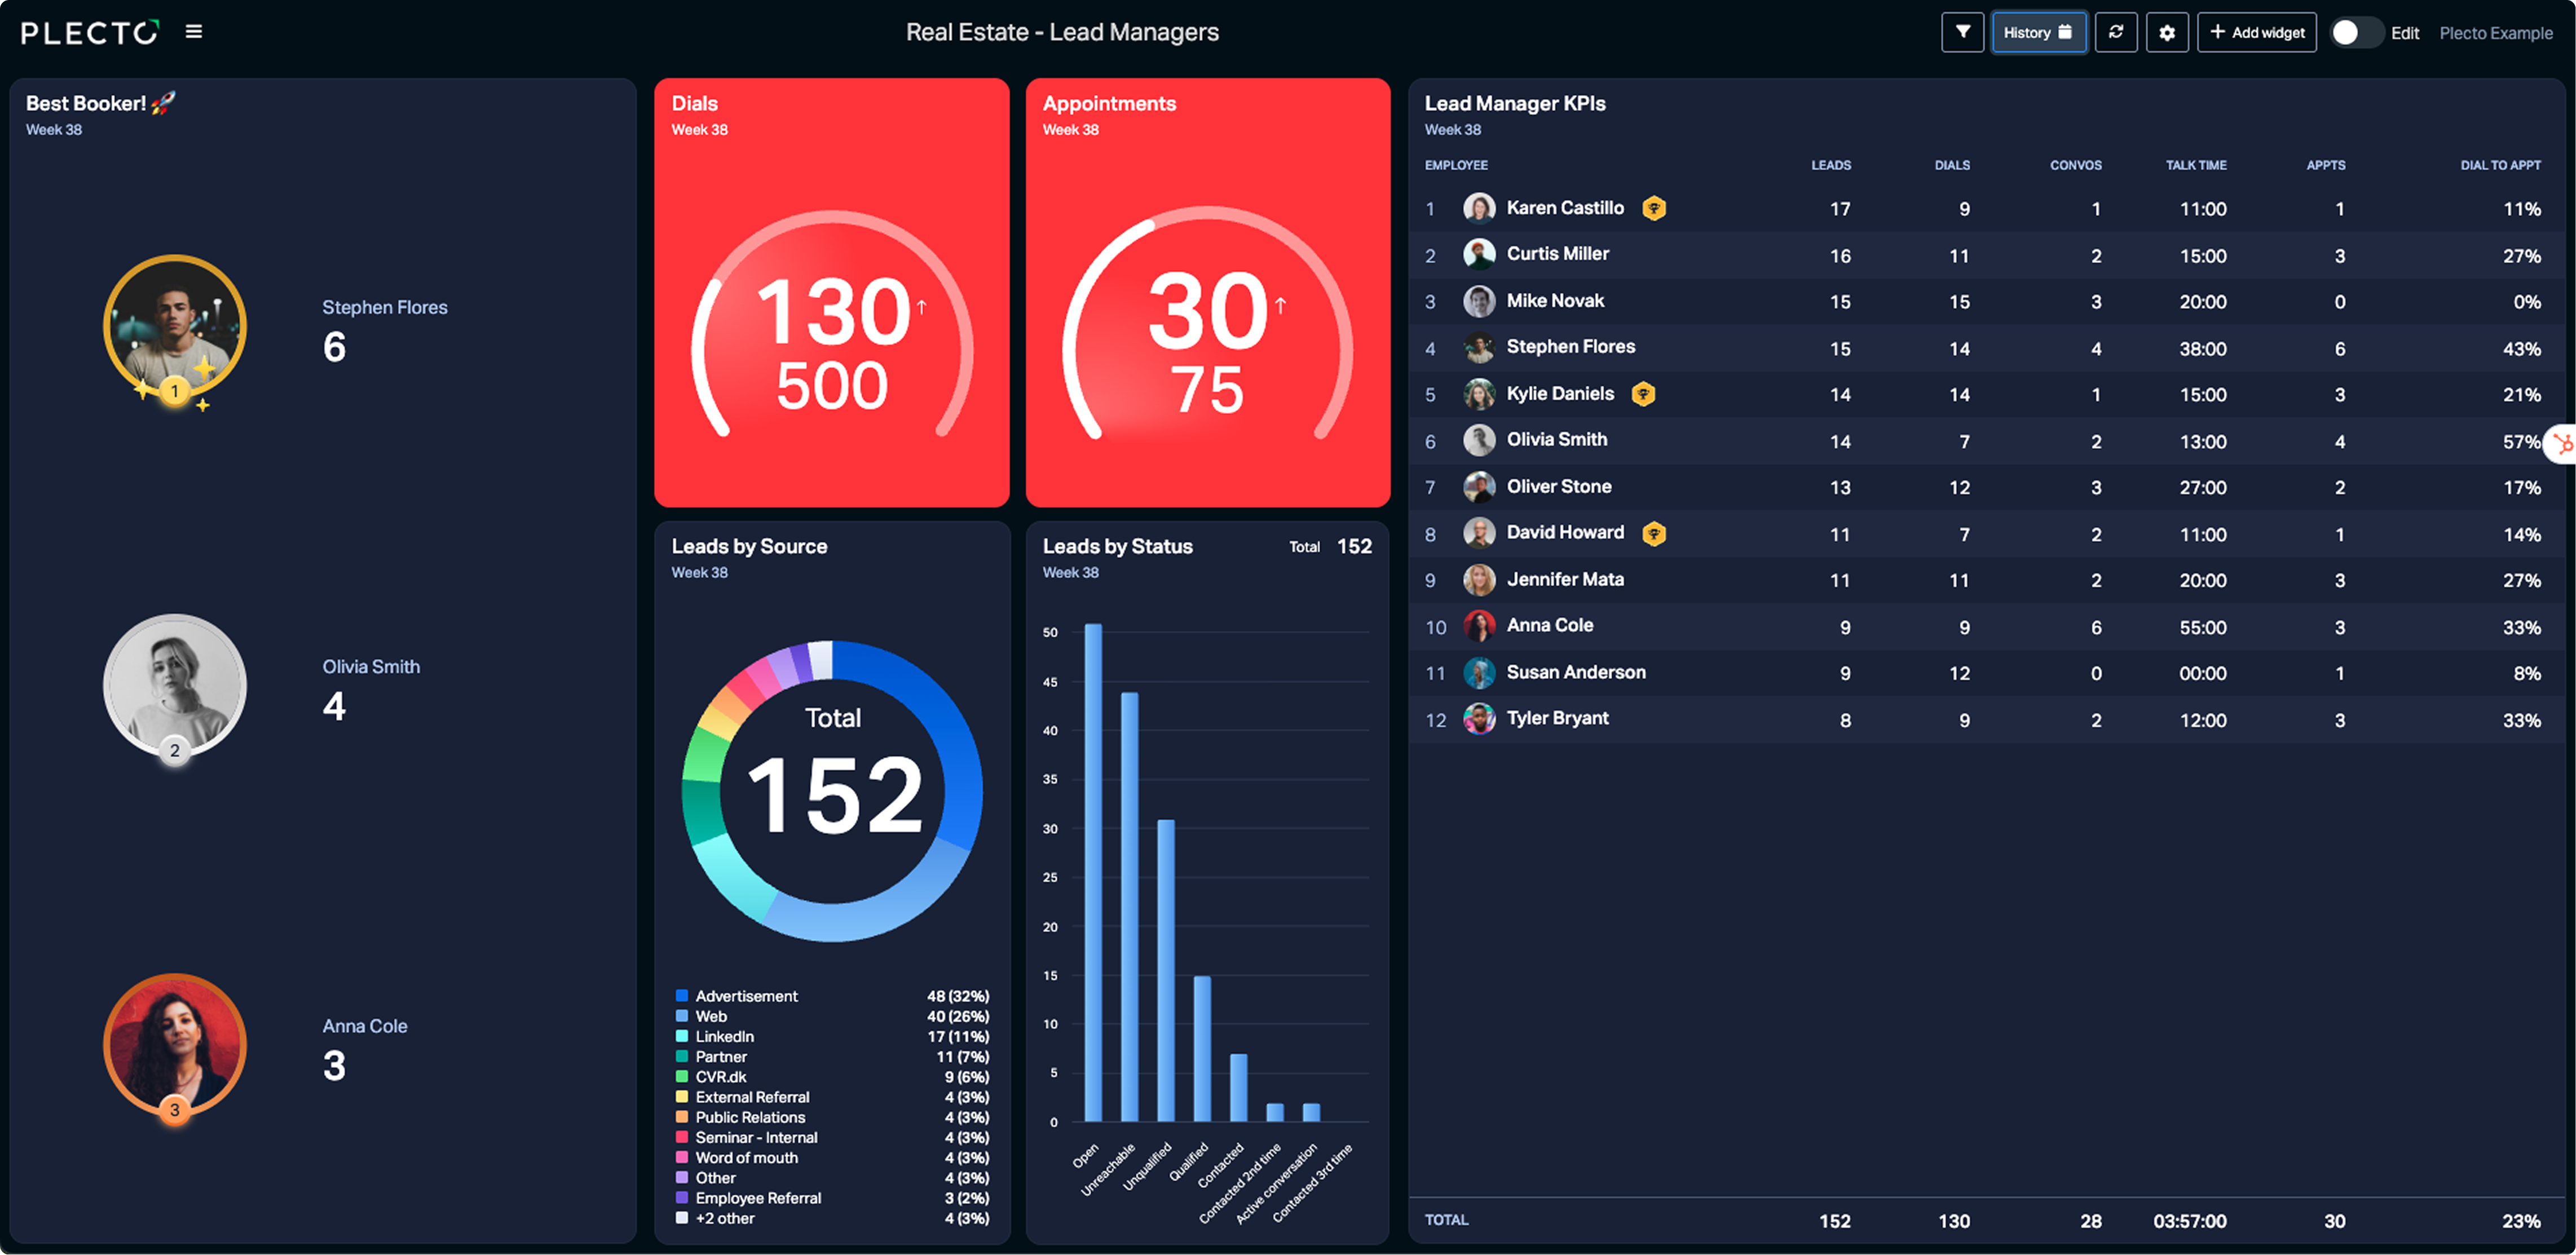
Real Estate Lead Manager Activity Dashboard Example
Stay ahead of lead flow, follow-ups, and conversion rates in one streamlined view. Built for lead managers and inside sales coordinators who need to manage pipeline health and ensure no lead gets left behind. Click on the dashboard below to build your own.
Real estate dashboard KPIs
To get a complete view of your property pipeline, include KPIs that track every stage—from lead generation and follow-up to acquisitions and dispositions. Focus on metrics that reveal activity levels, deal progress, and team performance to ensure you’re always driving toward more closed deals.
Leads by source
Tracks the number of leads coming in from each channel (calls, referrals, online, direct mail)
Outbound calls made
Measures the volume of calls reps place to prospects and sellers.
Lead response time
Measures the average time taken to follow up on new leads.
Lead-to-appointment conversion rate
Percentage of leads that result in booked appointments.
Appointments held
The number of meetings booked and attended by sellers or buyers.
Offers made
Number of purchase offers submitted by the real estate agent to property owners.
Deals closed
The number of finalized acquisitions or dispositions.
Revenue generated
Total commission or assignment fees earned from all agents' closed deals.
Active contracts
Deals currently under contract but not yet closed.

50% more calls made with Plecto dashboards
“For a company that is always on the phone, we want to be able to see what people are doing. Most of the team are making over 200 calls... where previously 200 calls meant you'd had an incredible day. So it's obviously helping a lot!”

Matt Vickers
Operations Manager at The Insurance Surgery
Dashboard Example 4
Real Estate Executive Overview Dashboard
A high-level dashboard for CEOs, founders, and partners who want instant visibility into revenue, deal flow, team KPIs, and marketing performance—without digging through reports.

“Through gamification and visualization, Plecto has helped improve the company culture. We now experience a much better buy-in from our employees who take responsibility for the company’s key results. There’s a great team focus on ”getting the numbers green” by achieving targets. The increased engagement and motivation help us reach ambitious goals.”

Anders Eiler
CSO eCommerce
Dashboard Example 5
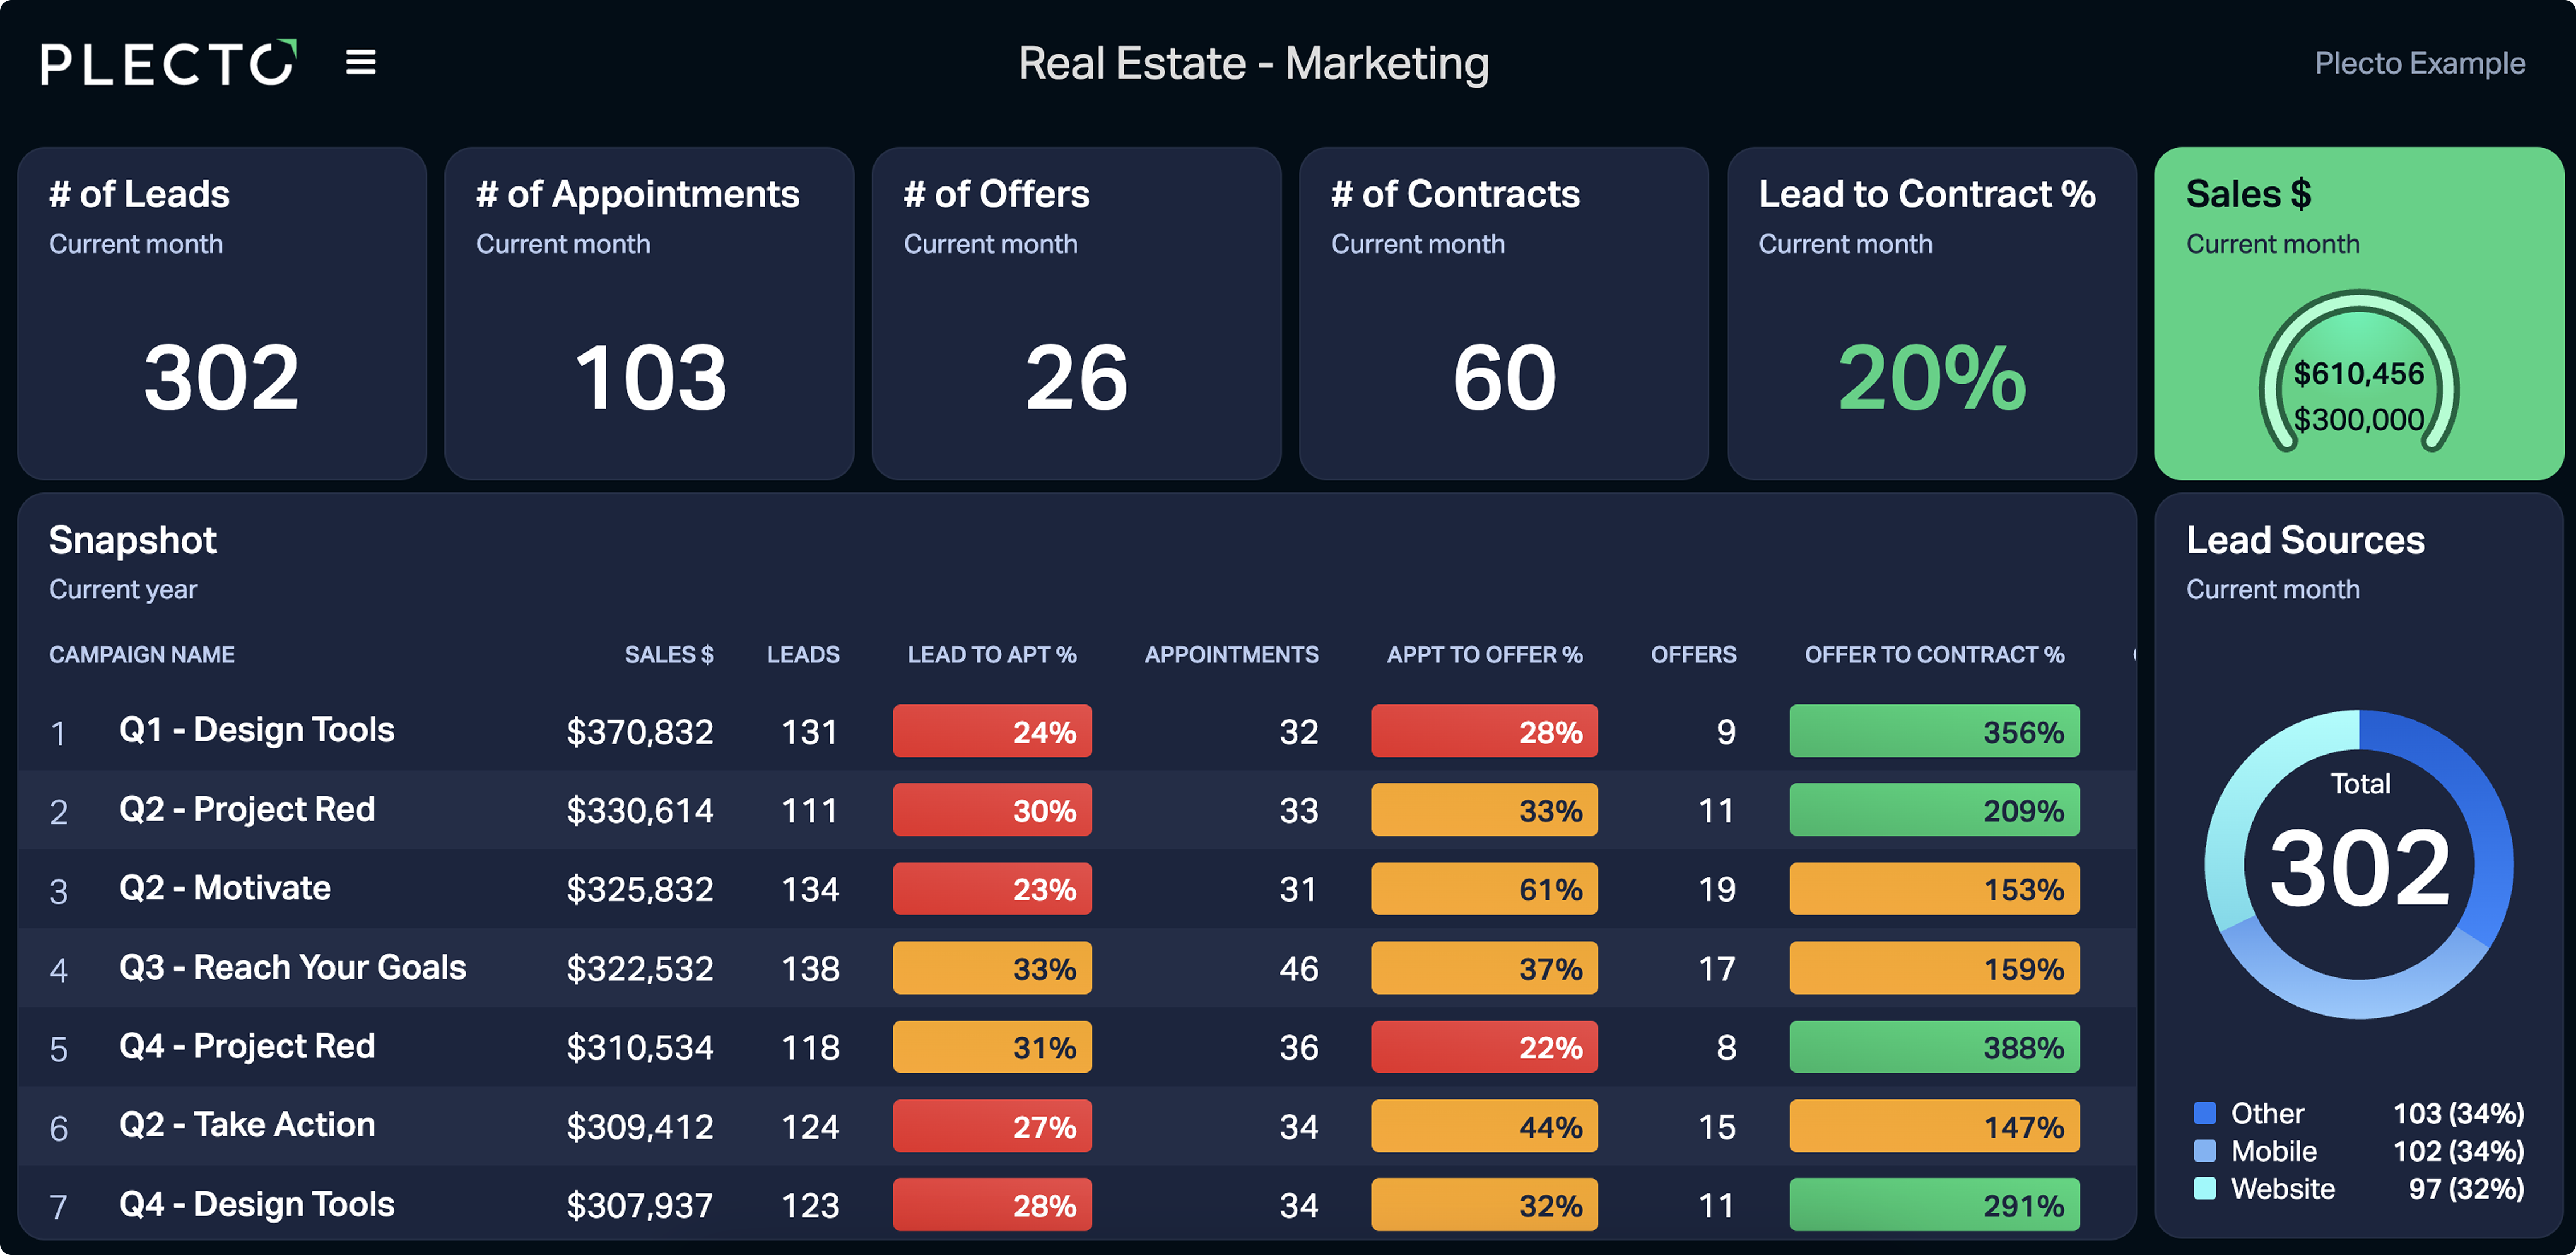
Real Estate Marketing Performance Dashboard
Track CPL, ad spend, lead volume, and campaign ROI to make smarter marketing decisions. Designed for marketing managers and owners looking to scale lead generation without wasting budget.
See more sales-specific dashboard examples
Sales Opportunities Dashboard
Stay informed about every stage of your sales pipeline with up-to-date dashboards.