
Keep your support team on top of every issue
Build a Freshdesk support dashboard with Plecto and ensure your team always has a clear view of what needs attention. With real-time data visualization, your agents can react instantly to customer issues, prioritize urgent tickets, and deliver outstanding service.
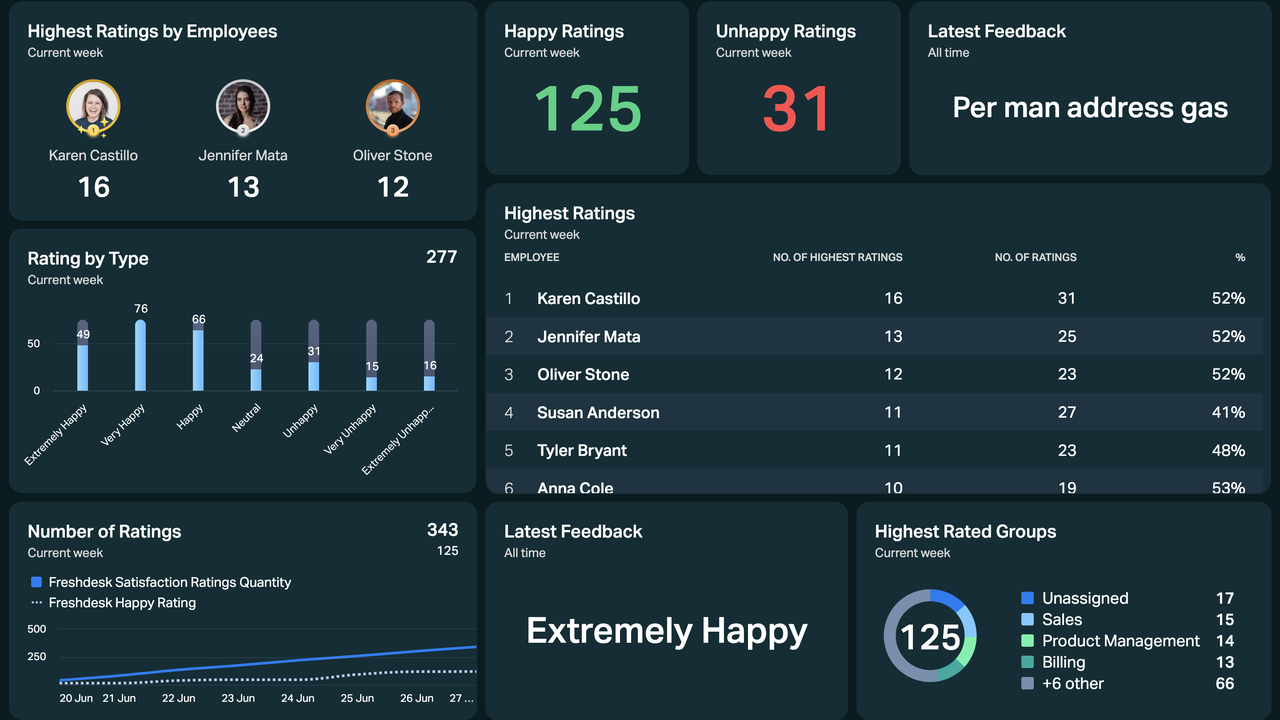
Motivate and empower your team with live dashboards
By displaying Freshdesk data on TV screens across the office, your team gets a live overview of key support metrics like CSAT, first response time, and resolution time. Plecto’s interactive dashboards help employees track their progress, take ownership of their work, and continuously improve their performance. Add engaging visualizations with graphs, speedometers, and tables, and use conditional colors to highlight progress toward goals.
Unify your Freshdesk data with other systems
Take your data visualization to the next level by integrating with your other Freshworks tools like Freshsales and Freshservice as well as 150+ other systems. Visualize critical KPIs in real time and create fully customized dashboards focused on sales hit rate, quota attainment, and customer support trends. Whether on office TVs, desktops, or mobile devices via our iOS and Android apps, Plecto ensures your team always has the data they need at their fingertips.