Visualize and gamify your Salesforce data with Plecto
Salesforce user? Connect your CRM to Plecto for real-time sales insights and increased team motivation.
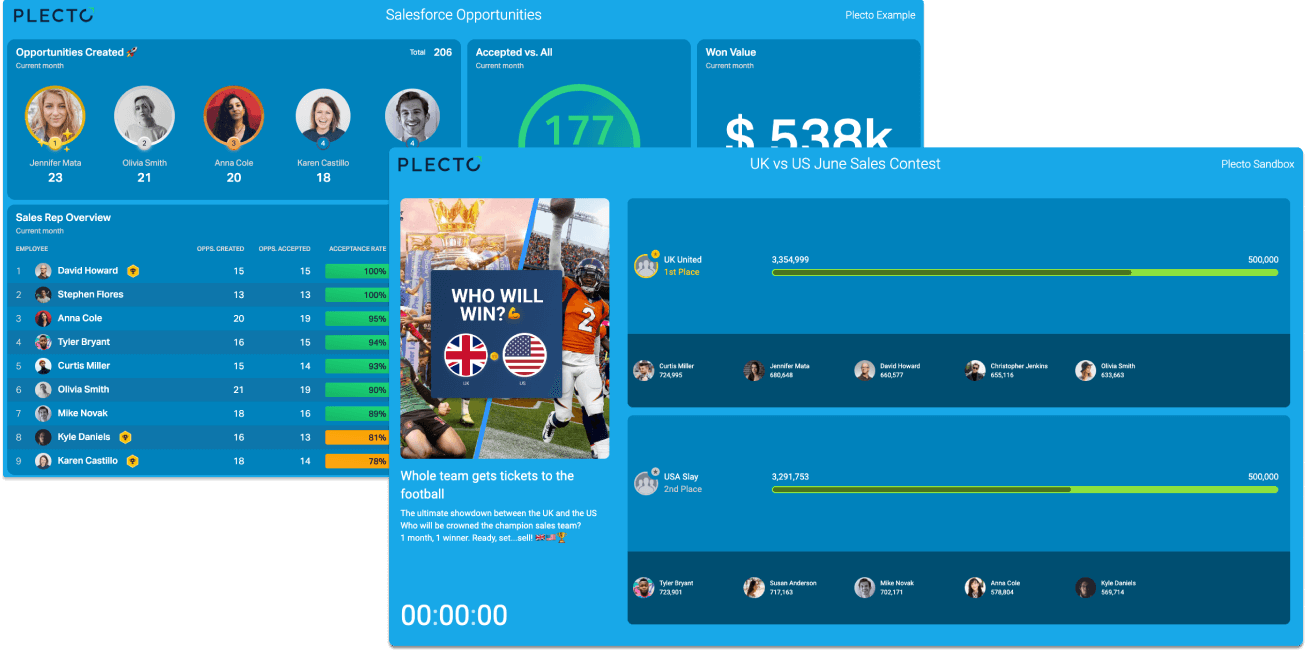
Why Salesforce users choose Plecto
Visualize all your sales performance in one place
Use Plecto’s Salesforce integration with custom objects to power unlimited real-time dashboards for KPIs and pipeline.
Your Salesforce KPIs + Plecto's gamification = a motivated team!
Gamify Salesforce to energize reps. Run contests and trigger real-time alerts for goals, milestones, and new deals.
State-of-the-art streaming for Salesforce Chat
Track Salesforce Chat SLAs in real time. Queues and longest wait are visible on live dashboards.
Ready-made dashboards, KPIs and widgets
Launch Salesforce dashboards fast with plug-and-play KPIs and a ready-made Plecto Store template.
Combine with your other systems
Go beyond Salesforce: connect 150+ integrations – telephony, finance, projects – into one Plecto dashboard.
Invest in your employees' development
Use Plecto to streamline professional development — coaching, training, and feedback all in one place.
Sign Up