
Excel Dashboards
Turn Excel spreadsheets into real-time dashboards
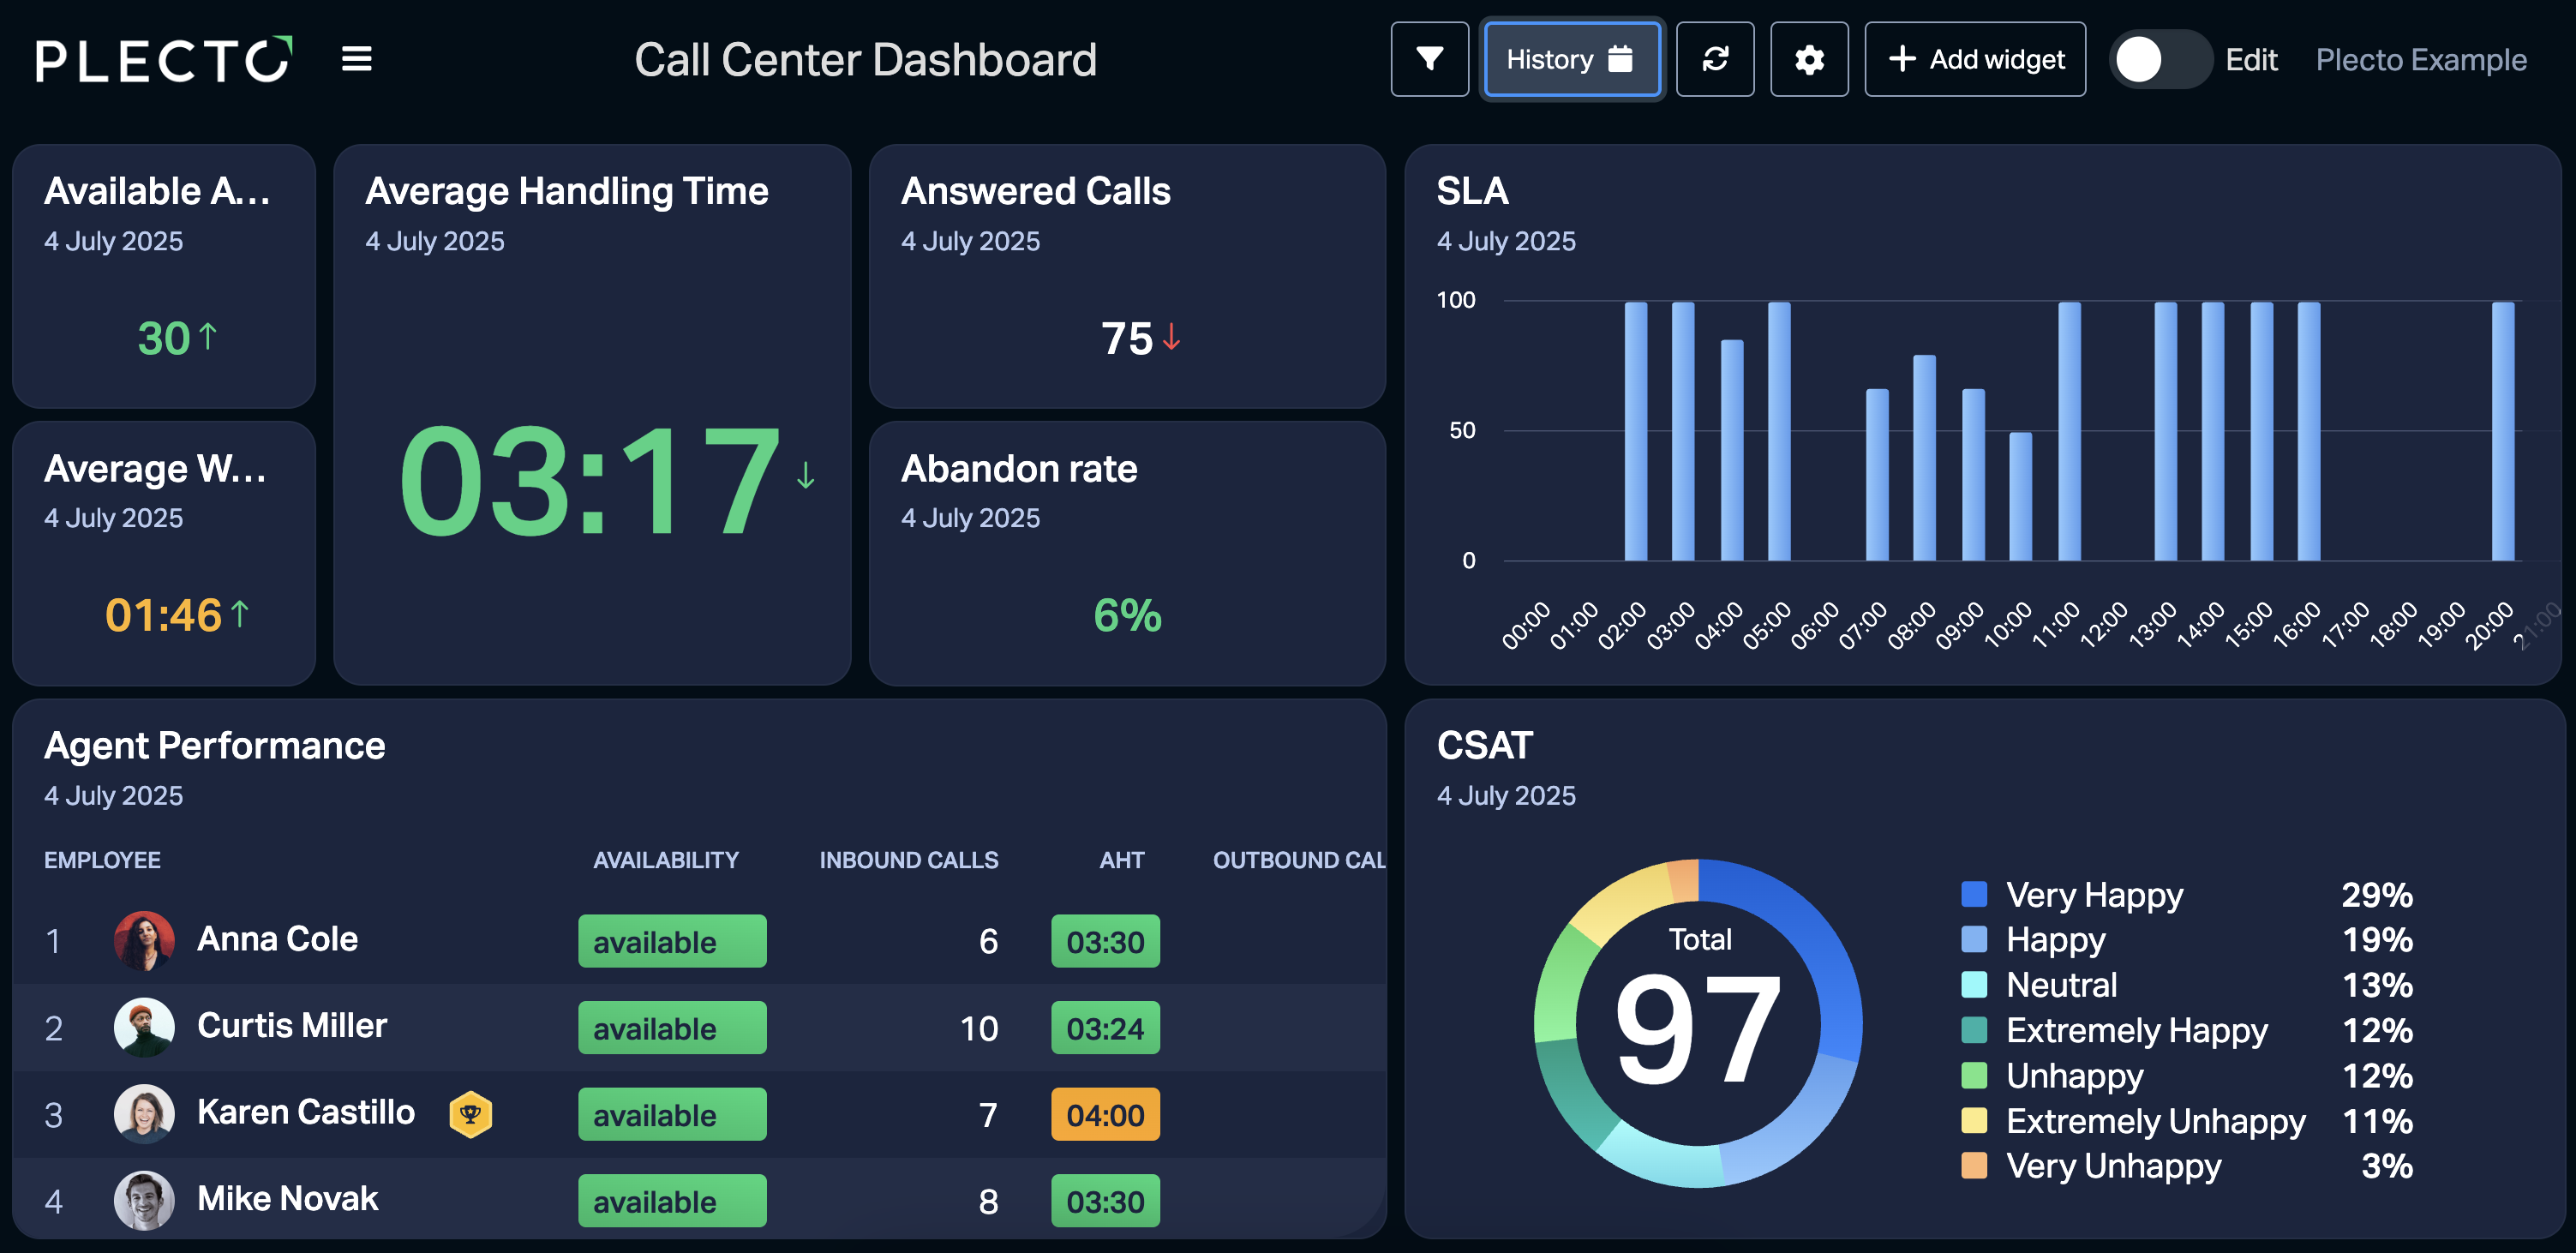
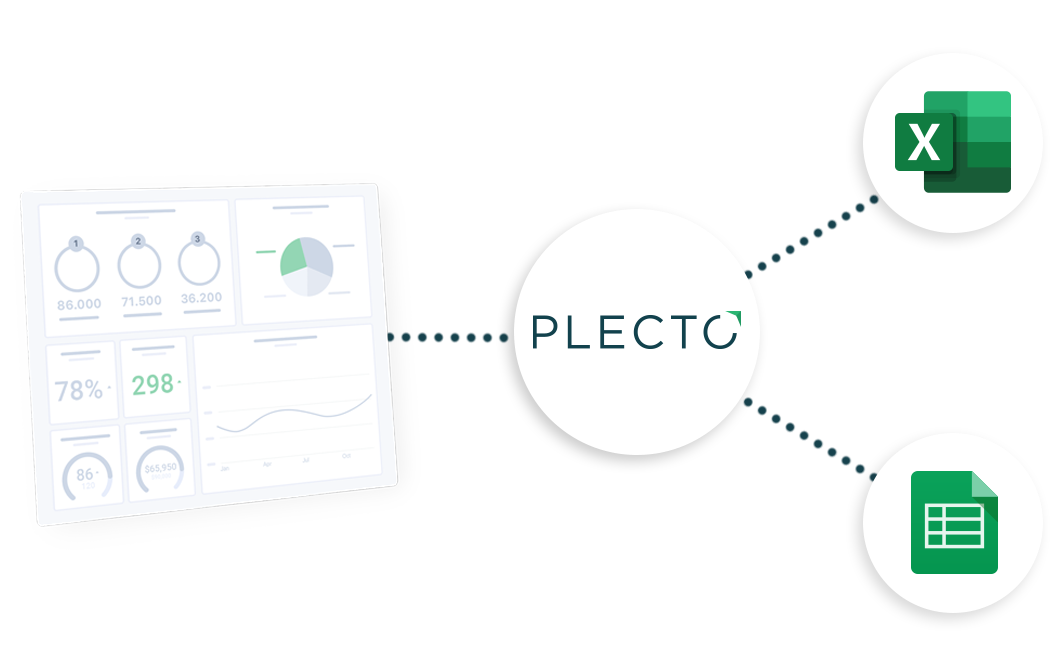
Plecto connects to your Excel and Google Sheets data and keeps it current on its own. Your team sees live KPIs on any screen instead of digging through last week's numbers in a static file.
What is an Excel dashboard?
An Excel dashboard is a visual summary of spreadsheet data that pulls your key metrics into charts and KPI tiles on one screen. You can build a basic version in Excel with pivot tables and charts, but it will remain static: someone refreshes the data and rebuilds the layout by hand. Plecto connects to the same Excel data and turns it into a live dashboard that updates on its own.
Can you build a dashboard in Excel?
Yes, for a one-off report it's fine.
The trouble starts when you need live data. Every update means a fresh export, refreshed pivot tables, and a manual tidy-up. Add a second data source and you're copy-pasting between sheets. Put the dashboard in front of a team, or on a TV in the office, and that upkeep quickly becomes a weekly chore that usually lands on one person.
Meanwhile, Plecto makes this process automatic. Connect your spreadsheet once, and your dashboard will refresh itself by the minute.
How to use Plecto alongside Excel
Bring your data to life
While cells and tables hide your progress, Plecto turns the same Excel numbers into clear, colorful KPI widgets your team can read at a glance.
Make your data more visible
A wallboard keeps targets in front of your team all day. Add contests and achievements, your team will actively chase their numbers.
Reduce time on manual processes
Stop re-exporting and rebuilding by hand. Plecto refreshes your dashboards down to the minute, so your decisions are based on current data.
Dashboard software that updates itself
How does Plecto make your Excel dashboards better?
With a manual dashboard, it's the same every week: export, paste, refresh, tidy, repeat. Plecto runs this for you automatically.
Connect Excel through OneDrive or SharePoint, or sync it with Zapier and Google Drive.
Combine your spreadsheet with data from 150+ other integrations in a single view.
Build KPIs with custom formulas, the same logic you already write in Excel.
Send the result to any screen: desktop, mobile, or an office wallboard.
Keep Excel for recording data, but let Plecto handle the display and updates.
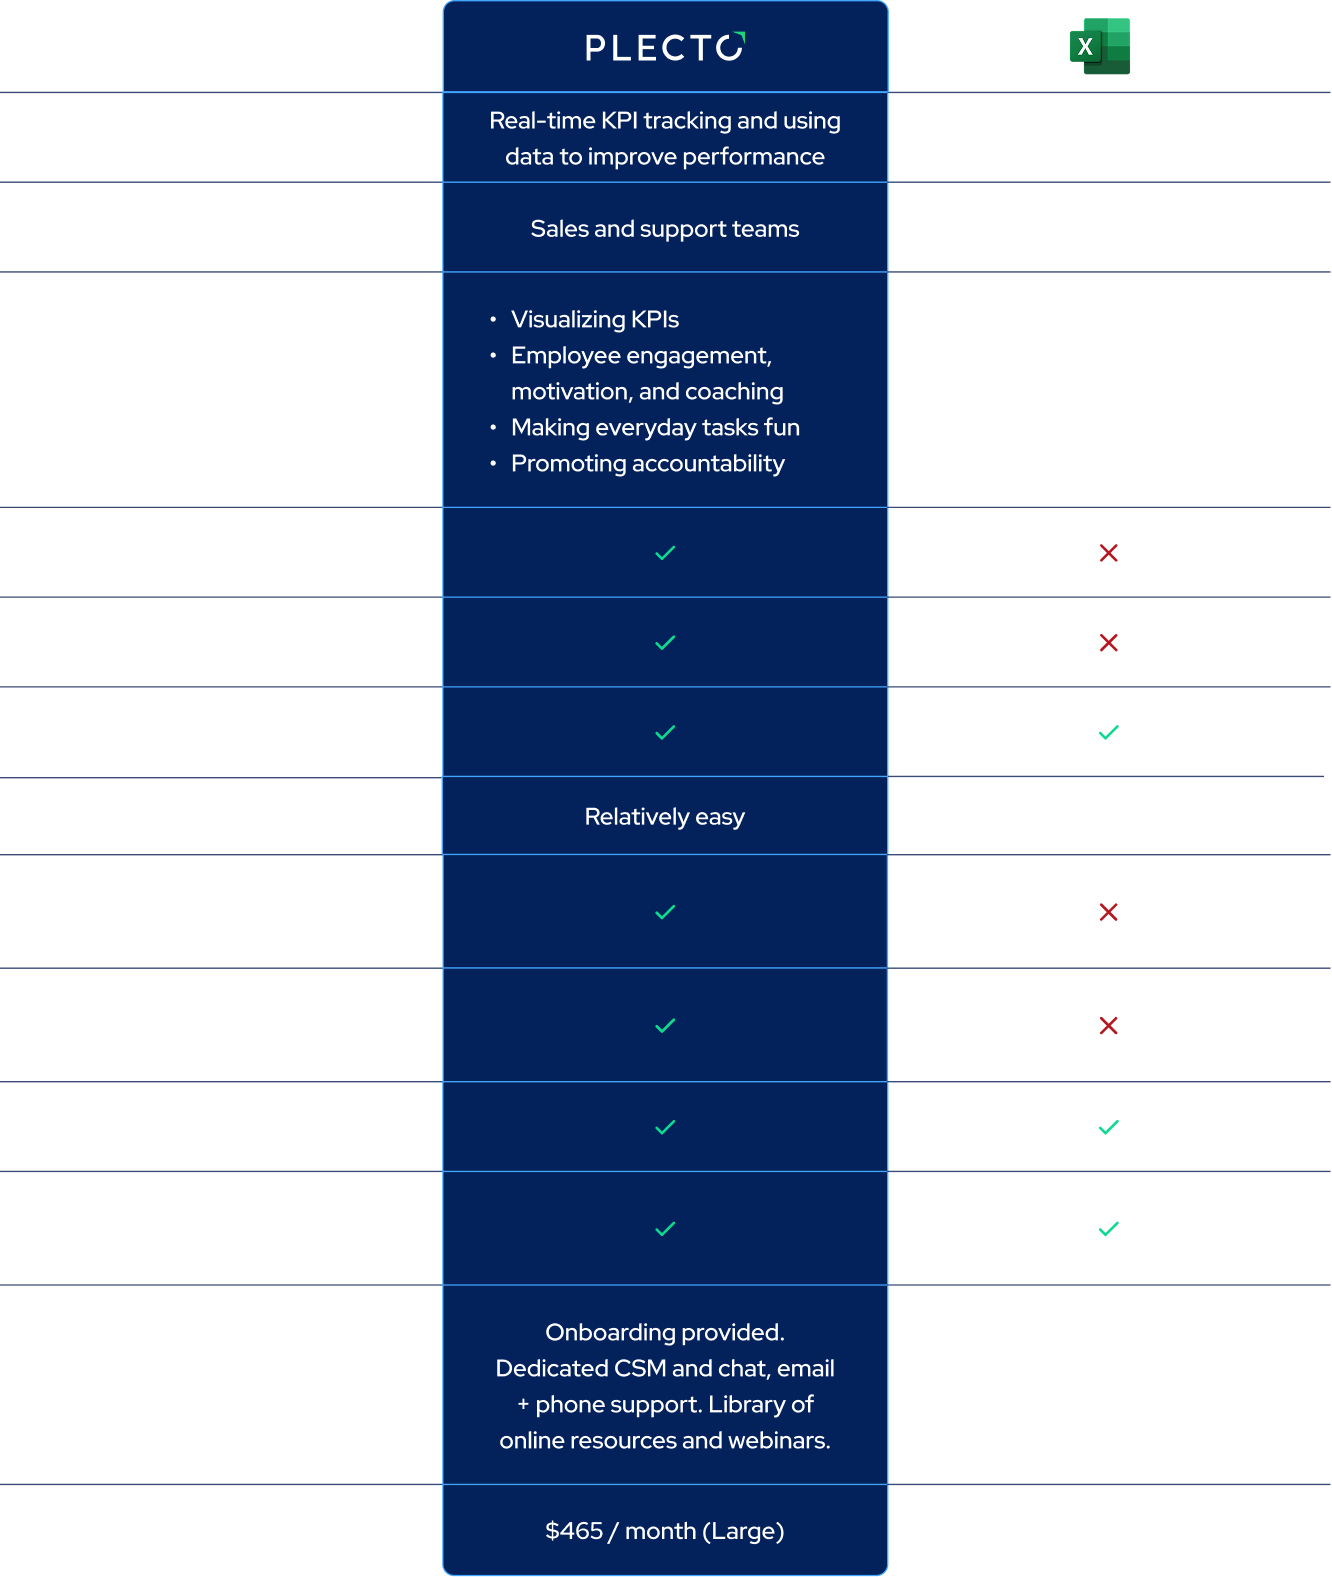
Plecto vs Excel for dashboards
Where a live Plecto dashboard beats a static spreadsheet.
Real-time Excel dashboards
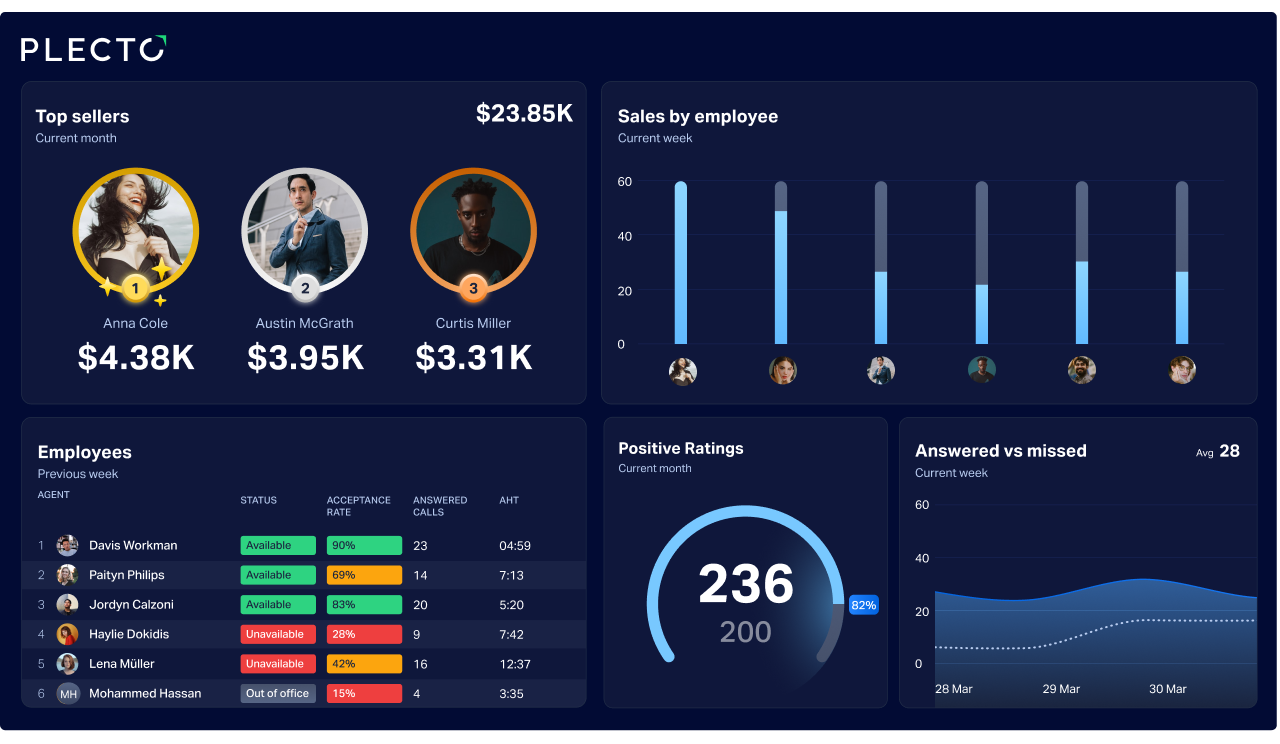
An Excel spreadsheet buried in a folder won't tell your sales team whether they hit target today. Plecto reads your Excel and Google Sheets data and shows it on a live dashboard.
Upload your Excel spreadsheets
Combine Excel data with metrics from web services, SQL databases, or other sources to build custom KPIs. Upload files directly, or sync with Zapier or Google Drive.
Build your Excel dashboard free
Get started in minutes with a free 14-day trial. No credit card required.
Display your Excel dashboards on TVs
Do what a static spreadsheet can't and let everyone see their live numbers. Place your dashboards on office wallboards to start data-driven conversations.

Why combine Plecto and Excel?
Plecto pairs with Excel's analysis and reporting. Here's what you get in addition to your spreadsheet:
- Real-time data updates
- Engaging visualizations
- Deep-dive report analysis
- Broad customization options
- Custom formulas and KPIs
- Excel data combined with 150+ other services
Visualize your Excel data wherever you are
With the Plecto app, your KPIs travel with you. Check your dashboards any time, from a laptop, tablet, phone, or Apple Watch.

How to integrate Plecto with Excel
Setting up your Excel integration
You can integrate your Excel spreadsheets into Plecto with OneDrive and SharePoint.
To set up your integration, first organize your sheets as shown in the image below.

- Continue by locating Microsoft Excel in your data sources.
- Select the drive your spreadsheet is stored in.
- Allow Plecto access to your workbooks. Select a workbook and relevant sheets. Each sheet equals one data source.
- Match the column names from your sheet to configure your data sources. And you're done!
More about the Excel integration
- The default time for updating your Excel spreadsheets in Plecto is every 15 minutes.
- However, you can adjust this time higher or lower as needed, even down to every minute.
- You can also manually update data in Excel. Doing so will create a corresponding change in Plecto.
How to build Excel dashboards
Visualize and share your Excel dashboards on office wallboards or at home, and follow your progress in real time.
1. Connect your Excel spreadsheets
Upload your Excel spreadsheets directly into Plecto, or sync them with OneDrive, SharePoint, or Zapier.
2. Build a dashboard
Start from a prebuilt Plecto dashboard, or write formulas to calculate advanced metrics.
3. Celebrate the numbers
Add notifications, slideshows, and achievements that fire whenever your data changes.
Questions
Excel dashboard FAQs
Not on its own. An Excel dashboard shows the data as of the last manual refresh. To make it update in real time, you can connect the spreadsheet to a tool like Plecto, which re-reads the data as often as every minute and refreshes the dashboard for you.
Connect your Excel or Google Sheets file to Plecto through OneDrive, SharePoint, Zapier, or Google Drive. From then on, Plecto will pull the latest data on a schedule you set, down to one minute, and refreshes every widget—no re-exporting or rebuilding required.
You can build a static dashboard inside Excel at no cost, but it won't update on its own. Plecto's live, automated Excel dashboards come with a free 14-day trial, and no credit card required to start.
Excel organizes, tracks, sorts, and stores datasets on spreadsheets. It isn't built for displaying data. Plecto is a data visualization platform: it integrates with sources like Excel and shows the data on live dashboards, adding gamification elements to keep teams engaged. Most teams use both, with Excel as the source and Plecto as the display.
The default updating time is 15 minutes. You can adjust it higher or lower, even down to one minute.
Yes to both. You can connect as many Excel files and data sources (Salesforce, HubSpot, and 150+ others) as you like to a single dashboard.
Absolutely. Plecto is designed to be as easy to use as possible. We also provide onboarding, a free resource library, and a dedicated Customer Success Manager for every customer, on every plan.
Plecto's pricing is straightforward: we charge by the number of tracked users, not by data sources. Our Medium and Large plans both include 10 user licenses in their base prices. For every extra user, you'll pay an additional fee.
Start building your Excel dashboard today.
No credit card required.