 Sign in
Track your Zendesk KPIs in real time with Plecto
Ditch slow reports. Connect Plecto with Zendesk Support for a streaming integration that updates your CS dashboards every 10 seconds.
 Zendesk Support
CATEGORY
SupportPARTNER WEBSITE
www.zendesk.com/supportADDITIONAL HELP
Plecto Documentation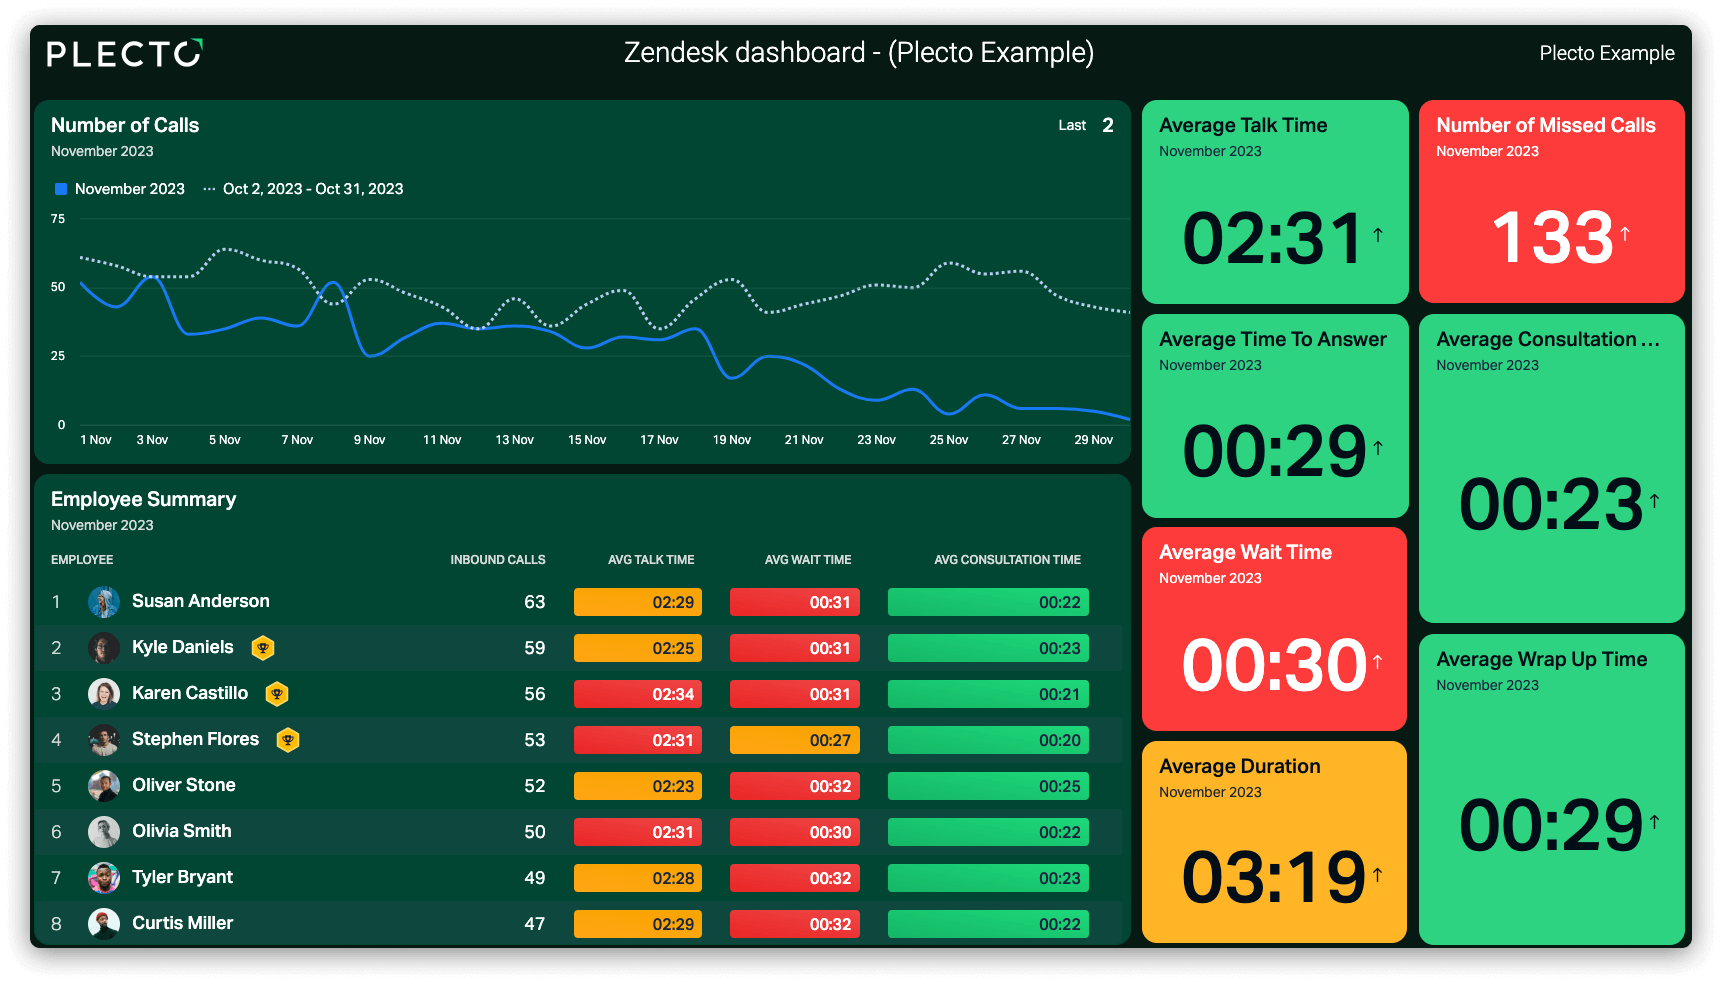
Provide the best-ever customer service with Zendesk streaming
Don't wait on the slow refresh times of Zendesk reports!
Our streaming integration with Zendesk support gives you a faster-than-ever insight into agents' support performance. Plecto's streaming metrics refresh every 10 seconds, allowing all agents to stay in the loop regarding key metrics.
Real-time Zendesk dashboards with Plecto
Get a holistic view of your support operations
Visualize key metrics across all support channels, including ticket status, customer satisfaction (CSAT), call handling, and overall support performance.
Can I visualize calls?
Yes! You are absolutely able to visualize calls from Zendesk. Plecto data updates in real time, allowing your team to be as fast and effective as possible on the phone. KPIs can be visualized for each employee or your whole team.
Customized KPI builder
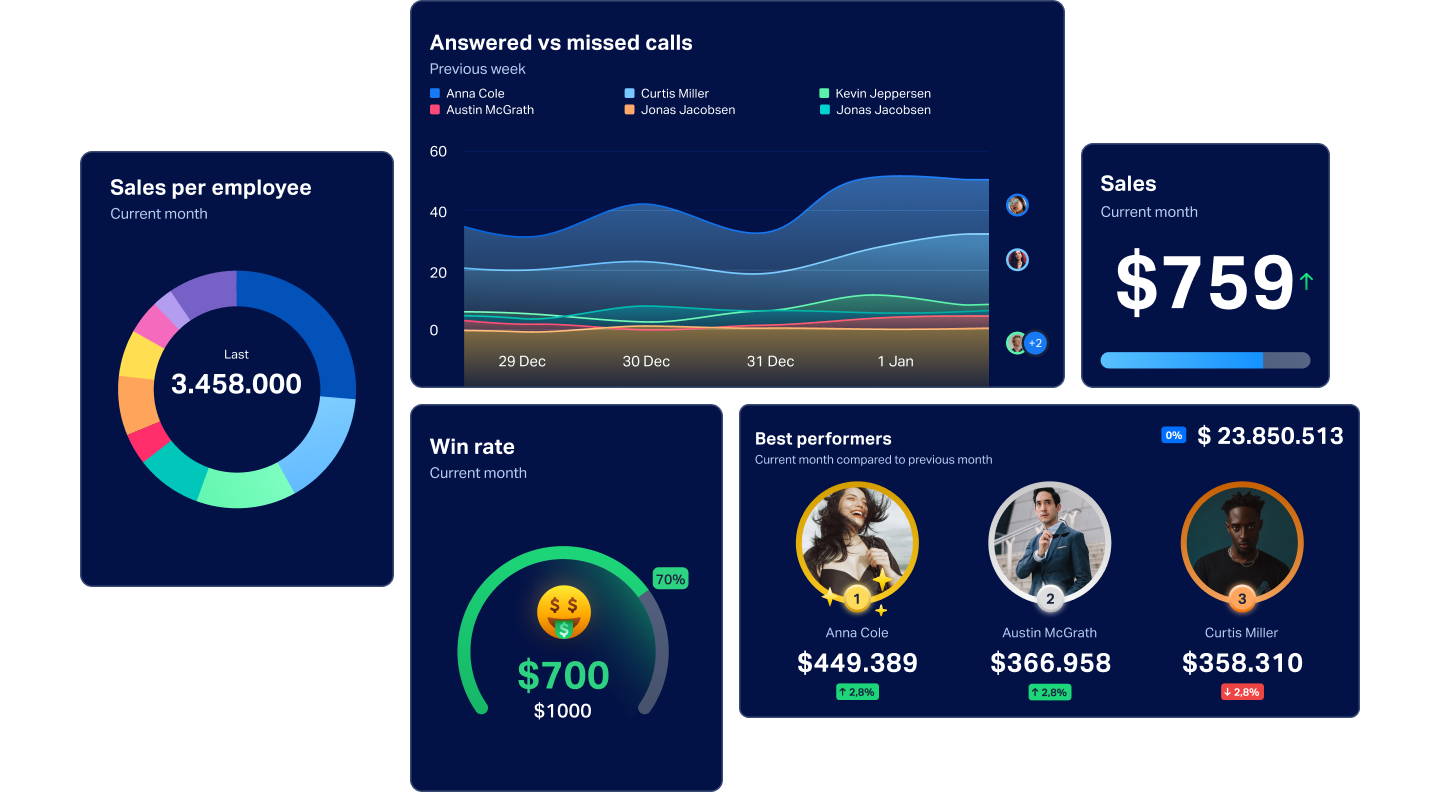
Go beyond standard reporting. Create custom KPIs by combining Zendesk data with metrics from other systems to fit your unique business needs.
Zendesk wallboard
How to build a live Zendesk wallboard
A Zendesk wallboard is a live support dashboard on a TV that shows ticket volume, ticket status, customer satisfaction and agent activity at a glance. You can build one in Plecto by connecting Zendesk Support as a data source, turning tickets and satisfaction ratings into KPIs, and showing the dashboard on any office TV through a slideshow. Tickets and ratings are imported every 2 minutes, and Zendesk streaming metrics such as live agent status refresh every 10 seconds.
- Connect Zendesk Support. In Plecto, go to Data sources > New data source > Zendesk Support, enter your Zendesk subdomain (for example mycompany.zendesk.com) and click Next.
- Import your support data. Select the Zendesk data types you need: Tickets, Satisfaction Ratings, Events and Calls. Tickets and ratings are matched to the assigned agent, so every agent gets their own numbers. Choose how much history to import and click Import.
- Create the KPIs. Go to Formulas > New formula and build the numbers your team watches, for example Tickets created today, Open tickets, Tickets solved today, CSAT from Zendesk Satisfaction Ratings, or Average wait time from Zendesk Calls. The 10 KPIs for customer service guide has formulas to copy, including first response time and handle time.
- Build the dashboard. Add the KPIs to widgets on a customer service dashboard: number widgets for open and solved tickets, a speedometer for CSAT, a column chart grouped by status or priority, and a leaderboard widget for top agents. For live agent status, open the Zendesk Support data source settings, select Live Employee Status under Dimensions, then switch on Show employee status in a table widget.
- Show it on a TV. Go to Slideshows > New slideshow, add the dashboard as a slide and save. Then open tv.plecto.com on the TV. The TV shows a four-digit code: in Plecto, go to Slideshows, click Actions > Activate and enter that code.
The same slideshow can rotate your ticket dashboard with a CSAT dashboard or, on the Large and Enterprise plans, a support team contest. If calls reach agents through a separate phone system, put them on the same screen: see contact center dashboards and the TV dashboards guide.
See how Plecto compares with Zendesk Support's built-in analytics
Unsure what the difference is between Plecto and Zendesk Support's own dashboards? Learn how Plecto can give you faster performance insights into your customer operations in our one-pager.
Zendesk + Plecto
Zendesk wallboard and TV dashboard FAQ
Yes. Build the dashboard in Plecto, add it to a slideshow and pair the TV once at tv.plecto.com with a four-digit code; after that, the screen updates by itself as Zendesk data arrives. Plecto has TV apps for LG, Samsung and Android TVs, and other smart TVs can use the browser. The TV dashboards guide covers screens and setup.
Zendesk tickets, ticket events, satisfaction ratings and calls are imported every 2 minutes. Zendesk Support also supports streaming metrics, such as live agent status, which refresh every 10 seconds on streaming widgets. If Zendesk's API rate limit is reached, imports pause and resume automatically once Zendesk allows more requests.
Any KPI built from Zendesk tickets, satisfaction ratings, events or calls: tickets created, open tickets by status or priority, tickets solved today, CSAT, call wait time and handle time, and a leaderboard of top agents. Live agent status comes from streaming. The 10 KPIs for customer service guide has formulas to copy, and the CSAT and ticket backlog pages explain the metrics.
Yes. Every Plecto plan includes unlimited data sources, so Zendesk tickets can sit next to calls from a phone system such as Aircall, Talkdesk, RingCentral or Dialpad, or next to chats from Zendesk Chat. Each system keeps its own refresh rate. See contact center dashboards for examples.
Zendesk Explore is Zendesk's built-in reporting and analytics for Zendesk data. Plecto is a separate platform built for live team screens: it shows support KPIs on office TVs in real time, combines Zendesk with phone, CRM and other systems, and adds gamification, with contests and the Reward Store on the Large and Enterprise plans. Explore is still the place for deep, ad hoc analysis inside Zendesk. If you are comparing TV dashboard tools, see Plecto vs Geckoboard.
You need a license for each agent you track, meaning every employee whose tickets or calls are sent to Plecto from a data source. People who only view dashboards, and are not tracked in any data source, can view them free of charge, and showing dashboards on TVs costs nothing extra. See pricing for the 10-license minimum and plan details.
Related integrations
Sign Up