 Sign in

KPI library
KPI examplesfor every team, with formulas
Browse 80+ KPI examples across sales, support, call center, marketing, finance, e-commerce and project teams. Each one has a definition and a formula, so you can pick the numbers your team should track.
88 KPIs

Finance
Accounts Receivable and Accounts Payable
Finance KPIs that track credit purchases not yet paid for both a company and its customers alike.

Marketing
Ad Spend per New Deal
Learn how much you are spending per new deal and discover ways to reduce it!

Marketing
Ad Spend per New Order
Show the cost of advertising that it takes for a company to get a new order with the metric.

Marketing
Ad Spend per Won Deal
Get an overview of the cost of advertising that takes the company to get a new customer with this marketing KPI.

Marketing
Ads Click-through Rate
Visualize in percentage the amount of people seeing your ad that actually click on it.

Support
Agent Touches per Ticket / Replies per Resolution
Customer Support KPI describing the average number of times an agent interacts with a customer ticket before resolution.

Finance
Annual Recurring Revenue (ARR)
Calculate and visualize the expected yearly revenue based on your current subscriptions. It’s the annualized version of the MRR.
- Telephony
Telephony
Answered Calls Rate
Get an overview of the percentage of calls that have been answered compared to the total amount of received calls over the last period.
- Project Management
Project Management
Average Billable Rate
Visualize in real-time the amount of money a company is paying to hire your consultants

Telephony
Average Call Duration
Get an overview of the average time spent by your entire team in their calls with clients in real-time with this metric.

Sales
Average Deal Size
Sales KPI describing the average amount of money your company receives per customer deal.
Support
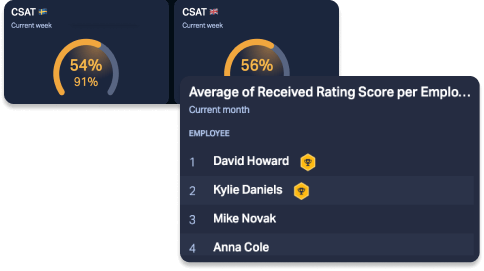
Average of Received Rating Score
Get an overview of average rating score clients are giving to your company in the last period in real-time with this metric.

Support
Average Reply Time
Customer Support KPI describing the average time it takes for an agent to respond to a customer query.

Support
Average Resolution Time (ART)
Customer Support KPI describing the average length of time it takes for customer support to resolve customer issues.

Sales
Average Revenue per Account (ARPA)
Sales KPI describing the revenue generated by each account within a period.

Sales
Average Revenue per User
Sales KPI describing the average amount of revenue generated from each customer.

Sales
Average Sales Cycle Length
Sales KPI describing the average length of time it takes your company to close deals with clients.

Finance
Burn Rate
Finance KPI measuring the rate at which a new or unprofitable company is consuming its cash reserves.

Telephony
Call Abandonment Rate
Customer Support KPI measuring the percentage of calls abandoned by customers before they're reached by an agent.

Webshops
Cart Abandonment Rate
Cart Abandonment Rate describes the percentage of customers who add items to an online shopping cart, but then abandon it before purchasing anything.
- Finance
Finance
Churn MRR
Churn MRR shows you the amount of money that you are losing per month due to these cancellations.

Support
Conversations per Teammate
Customer Support KPI measuring the number of interactions your support staff has had with customers.

Marketing
Conversion Rate of Sessions to Orders
This KPI compares the number of people that visit your website with the ones that buy or subscribe to a product in it.

Marketing
Cost per Impression
Cost per impression (CPM) is what you pay for every 1,000 times your ad is shown. See the formula, how it differs from CPC and how to track it live.

Marketing
Cost per Lead (CPL)
Marketing KPI that describes the ad expenses required to obtain a new lead.

Support
Cost per Resolution
Customer Support KPI describing the average cost of resolving a ticket.

Finance
Current Accounts Payable
Finance KPI describing a company's short-term debt obligations.

Sales
Customer Acquisition Cost
Sales KPI describing the cost needed to acquire a customer within a given period.

Support
Customer Effort Score (CES)
Customer Support KPI measuring how efficiently your customers use your product, obtain needed information, and interact with your company personnel.

Support
Customer Satisfaction (CSAT)
Customer Support KPI measuring how satisfied your customers are with your product or service.

Telephony
Duration of All Calls
See the time spent talking on the phone with potential or current customers per day in real-time with this metric.

Telephony
Duration of Answered Calls
Visualize the time spent by your agent in the last call with a client in real-time with this metric.

Support
Escalation Rate
Customer Support KPI describing the percentage of support tickets that have risen to the next support level.

Support
First Response Time
Customer Support KPI describing the average time it takes to first respond to a customer query.

Finance
Gross Profit Margin
Finance KPI describing a company’s profit after its cost of goods sold is accounted for.

Webshops
Inventory Turnover
Finance KPI measuring the number of times a business replaces its stock in a given period.

Webshops
Latest Customer Name
Not every KPIs need a calculation. Latest Customer Name KPI is simply the name of the client that most recently gave its information.

Support
Latest Received Rating Comment
Visualize in real-time the last comment fra a person who posted an online review of your product with this metric.

Sales
Lead Response Time
Sales KPI that describes the time it takes your sales team to follow up with a lead.
- Finance
Finance
Monthly Recurring Revenue (MRR)
Visualize in real-time the revenue you get on a monthly basis per new customer that your company gets with this KPI.

Support
Net Promoter Score (NPS)
Customer Support KPI measuring how likely your customers are to recommend your product or service to others.
Sales
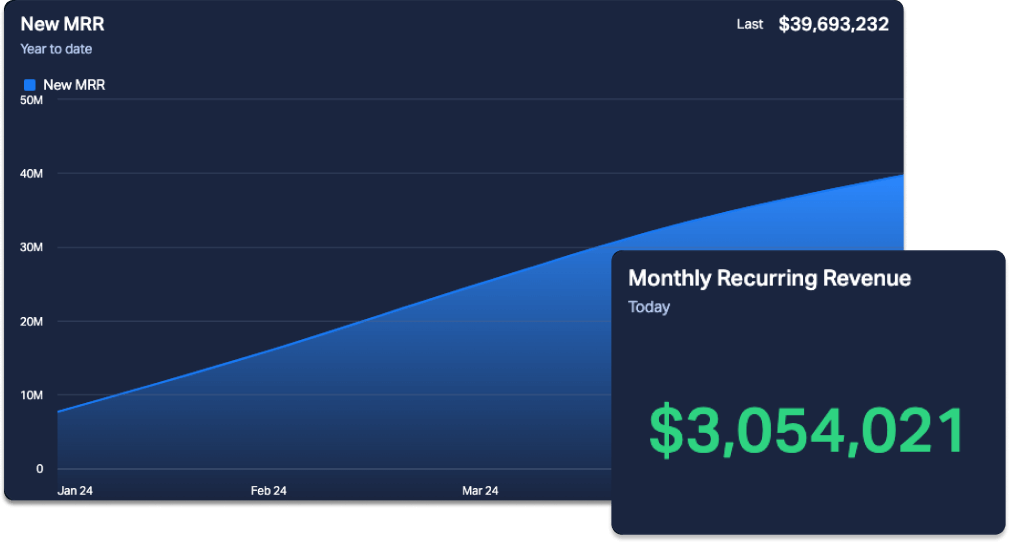
New MRR
Let your sales team see new subscriptions that have been added recently and that will, therefore, contribute to your MRR in real-time with this sales KPI.
- Finance
Finance
Number of Active Subscriptions
Visualize the number of users that have converted into paying subscribers. With the number of active subscriptions, you can get an MRR estimation.

Marketing
Number of Ad Clicks
See the number of times one of your shown ads has received a click from your audience in real-time with this KPI.

Marketing
Number of Ad Conversions
Get an overview of the number of people that carry out a certain action after seeing your ad in real-time with the metric.

Marketing
Number of Ad Impressions
Visualize the number of ad impressions your ads get in real-time with this metric. This KPI shows you the times your ad is seen by an audience.

Telephony
Number of Booked Meetings
Get an overview of the number of pending meetings you have in a certain period of time with this metric.
- Development
Development
Number of Completed Issues
Number of Completed Issues KPI will track your development team’s performance in regards to completed tickets, to get an overview of their done tasks.

Sales
Number of Emails Sent
Let your sales team see the number of emails that each employee has received in the last period in real-time with this sales KPI.

Sales
Number of Leads Created
See the potential future customers that have shown some interest in your company or product in the last period in real time with this metric.

Sales
Number of Lost Deals
Count of the number of opportunities that haven’t turned into clients in real-time with this metric and Plecto.

Telephony
Number of Meetings Completed
See the total number of meetings a team or employee has already had in the last period measured in real-time with this metric.

Telephony
Number of Missed Calls
Get an overview of the total number of calls that your agents haven’t answered in the last period in real-time with this metric.

Project Management
Number of New Balance Transactions
Keep track of the transactions that your company has done in the last billing period with Number of New Balance Transactions KPI.

Finance
Number of New Charges
Give your employees a real-time overview of the company's finances by showing them the number of new charges that your company has received
- Webshops
Webshops
Number of New Customers
Get in real-time the lastest number of new customers based on a daily, weekly, or even monthly basis.

Finance
Number of New Disputes
Provide your employees with insights by visualizing the amount of times a customer has questioned a charge from your company with their card issuer.
- Development
Development
Number of New Issues
The Number of New Issues KPI will keep track of the new tickets that developers received in a specific period of time.

Project Management
Number of New Tasks
This KPI is often used by the development department because they usually have many small tasks to do that require immediate attention.

Support
Number of Received Ratings
Visualize in real-time the amount of user that has written a review about your company online with this metric.

Marketing
Number of Visitor Pageviews
See in real time the number of visitors pageviews on a dashboard for a specific period of time.

Marketing
Number of Visitor Sessions
Visualize the number of group of interactions an individual visitor has with the different content on your website in real-time with this metric.

Marketing
Number of Visitor Users
This KPI gives you a real-time overview of how many visitors have looked at your website in the last period.

Telephony
Number of Waiting Calls
Visualize in real-time the amount of calls that need to be answered as soon as possible with this metric.

Sales
Number of Won Deals
Let your sales team count the number of opportunities that have turned into clients in real-time with this sales KPI.
- Support
Support
Oldest Unanswered Ticket
Don't let your costumers wait. Help your support team with visualizing how long a client has been waiting for respond

Finance
Operating Cash Flow (OCF)
Finance KPI measuring the net amount of cash a business earns from typical operations.

Support
Percentage of Closed Support Tickets Rated
Show the number of times that you have been rated by customers after solving their support tickets in real-time with this metric.

Finance
Rate of Return (RoR)
Finance KPI describing the percentage of net gain or loss on an investment over a period.

Webshops
Repeat Purchase Rate
Finance KPI describing the percentage of customers who make more than one purchase.

Marketing
Return on Ad Spend
The "holy grail" of marketing and eCommerce KPIs. This KPI shows the profitability of each channel used for paid advertising.

Sales
Revenue Growth Rate
Sales KPI describing a company’s increase in revenue over a specific time period.

Sales
Sales Conversion Rate
Sales KPI describing how effectively you convert leads to sales.

Sales
Sales Win Rate
Measure how effective your sales reps are by tracking your Win Rate on real-time dashboards.

Project Management
Sum of Reported Hours
Calculate the number of hours one of your consultants has been hired for by a third company with this Sum of Reported Hours KPI.

Support
Ticket Backlog
Customer Support KPI measuring the unresolved number of customer tickets in a period.

Webshops
Time Between Purchases
Finance, sales and marketing KPI describing the average number of days between a customer’s purchases.
- Marketing
Marketing
Total Ad Spend
Get real-time updates on the amount that has been spent on ads in the last period with this metric.

Finance
Value of Charged Fees
Give your employees the best real-time insights by easily visualizing the total amount of fees that your company has charged in the last period.
- Finance
Finance
Value of Invoices
Visualize the amount of money that the company is spending on paying its various invoices with the metric.

Project Management
Value of New Balance Transactions
Keep an eye on the total amount that your company has spent on transactions over the last period with Value of New Balance KPI.

Finance
Value of New Charges
Give your employees a full overview of the company's finance by showing them the monetary value that your company is receiving

Finance
Value of New Orders + Average Order Value
KPIs measuring the value of new orders, and the values of orders in a given period.

Finance
Value of New Payment Intents
Give your employees the best insight into the finances by visualizing the value of the payments from customers your company has collected.

Project Management
Value of New Refunds
Visualize in real-time the amount of money that you are refunding to unsatisfied clients, and improve it!

Finance
Value of Refunded Charges
Provide your employees with insights by visualizing the total amount of money that your company has given back to customers for an illegitimate charge

Finance
Working Capital
Finance KPI that measures the difference between a company’s current assets and current liabilities.

Telephony
Wrap-up Time
Customer Support KPI measuring the time customer support staff spend on call-related tasks after ending a call.
What are KPI examples?
KPI examples are specific, measurable numbers that show how well a team or company is doing against a goal, such as sales win rate, first response time or monthly recurring revenue. A good KPI has a formula, an owner, a target and a time frame, so everyone knows what "on track" means.
A KPI is not the same as a metric. A metric is any number you can count, like website visits or calls made. A KPI is the few metrics tied to a goal: if the goal is revenue growth, "number of leads created" and "sales win rate" are KPIs, while "emails opened" is usually just a metric. For the theory behind the difference, read our KPI key performance indicator example post and the KPIs and key performance indicators guide.
Use this page as a menu, not a checklist. Scroll to your department, pick 3 to 7 indicators, and pair a leading one (activity you can still change, like calls made) with a lagging one (the result, like revenue). Every name in the tables links to a library page with the full definition, and the grid above lists all of them.
Sales KPI examples
Sales leaders and reps own these. They answer three questions: are we creating enough pipeline, are we converting it, and is each deal worth the effort?
| KPI | What it measures | How to calculate it |
|---|---|---|
| Sales win rate | Share of opportunities that end in a won deal | Won deals ÷ (won deals + lost deals) × 100 |
| Sales conversion rate | How well leads turn into customers | Leads that became customers ÷ total leads × 100 |
| Number of leads created | Pipeline coming in during the period | Count of new leads created in the period |
| Lead response time | How fast a rep first contacts a new lead | Time of first contact − time lead was created, averaged |
| Average deal size | Typical value of a won deal | Total value of won deals ÷ number of won deals |
| Average sales cycle length | Days from first contact to a closed deal | Sum of days to close for won deals ÷ number of won deals |
| Customer acquisition cost | What it costs to win one new customer | Sales and marketing spend ÷ new customers won |
| Revenue growth rate | How fast revenue is growing | (Revenue this period − revenue last period) ÷ revenue last period × 100 |
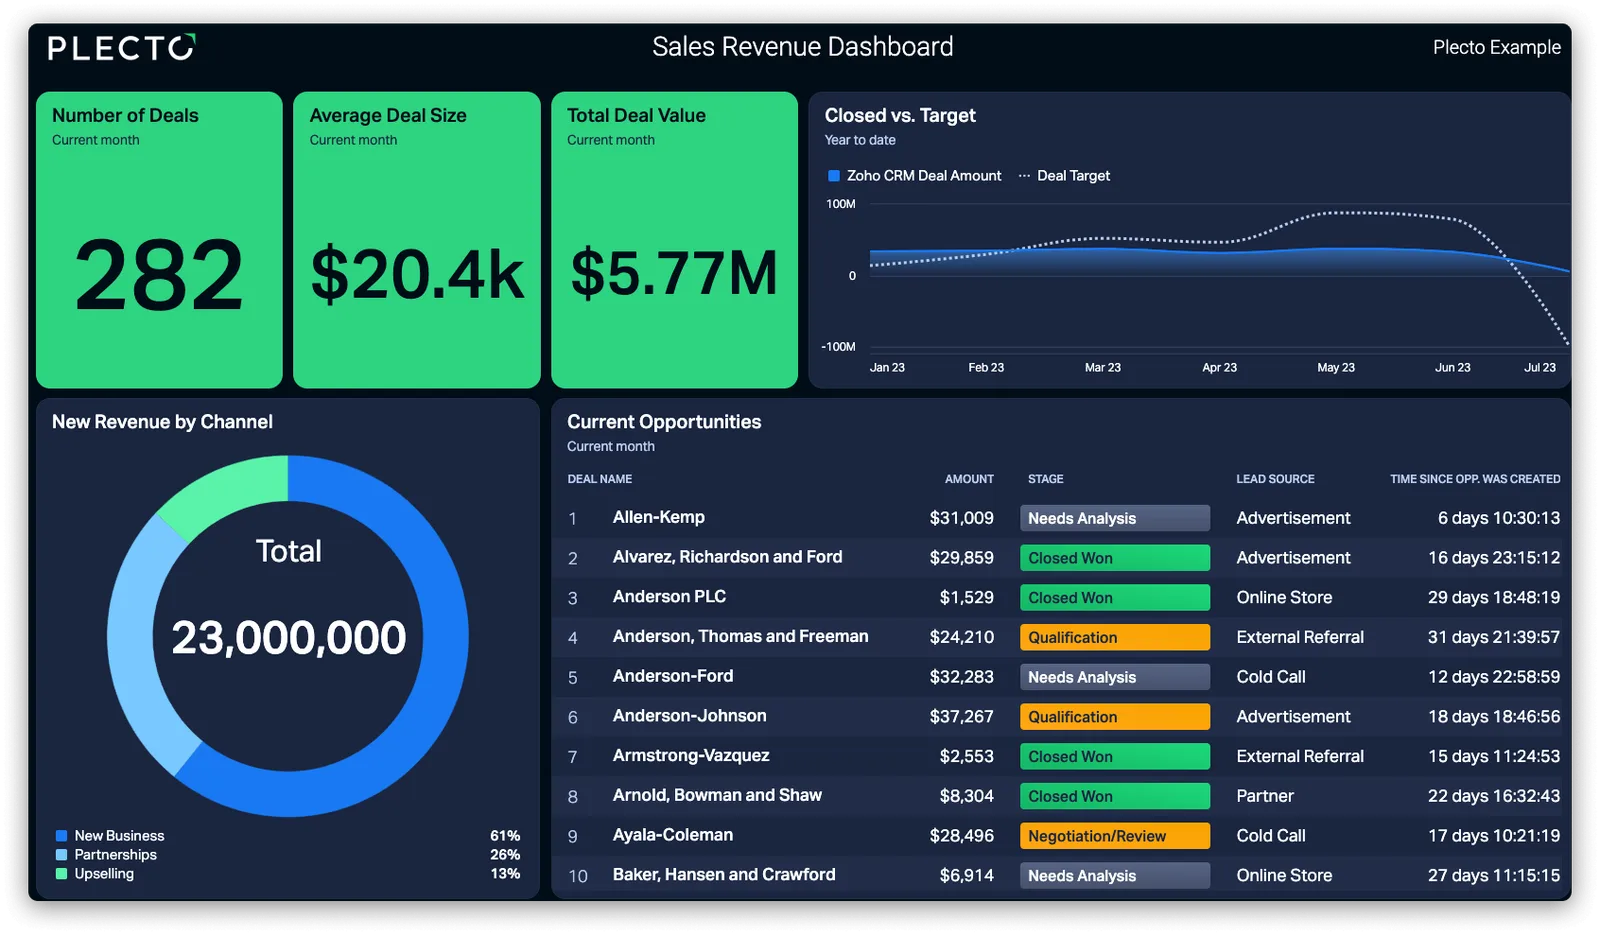
For a longer list with benchmarks and tips, see our 21 sales KPIs for sales teams, or browse live sales dashboard examples.
Customer service KPI examples
Support managers and team leads own these. They show how fast customers get help, whether the help worked, and whether the queue is under control.
| KPI | What it measures | How to calculate it |
|---|---|---|
| First response time | How long a customer waits for the first reply | Sum of (first agent reply − ticket created) ÷ tickets |
| Average resolution time | How long a ticket takes from opening to solved | Total time to resolve tickets ÷ tickets resolved |
| Customer satisfaction (CSAT) | How happy customers are after an interaction | Satisfied responses (4 or 5 out of 5) ÷ total responses × 100 |
| Net promoter score (NPS) | How likely customers are to recommend you | % promoters (9 to 10) − % detractors (0 to 6) |
| Customer effort score (CES) | How easy it was for the customer to get an issue solved | Sum of effort ratings ÷ number of responses |
| Ticket backlog | Open tickets waiting for an answer or solution | Count of tickets still open at the end of the period |
| Escalation rate | Share of tickets passed to a higher tier | Escalated tickets ÷ total tickets × 100 |
| Cost per resolution | What it costs to solve one ticket | Total support cost ÷ tickets resolved |
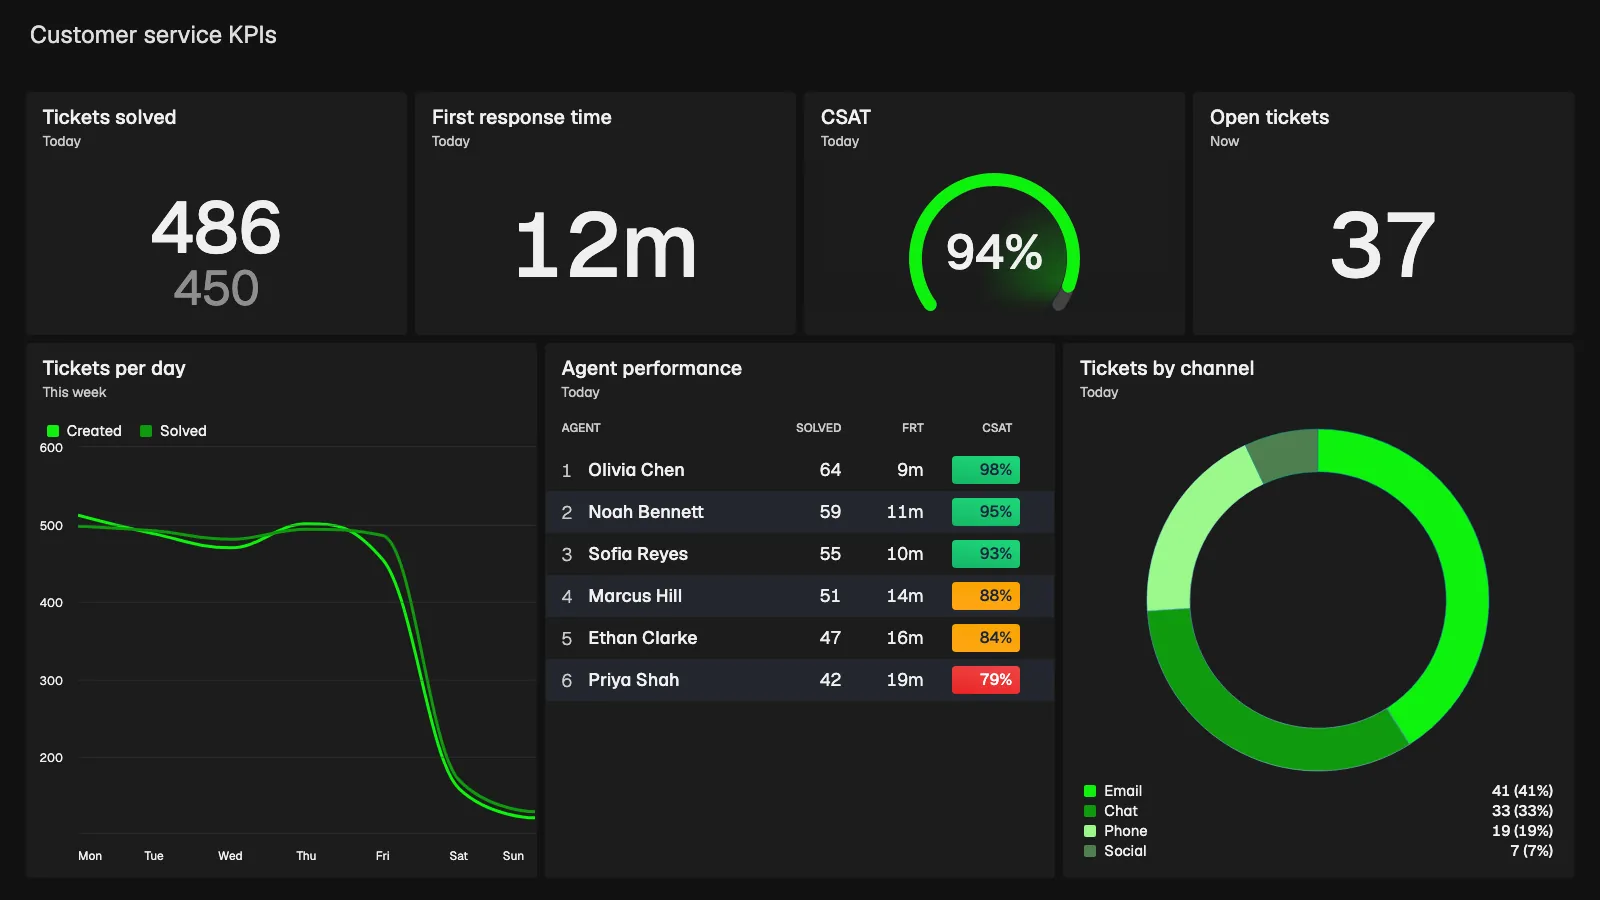
Want more? The big list of customer service KPIs covers dozens of them, and our customer service dashboard page shows how teams display them.
Call center KPI examples
Call center managers and team leads use these to staff the phones and coach agents. They balance speed (how fast calls are answered) with quality (how well they go).
| KPI | What it measures | How to calculate it |
|---|---|---|
| Answered calls rate | Share of incoming calls that an agent picks up | Answered calls ÷ total received calls × 100 |
| Call abandonment rate | Callers who hang up before reaching an agent | Abandoned calls ÷ total received calls × 100 |
| Number of missed calls | Calls no agent answered | Count of unanswered calls in the period |
| Number of waiting calls | Callers in the queue right now | Live count of calls waiting for an agent |
| Average call duration | Typical time an agent spends on a call | Total talk time ÷ number of calls |
| Wrap-up time | Time an agent spends on notes after a call ends | Total after-call work time ÷ number of calls |
| Service level | Share of calls answered within a target time | Calls answered within target (for example 20 seconds) ÷ calls offered × 100 |
| First call resolution | Issues solved without a second call | Issues solved on first contact ÷ total issues × 100 |
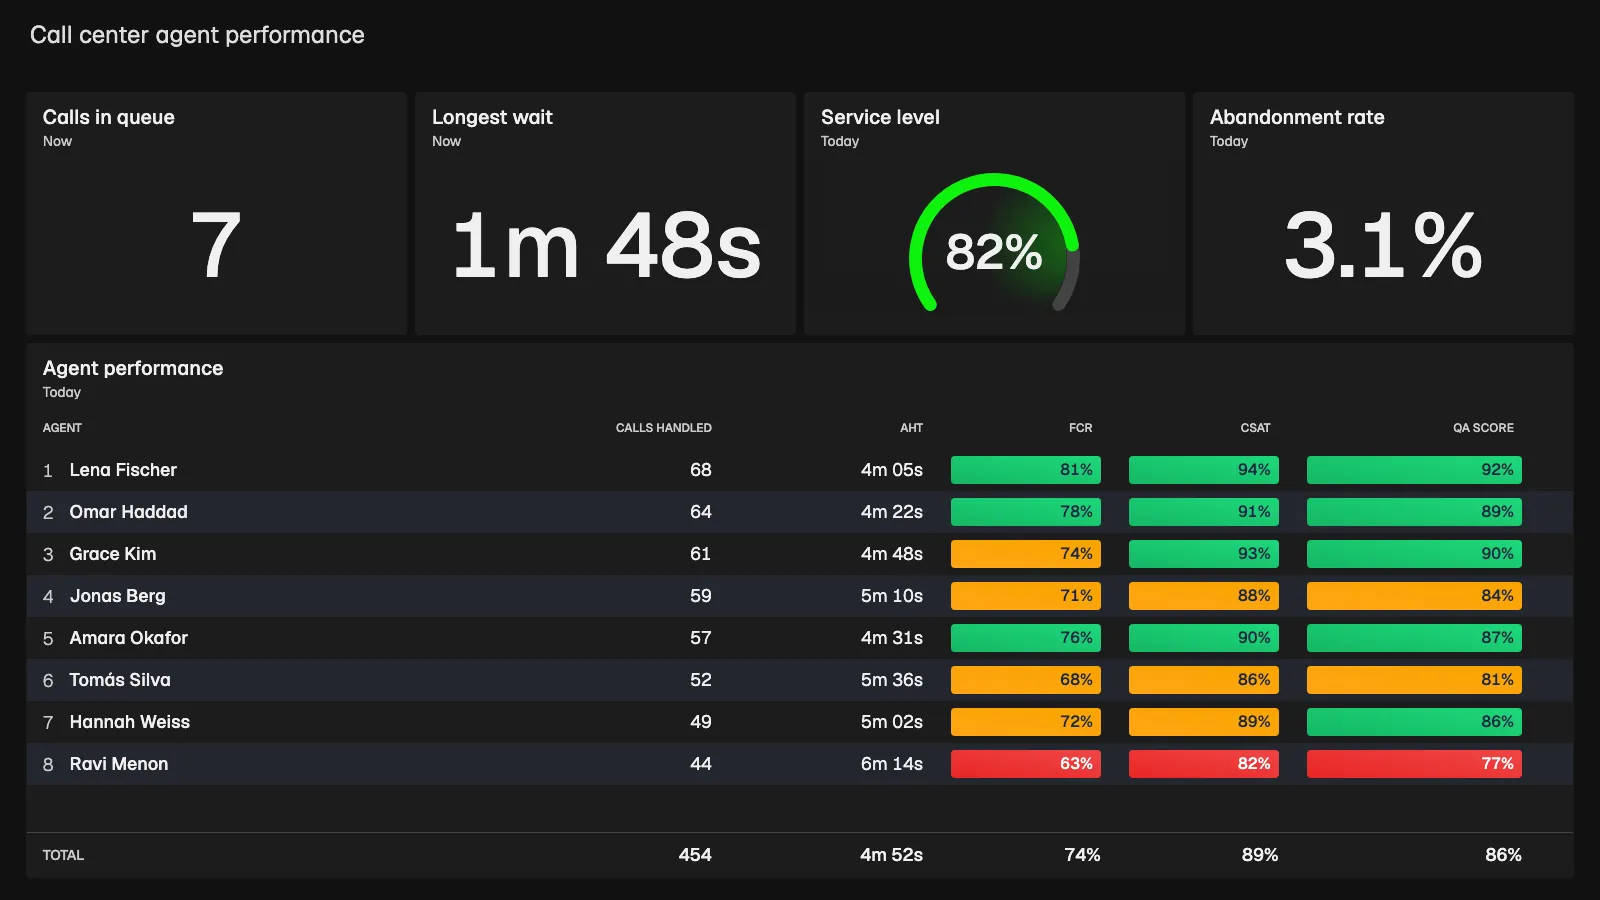
Outbound teams can start with the telemarketing KPIs, and the contact center dashboards page shows full layouts.
Marketing KPI examples
Marketing teams own these. They link spend to attention, attention to leads, and leads to revenue, so you can see which channels are worth the budget.
| KPI | What it measures | How to calculate it |
|---|---|---|
| Cost per lead (CPL) | What each new lead costs to generate | Marketing spend ÷ number of leads generated |
| Return on ad spend (ROAS) | Revenue earned for each unit spent on ads | Revenue from a channel ÷ ad spend on that channel |
| Ads click-through rate | Share of people who see an ad and click it | Ad clicks ÷ ad impressions × 100 |
| Cost per impression | What each ad view costs | Ad spend ÷ number of ad impressions |
| Number of ad conversions | People who take the action an ad aims for | Count of conversions attributed to ads |
| Ad spend per won deal | Ad cost behind each new customer | Total ad spend ÷ number of won deals |
| Number of visitor sessions | Visits to your website in the period | Count of website sessions in the period |
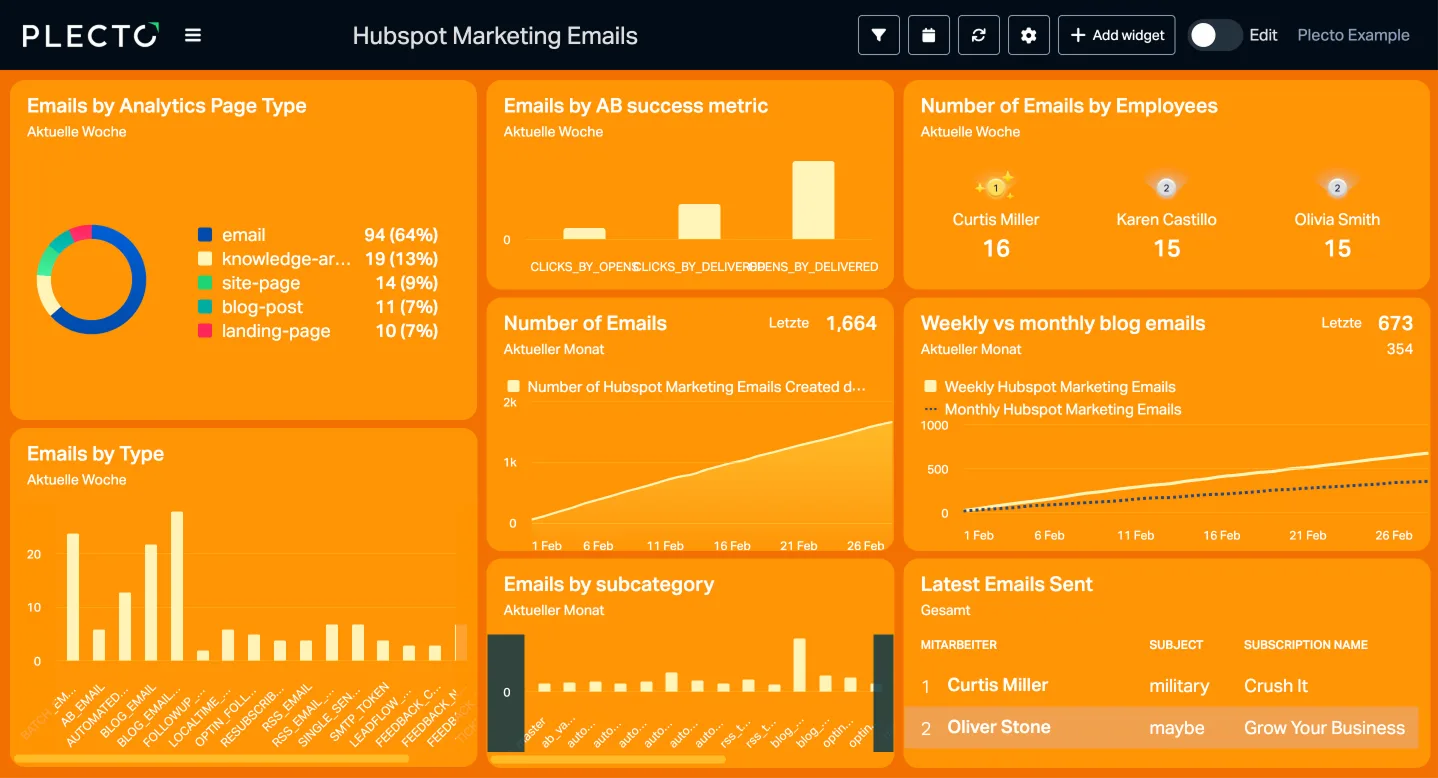
The marketing KPIs post goes deeper on choosing indicators by channel.
Finance KPI examples
Finance leads and executives own these. They show whether the business is profitable, liquid and able to pay its bills.
| KPI | What it measures | How to calculate it |
|---|---|---|
| Gross profit margin | Share of revenue left after direct costs | (Revenue − cost of goods sold) ÷ revenue × 100 |
| Working capital | Short-term cash cushion | Current assets − current liabilities |
| Burn rate | How fast the company spends cash | Cash spent minus cash earned, per month |
| Operating cash flow (OCF) | Cash generated by core operations | Net income + non-cash expenses ± changes in working capital |
| Accounts receivable and payable | Money customers owe you and money you owe suppliers | Sum of open sales invoices; sum of open purchase invoices |
| Value of invoices | Total invoiced in the period | Sum of invoice amounts in the period |
| Rate of return (RoR) | Gain or loss on an investment | (Current value − initial value) ÷ initial value × 100 |
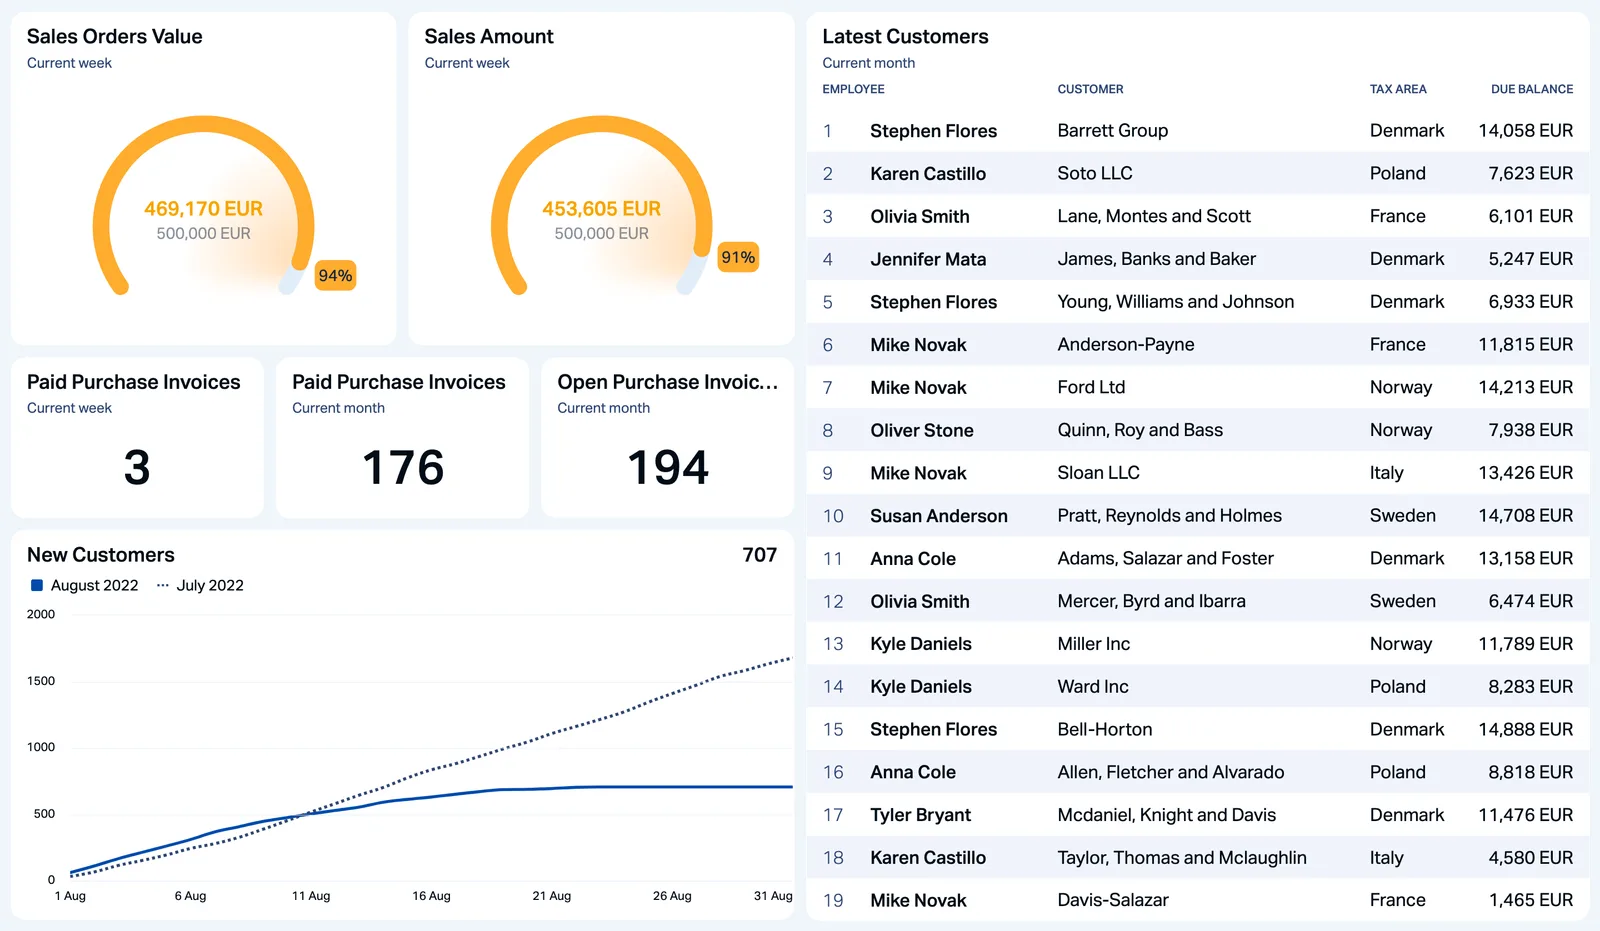
See the 10 important financial KPIs to track for how to read each one.
SaaS and subscription KPI examples
Founders, RevOps and customer success own these. They describe recurring revenue, how much of it you keep, and what it costs to grow it.
| KPI | What it measures | How to calculate it |
|---|---|---|
| Monthly recurring revenue (MRR) | Predictable subscription revenue per month | Sum of monthly subscription fees from active customers |
| New MRR | Recurring revenue added by new subscriptions | Sum of MRR from customers who subscribed this period |
| Churn MRR | Recurring revenue lost to cancellations | Sum of MRR from customers who canceled this period |
| Annual recurring revenue (ARR) | Yearly view of recurring revenue | MRR × 12 |
| Number of active subscriptions | Paying subscribers right now | Count of subscriptions in an active, paid state |
| Average revenue per account (ARPA) | Typical revenue from one customer account | Total recurring revenue ÷ number of accounts |
| Customer churn rate | Share of customers lost in a period | Customers lost ÷ customers at start of period × 100 |
| Customer lifetime value (CLV) | Revenue a customer brings over their lifetime | ARPA × gross margin % ÷ customer churn rate |

Formulas and context for each are in the 10 SaaS KPIs you should focus on, and the SaaS dashboard page shows layouts.
E-commerce and retail KPI examples
E-commerce managers own these. They follow the shopper from visit to order, and then ask whether that shopper comes back.
| KPI | What it measures | How to calculate it |
|---|---|---|
| Average order value | Typical amount spent per order | Total order value ÷ number of orders |
| Conversion rate of sessions to orders | Share of visits that end in a purchase | Orders ÷ website sessions × 100 |
| Cart abandonment rate | Shoppers who add to cart but do not buy | (Carts created − orders completed) ÷ carts created × 100 |
| Repeat purchase rate | Customers who buy more than once | Customers with 2 or more orders ÷ total customers × 100 |
| Time between purchases | How often a customer reorders | Total days between consecutive orders ÷ number of reorders |
| Inventory turnover | How quickly stock sells through | Cost of goods sold ÷ average inventory value |
| Number of new customers | First-time buyers in the period | Count of customers placing their first order |
| Return rate | Share of orders sent back | Returned orders ÷ total orders × 100 |
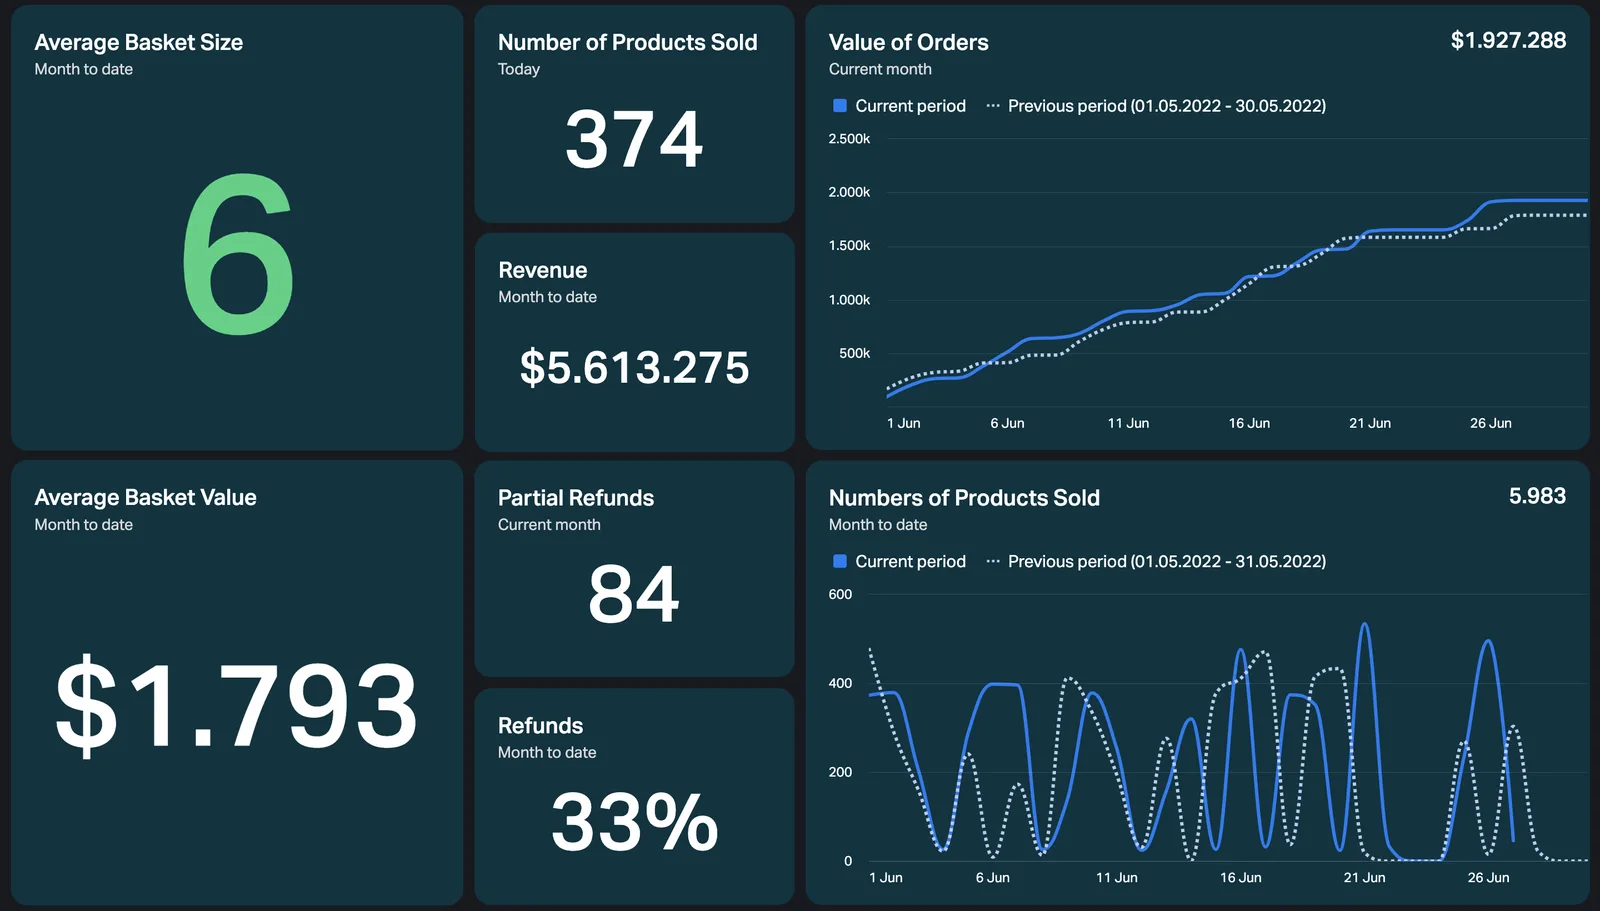
For more, read our e-commerce KPIs guide and the e-commerce dashboard page.
Project management and development KPI examples
Project managers, consultancies and engineering leads own these. They show whether work ships on time, on budget and at a rate that pays.
| KPI | What it measures | How to calculate it |
|---|---|---|
| Sum of reported hours | Time logged on projects | Sum of hours reported in the period |
| Utilization rate | How much of available time is billable | Billable hours ÷ available hours × 100 |
| Average billable rate | Typical hourly rate you earn | Total billed amount ÷ billable hours |
| Number of new tasks | Work arriving in the queue | Count of tasks created in the period |
| Number of new issues | New tickets for the development team | Count of issues created in the period |
| Number of completed issues | Tickets the team solved | Count of issues closed in the period |
| On-time delivery rate | Share of work finished by its due date | Tasks completed by due date ÷ tasks due × 100 |

The project management KPIs post explains how to use them, and the IT dashboard page shows development layouts.
KPI examples for companies, teams and individuals
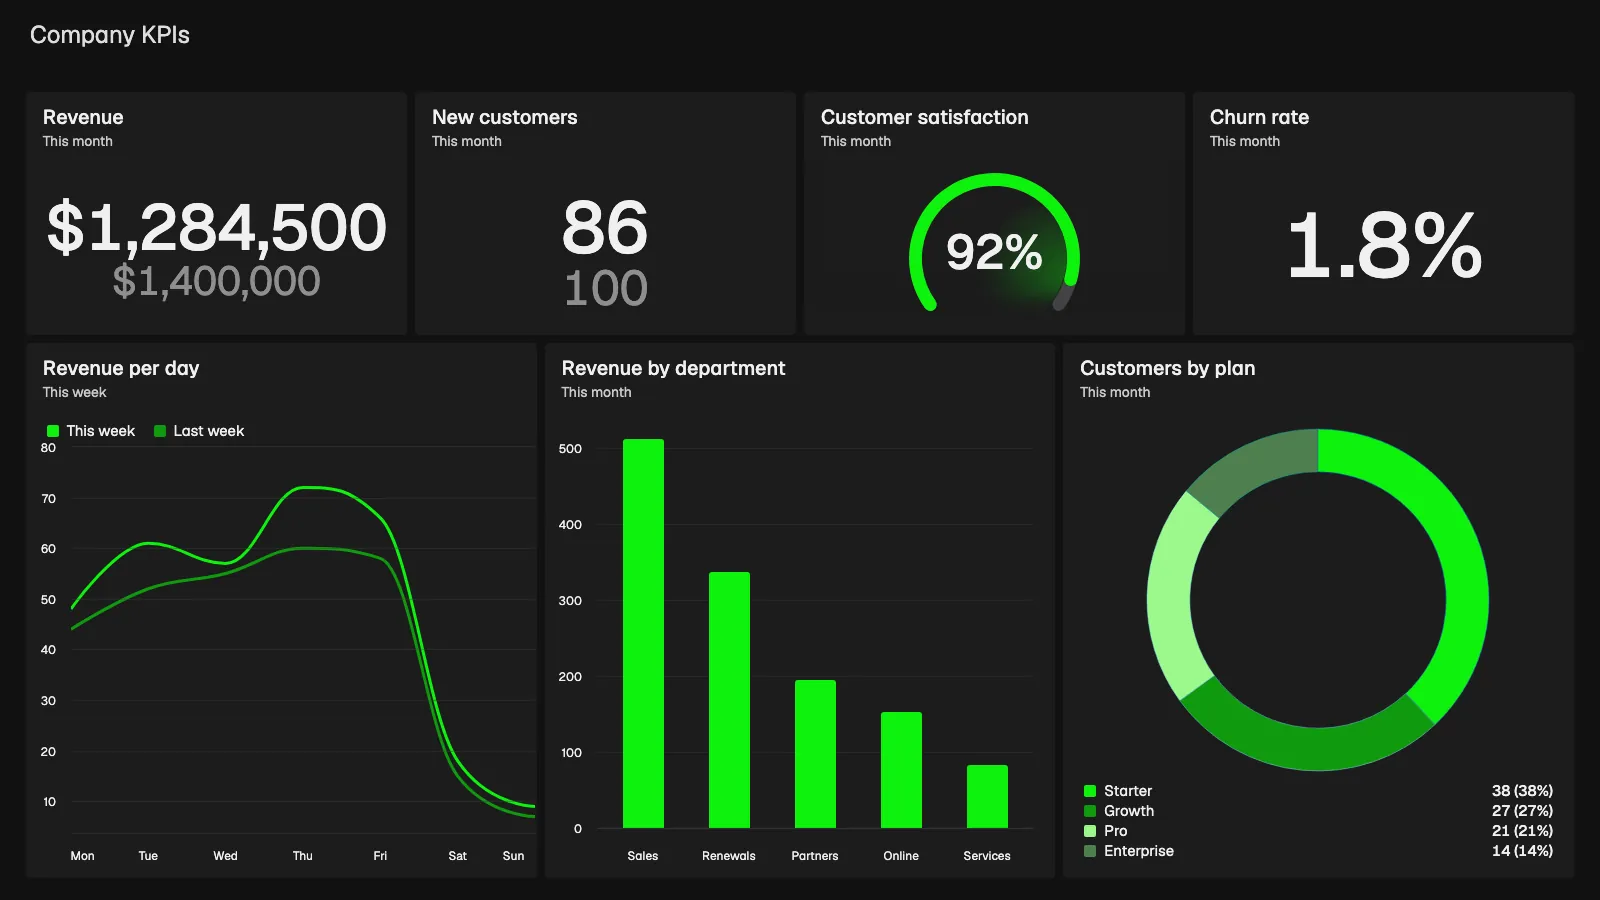
The same KPI can sit at three levels. Company KPIs show whether the business is healthy, team KPIs show whether a department delivers, and individual KPIs show what one person controls. Tie each level to the one above it.
Company-level KPIs
Revenue growth rate, gross profit margin and net promoter score. Leadership reviews these monthly or quarterly.
Team-level KPIs
Sales win rate for a sales team, first response time for support, call abandonment rate for a call center.
Individual KPIs
Number of won deals, tickets solved and customer satisfaction per agent. Keep them to what the person can influence.
How to choose KPIs from these examples
- Start from the objective. Write the goal first, for example "answer customers faster", then pick the indicator that proves it.
- Pair a leading and a lagging KPI. Calls made (leading) moves before revenue (lagging). Track both so you can act early.
- Give each KPI one owner. If three people own a number, nobody does.
- Set a target and a time frame. "Win rate of 25% this quarter" is a KPI. "Improve win rate" is a wish.
- Choose a review rhythm. Daily for operational numbers like the ticket backlog, weekly for team results, monthly for company numbers.
Stop at 3 to 7 per team. More than that and nobody remembers what matters.
Track your KPI examples on a live dashboard
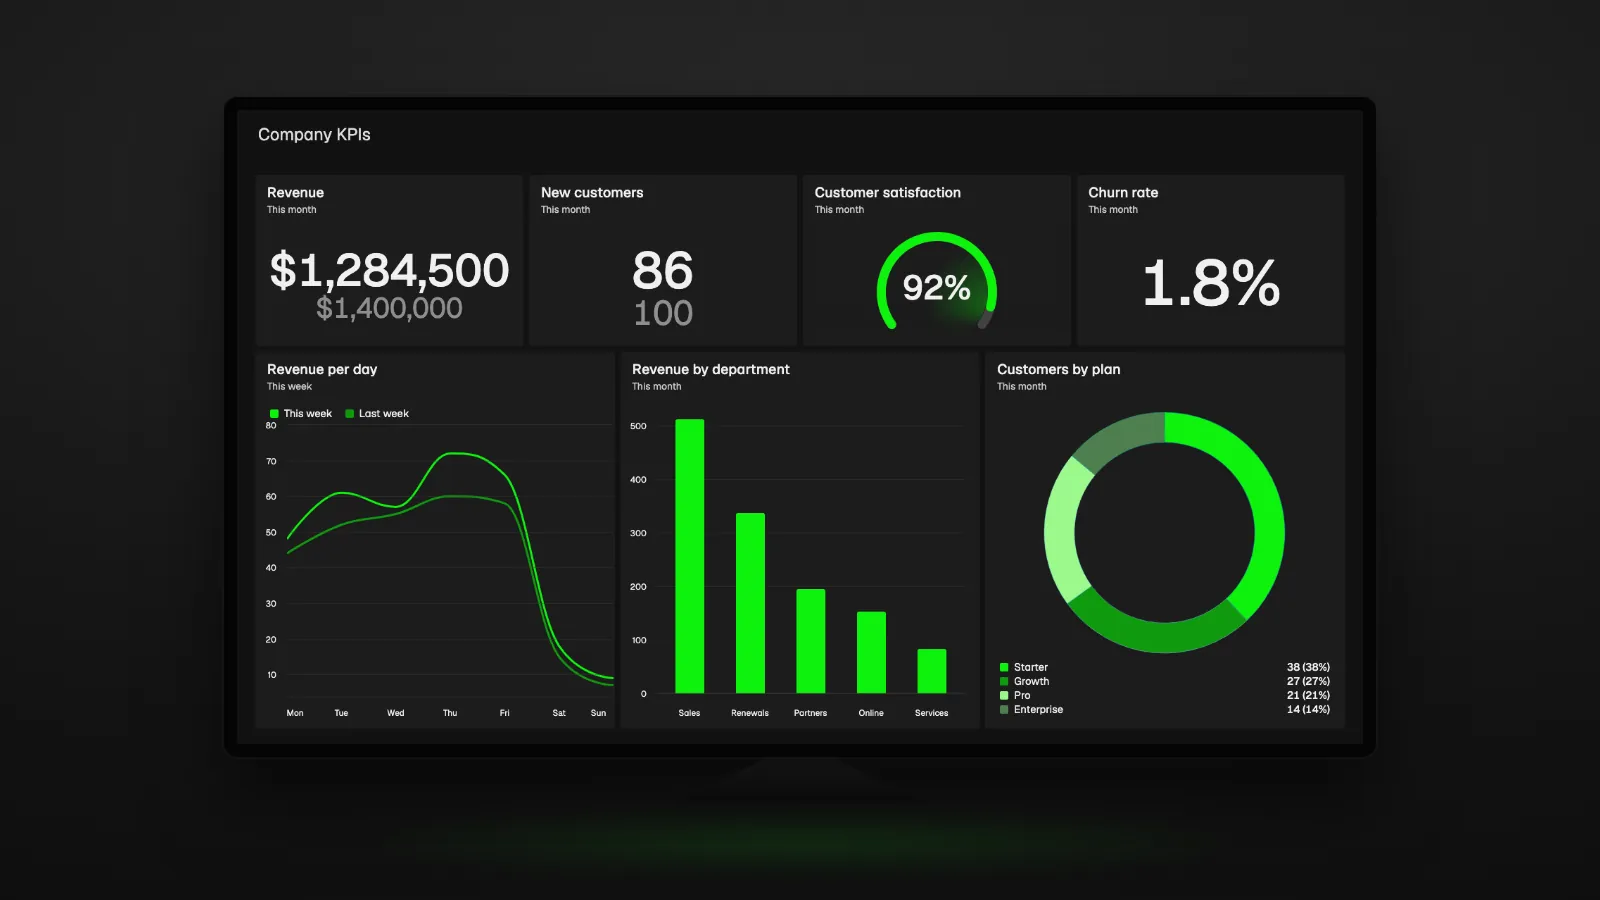
Plecto turns the indicators above into live numbers. Connect your CRM, helpdesk, phone system or billing tool through 150+ integrations, build any of these as a custom KPI, and set a target for each. Teams then see progress against target on real-time dashboards, on office TV screens, and in scheduled reports. If you do not want to write formulas by hand, the AI formula assistant (beta) can create one from a plain-language prompt. See how it works in our KPI dashboard software.
KPI examples FAQ
KPI examples are specific, measurable indicators that show progress toward a goal. Sales win rate, first response time, monthly recurring revenue and cart abandonment rate are common ones. Each has a formula, an owner and a target. This library groups 80+ of them by department, from sales to finance and support.
Five widely used examples: sales win rate (won deals ÷ won plus lost deals), customer satisfaction (CSAT), first response time, monthly recurring revenue (MRR) and gross profit margin. They cover sales, support, SaaS and finance. Each links to a page in this library with its definition and formula.
A good employee KPI is one the person controls and can measure daily. For a sales rep, number of won deals or sales win rate. For a support agent, tickets solved or customer satisfaction. For a call center agent, average call duration or first call resolution. Pair it with a target and a review date.
Sales win rate is a strong one: won deals divided by won plus lost deals, times 100. It shows how well reps convert opportunities. Pair it with a leading KPI such as number of leads created and a value KPI such as average deal size, so you see pipeline, conversion and revenue together.
A metric is any measurement, such as website visits. A KPI is a metric tied to a business goal, with a target and an owner. Calls made is a metric. Sales win rate against a 25% quarterly target is a KPI. Every KPI is a metric, but most metrics are not KPIs.
Most teams do best with 3 to 7 KPIs. That is enough to cover results, quality and activity, and few enough that everyone remembers them. Pick at least one leading and one lagging KPI, give each an owner, and review them on a fixed rhythm. Add more only when a goal needs it.
Leading KPIs predict results and can still be changed: number of calls made, leads created, or lead response time. Lagging KPIs report outcomes after the fact: revenue, sales win rate, customer churn rate or customer satisfaction. Track one of each per goal, so you can act before the result lands.
Plecto's KPI library lists 80+ KPI examples, and each page explains what the KPI measures and how it is calculated. You can build any of them as a KPI in Plecto from your own data sources, set a target, and show it on a live dashboard. Start with the department tables above.
Try Plecto free for 14 days.
No credit card required.