 Sign in

KPI dashboard software
KPI dashboard software for sales and support teams
Connect the tools your team already uses, turn the numbers into live KPI dashboards, and show them on desktop, mobile and office TVs, so everyone sees how they are doing while there is still time to act.
What is KPI dashboard software?
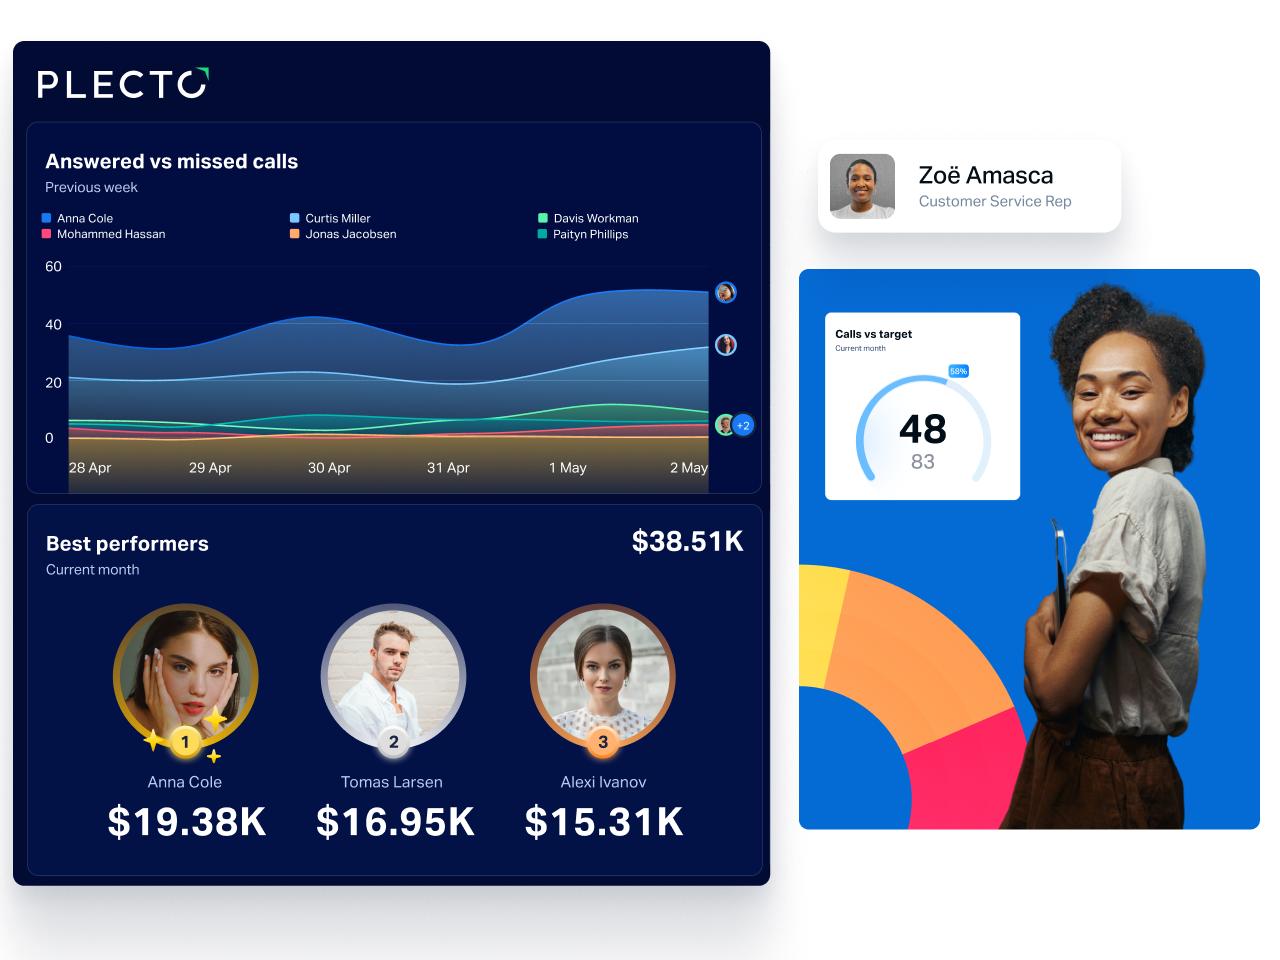
KPI dashboard software connects to the systems where your data lives, calculates your key performance indicators (KPIs) automatically, and shows them on live dashboards with targets and colors. It replaces manual spreadsheet reporting, so teams see where they stand right now instead of after the month closes.
A KPI is a number tied to a goal, such as revenue against quota, first response time or call abandonment rate. A KPI dashboard puts a handful of those numbers on one screen. Plecto is KPI dashboard software built for sales, contact center and customer service teams: the dashboards sit next to gamification, reports and coaching tools, so the same data that tracks performance also motivates people to improve it.
Why teams use KPI dashboard software
Everyone sees the same numbers
When KPIs live in a spreadsheet that one person updates, every meeting starts with a debate about whose numbers are right. With KPI dashboard software, each KPI is calculated once from the source data, so managers, agents and executives all look at the same figures.
Act during the day, not after the month
A report that arrives next week describes what already happened. A live dashboard shows a growing ticket backlog, a call queue or a slipping pipeline while you can still move people or change priorities. Plecto typically refreshes integration data about every two minutes.
Targets and colors tell people where they stand
Set a target on a KPI and use conditional colors to turn the widget red, yellow or green. Nobody has to read the formula to know whether they are on track.
KPI dashboard software features to look for
What Plecto includes, and the capabilities worth checking in any tool.
Connect your data
Native integrations for 150+ systems, including CRMs, helpdesks and phone systems. You can also use SQL databases such as PostgreSQL, MySQL and Microsoft SQL, Excel and Google Sheets, the Plecto API, or manual registrations for numbers that live nowhere else.
Custom KPIs and formulas
Define a KPI with the visual formula editor, start from a formula template, or describe the KPI in plain language to the AI Formula Assistant (beta). Browse our KPI library for definitions and formulas.
Dashboards on every screen
Show KPI dashboards in the browser, in the iOS and Android mobile app, and on an unlimited number of office TVs through slideshows, a TV app for Samsung, LG and Android TV, or any TV browser.
Scheduled reports
Turn the KPIs on your dashboards into reports, export them to PowerPoint or Excel, and schedule hourly, daily, weekly or monthly exports to arrive in your inbox. Reports are on the Large and Enterprise plans.
Targets and notifications
Give each person a target to hit, color widgets against it, and trigger a notification when a KPI meets a condition you set.
Gamification on the same data
Run contests, award achievements and hand out coins from the KPIs you already track. Contests, the reward store and reports are available on the Large and Enterprise plans.
KPI dashboard examples by team
The best KPI dashboard is built around one audience and a few decisions. These examples show what teams typically put on screen, and each links to the metrics behind it.
Sales KPI dashboard
Revenue against quota, pipeline value, win rate and activity per rep, often with a leaderboard. See sales dashboards for the full picture.
Call center KPI dashboard
Service level, calls waiting, abandonment rate and average handle time on a wallboard, with agent views for the team.
Customer service KPI dashboard
First response time, resolution time, ticket backlog and CSAT, so support teams see what needs attention first.
Executive KPI dashboard
A handful of company-level KPIs, such as revenue, new customers, satisfaction and costs, pulled from each department.
SaaS KPI dashboard
Recurring revenue, churn, trials and conversions for subscription businesses.
More KPI dashboard examples
Browse examples for customer retention, satisfaction, industries and more, then copy the setup into your own account.
How to choose KPI dashboard software
Seven things to check before you commit to a tool.
| What to check | Why it matters | Questions to ask |
|---|---|---|
| Data sources | A dashboard is only useful if it shows the data your team already creates. | Does it connect natively to your CRM, helpdesk and phone system? Can you add SQL, spreadsheets, an API and manual numbers? |
| Refresh rate | Live numbers let people react during the day. | How often does each source update? Which sources stream and which refresh on a schedule? |
| Who builds it | If only analysts can change a KPI, requests pile up. | Can a team leader build a KPI and a dashboard without code? Is there help for formulas? |
| Screens and TVs | Dashboards work best where the team already looks. | Are there TV slideshows, a TV app and a mobile app? Do TV screens cost extra? |
| Team engagement | Numbers on a screen do not change behavior on their own. | Are targets, notifications and contests part of the product, or a separate tool? |
| Reporting | Managers still need a weekly or monthly summary. | Can you schedule reports and export them to PowerPoint or Excel? |
| Pricing model | Pricing per user, per dashboard or per data source scales differently. | What are the limits on dashboards, data sources and screens? What is the minimum team size? |
Plecto is priced per license, with unlimited dashboards and unlimited data sources on every plan and no extra cost for TVs. See pricing for current plans, or see how Plecto compares in our TV dashboard software guide.
KPI dashboard software vs BI tools
Business intelligence (BI) tools and KPI dashboard software overlap, but they are built for different jobs.
- BI tools are built for analysts who explore large datasets, join tables and answer open-ended questions. They are powerful, but they usually need someone with data skills to build and maintain the reports.
- KPI dashboard software is built for teams who track a small set of numbers against targets, as they change. It trades flexibility for speed: connect a source, pick a KPI, put it on a screen.
Many companies use both: BI for periodic deep dives, and a KPI dashboard for the daily numbers that teams act on. If your question is "how is the team doing right now?", start with KPI dashboard software. If it is "why did revenue change last year?", start with BI.
How to set up a KPI dashboard in Plecto
- Pick the audience and three to five KPIs. Decide who the dashboard is for and choose three to five KPIs per person. More than that and the screen gets noisy. Our guide to building a KPI dashboard shows how to choose.
- Connect your data. In Data sources, add a new data source and choose your system, upload a spreadsheet to a manual data source, or send data through the API.
- Create your KPIs. Use formula templates, the visual formula editor or the AI Formula Assistant to turn raw data into KPIs such as win rate or first response time.
- Build the dashboard. Use the Dashboard Builder to pick a system and up to five widgets, or start from an empty dashboard and add your own KPIs. Set targets and conditional colors.
- Put it where the team looks. Add the dashboard to a TV slideshow, share it in the mobile app, and invite your teams. Schedule a report for managers.
KPI dashboard software FAQ
KPI dashboard software connects to your business systems, calculates your key performance indicators automatically and displays them on live dashboards with targets and colors. Teams see current performance on screens, desktop and mobile, instead of waiting for a manual spreadsheet report at the end of the week or month.
A KPI dashboard is a single screen that shows a small set of key performance indicators for a team or a company, usually as numbers, gauges and charts compared with a target. A good one has a clear audience, a handful of KPIs and colors that show on track or off track at a glance.
BI tools are built for analysts who explore data and answer open-ended questions. KPI dashboard software is built for teams who track a few numbers against targets as they change. BI suits periodic deep dives, while a KPI dashboard suits the daily numbers a sales or support team acts on.
Plecto's dashboard best practices recommend three to five KPIs per person. A dashboard with a clear audience and a few numbers is read and acted on, while a screen packed with every available metric is ignored. If you need more KPIs, build separate dashboards for different roles.
Plecto has native integrations for 150+ systems, including CRMs, helpdesks and phone systems. You can also connect SQL databases, upload Excel files, link Google Sheets, send data through the API, or add numbers by hand with manual registrations. Browse the integrations library to see if your tools are covered.
Yes. Plecto shows dashboards on an unlimited number of TVs at no extra cost. Use slideshows with the Plecto TV app for Samsung, LG and Android TVs, or open tv.plecto.com in any TV browser. See the TV dashboards guide for setup tips.
No coding is needed. The Dashboard Builder generates a dashboard from a system and up to five widgets, formula templates give you ready-made KPIs, and the AI Formula Assistant (beta) writes a formula from a plain-language description. Complex KPIs are easier with the formula editor, and our onboarding team can help.
Yes. Plecto has a 14-day free trial, and no credit card is required. During the trial you can connect your data sources, build KPI dashboards, set targets, show them on a TV and invite your team, so you can test the software on your own numbers before choosing a plan.
Start building your first KPI dashboard today.
14-day free trial. No credit card required.