 Sign in

How to Find the Right KPI Key Performance Indicator Example for Your Business
Every KPI key performance indicator example you need: formulas, benchmarks and ownership rules for sales, marketing, finance, HR and support teams.
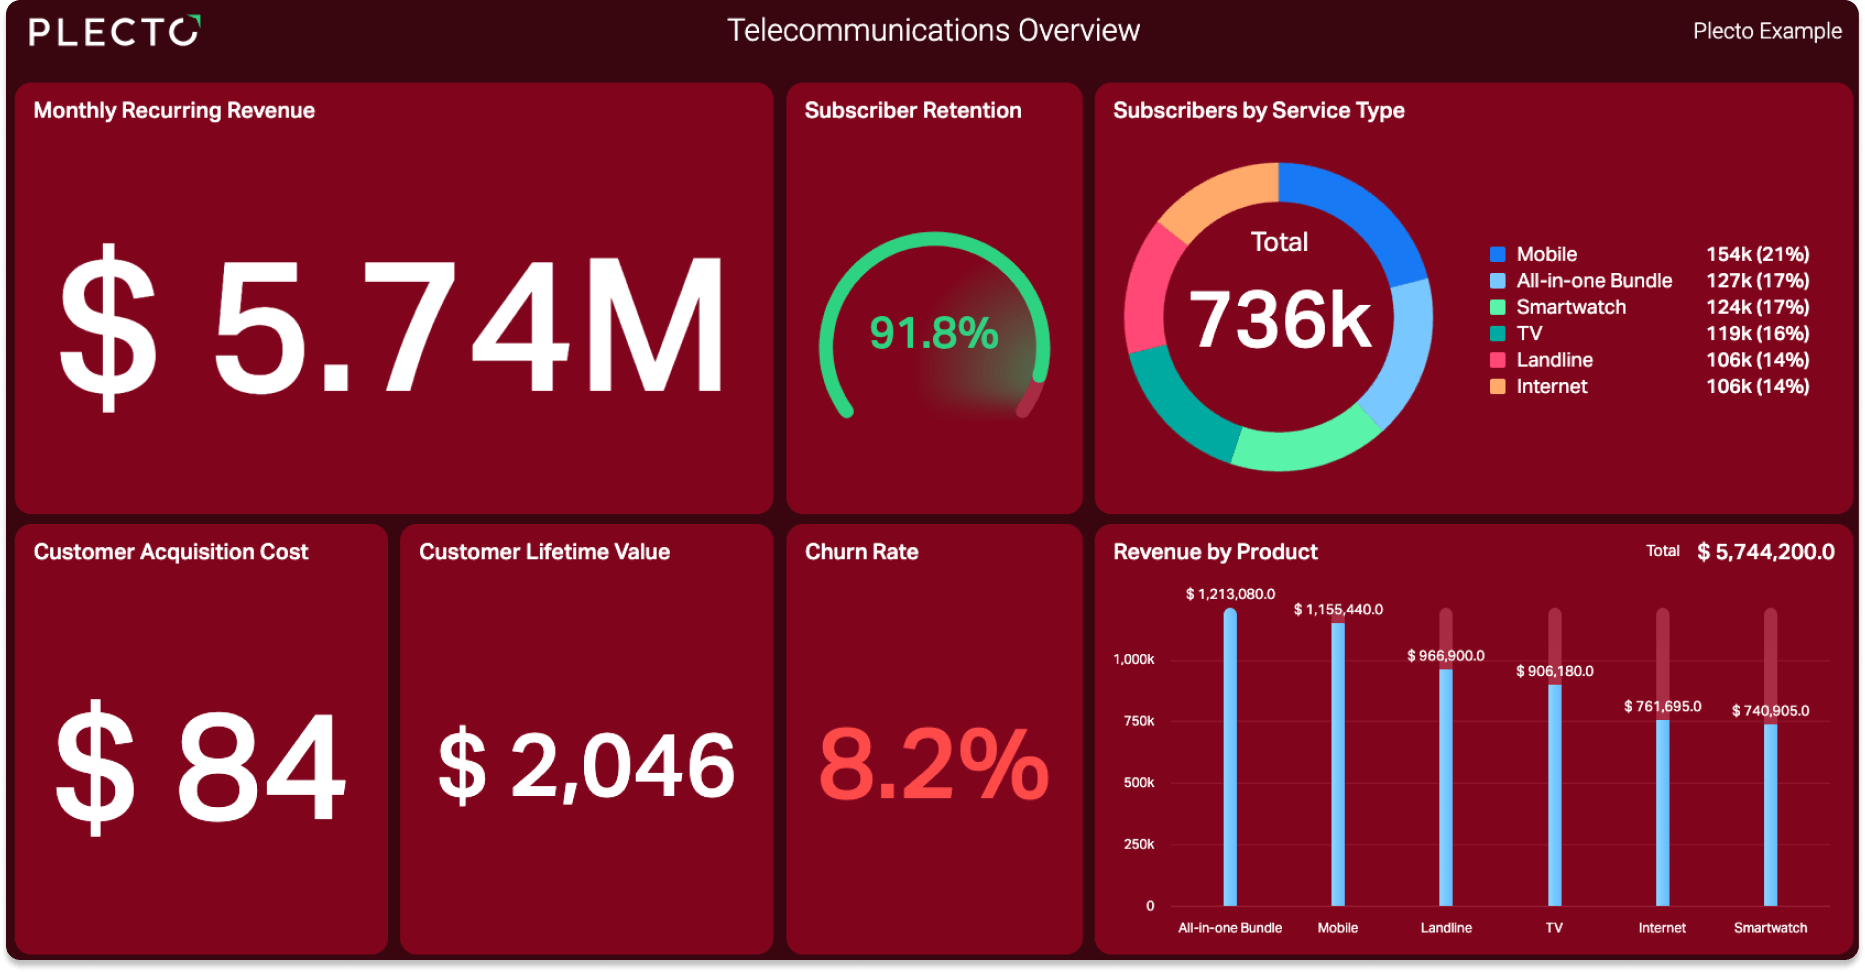
Every key performance indicator is a metric, but not every metric is a key performance indicator. If your team tracks website traffic, you are looking at a metric. If you track the conversion rate of those visitors to measure a specific marketing campaign, you are tracking a KPI. Organizations generate huge amounts of data every day, which makes it hard to separate vanity numbers from the ones that actually drive growth. The right KPI key performance indicator example for your department tells you where to focus.
A business performance platform like Plecto lets you track, visualize, and optimize operational data in real time. By connecting your CRM, support tools, and financial software, you turn raw data into decisions your team can act on the same day. This guide covers the formulas, frameworks, and benchmarks you need to build dashboards that improve performance rather than decorate a wall. You can see how a workspace comes together in the getting started documentation.
Metrics vs. key performance indicators
Metrics track the status of a business process. They give useful context but do not tell you whether you are hitting your goals. Key performance indicators tie directly to a strategic objective. They measure progress toward a defined target over a specific timeframe.
Take a retail business. The number of people walking into the store is a metric. It tells the manager how busy the floor is. The percentage of those visitors who buy something is a KPI, because that conversion rate drives revenue and reflects how well the staff and the product displays are working.
When you set up real-time dashboards, put the KPIs that match your core objectives on the main screen. Move the supporting metrics to separate reports where people go for deeper analysis.
Frameworks for tracking KPIs: OKRs and MPRA
Picking a target is only the first step. You also need a system to manage it. These two come up most often; our guide to KPIs covers the Balanced Scorecard and SMART alongside them.
The OKR framework
Objectives and Key Results connects a high-level company objective to measurable outcomes. The Objective is qualitative, such as becoming the market leader in your region. The Key Results are the quantitative KPIs that measure progress toward it. If your objective is to improve customer satisfaction, your key results might be raising Net Promoter Score to 50 and cutting average ticket resolution time below two hours.
The MPRA framework
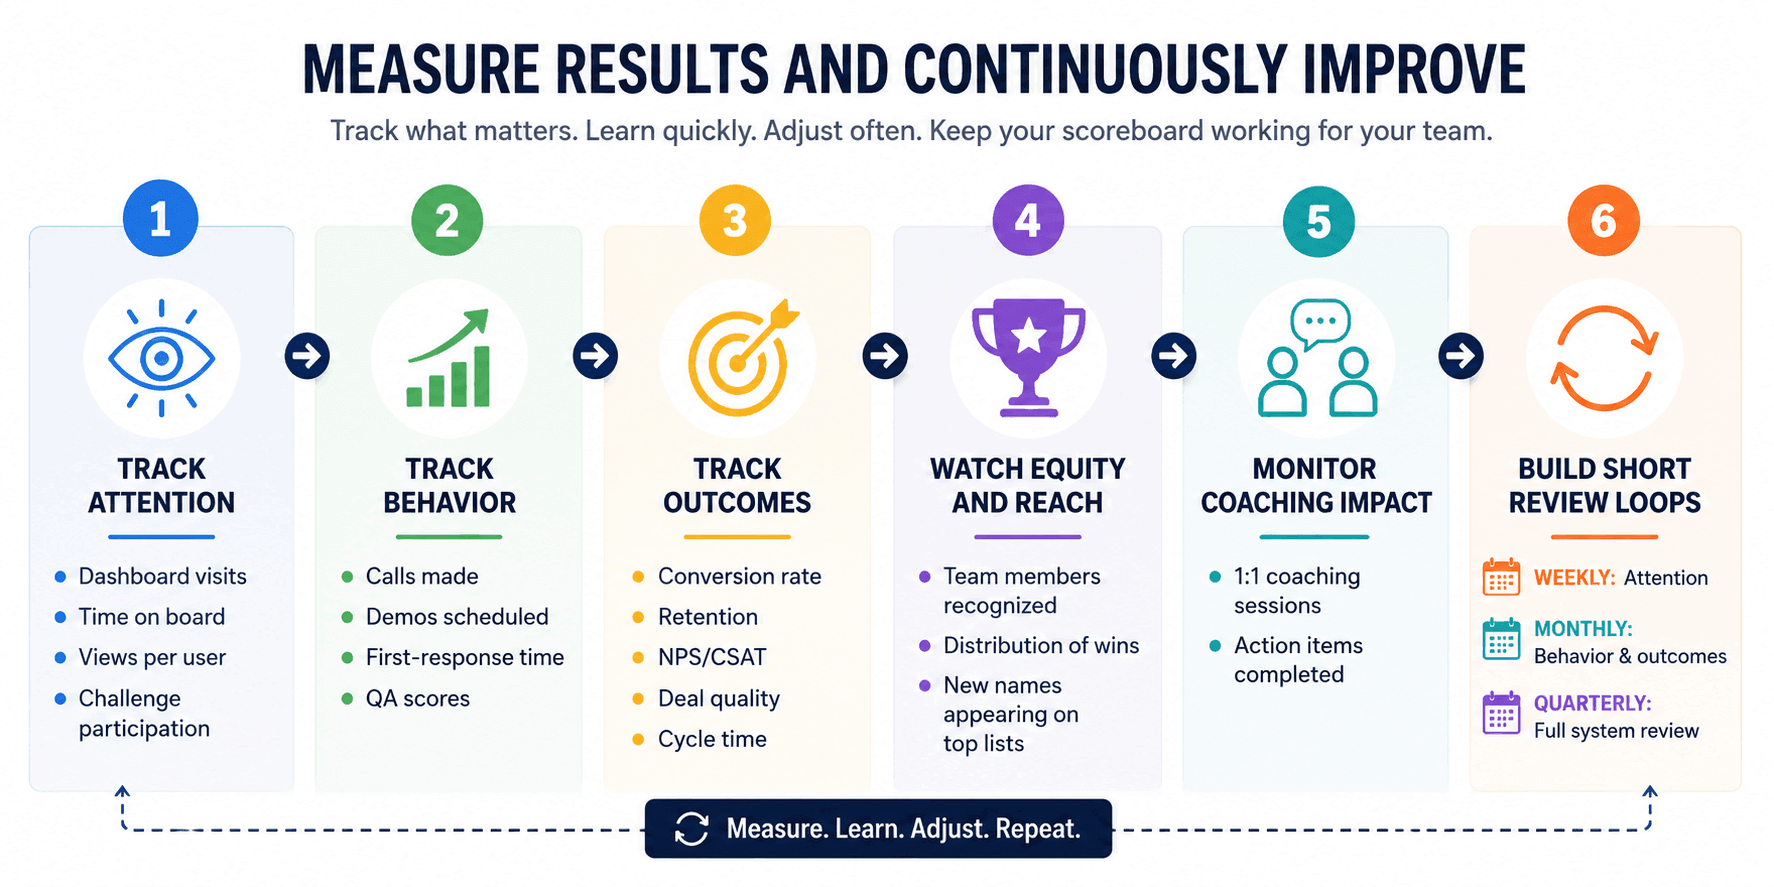
Measure, Perform, Review, Adapt follows the lifecycle of a KPI. You measure the baseline, the team performs while watching live data, management reviews the results at a set interval, and the organization adapts its strategy based on what it finds. One-on-one meetings and performance agreements in the coaching tools give managers somewhere concrete to run the review and adapt phases.
How to assign KPI ownership and governance
A target means nothing if nobody is accountable for it. Three rules keep the data trustworthy.
Assign a single owner to every KPI. That person does not have to do all the work, but they report on the number and explain any variance. Document the data source and the exact calculation. If sales calculates revenue one way and finance another, trust in the dashboard collapses. Set a review cadence, so the owner knows whether this number is reported daily, weekly, or monthly. You can mirror that structure in Plecto through teams and employees settings.
Sales KPI examples, formulas, and benchmarks
Sales teams need clear targets and live visibility into where they stand.
A note on the rules of thumb below: they are the figures the industry quotes most often, not measured standards. Treat them as a starting point for a conversation about your own targets, and weight your own trend over any of them.
Monthly recurring revenue (MRR)
Monthly recurring revenue is the predictable revenue from all active subscriptions in a given month. For a subscription business, it is the number everything else hangs off.
Formula: (Number of active customers) × (Average billed amount per customer)
Rule of thumb: Subscription businesses commonly aim for 10 to 15 percent month-over-month growth, though what is realistic depends heavily on stage and market. On a live dashboard, a drop shows up the day it happens instead of at the end of the quarter.
Customer lifetime value (CLV)
Customer lifetime value estimates the total revenue you can expect from one customer account across the whole relationship. It tells you how much you can afford to spend acquiring a new one. Our guide to measuring CLV goes deeper on improving it.
Formula: (Average purchase value) × (Average number of purchases) × (Average customer lifespan)
Rule of thumb: The widely used guideline is a CLV worth at least three times what you spend to acquire the customer.
Win rate
The win rate of deals shows what share of your sales opportunities turn into paying customers. It reflects both the quality of your leads and the strength of your pitch.
Formula: (Total won deals / Total closed deals) × 100
Rule of thumb: B2B win rates are often quoted around 20 percent, with strong teams well above it, but the figure swings hard by deal size and segment. Your own trend over time tells you more than the industry number.
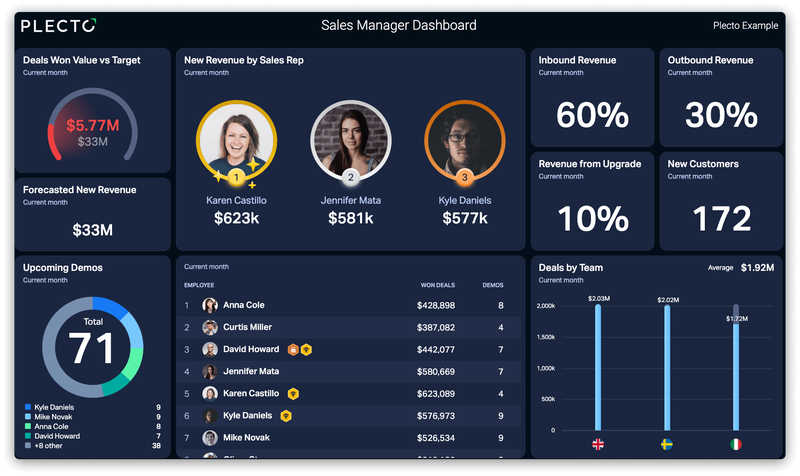
Targets on a screen only work if people engage with them. Gamification features like automated notifications, real-time contests, and achievement badges turn a daily sales target into something the team competes over.
Marketing KPI examples, formulas, and benchmarks
Marketing has to connect spend to revenue. A useful marketing KPI measures cost efficiency and lead quality, not brand awareness.
Customer acquisition cost (CAC)
Customer acquisition cost is what you spend to win one new paying customer, including ad spend, marketing software, and the salaries of the team.
Formula: (Total sales and marketing expenses) / (Number of new customers acquired)
Rule of thumb: The same 3:1 guideline applies from this side. At 1:1 you are losing money on every new customer.
Return on ad spend (ROAS)
Return on ad spend evaluates a specific advertising campaign: how much revenue each unit of ad budget returns.
Formula: (Revenue attributed to ads / Cost of ads)
Rule of thumb: 4:1 is the figure most often set as a target, meaning four dollars back for every dollar spent. What counts as good depends on your margin — a high-margin product can live with less. You can pull this straight into Plecto through the data sources and integrations.
Website visitor conversion rate
Traffic is a metric. The sales conversion rate is the KPI: the share of visitors who take the action you care about, such as filling in a lead form or buying.
Formula: (Total conversions / Total website visitors) × 100
Rule of thumb: Rates vary widely by industry and traffic source. Low single digits is a common starting expectation for B2B software.
Finance KPI examples and formulas
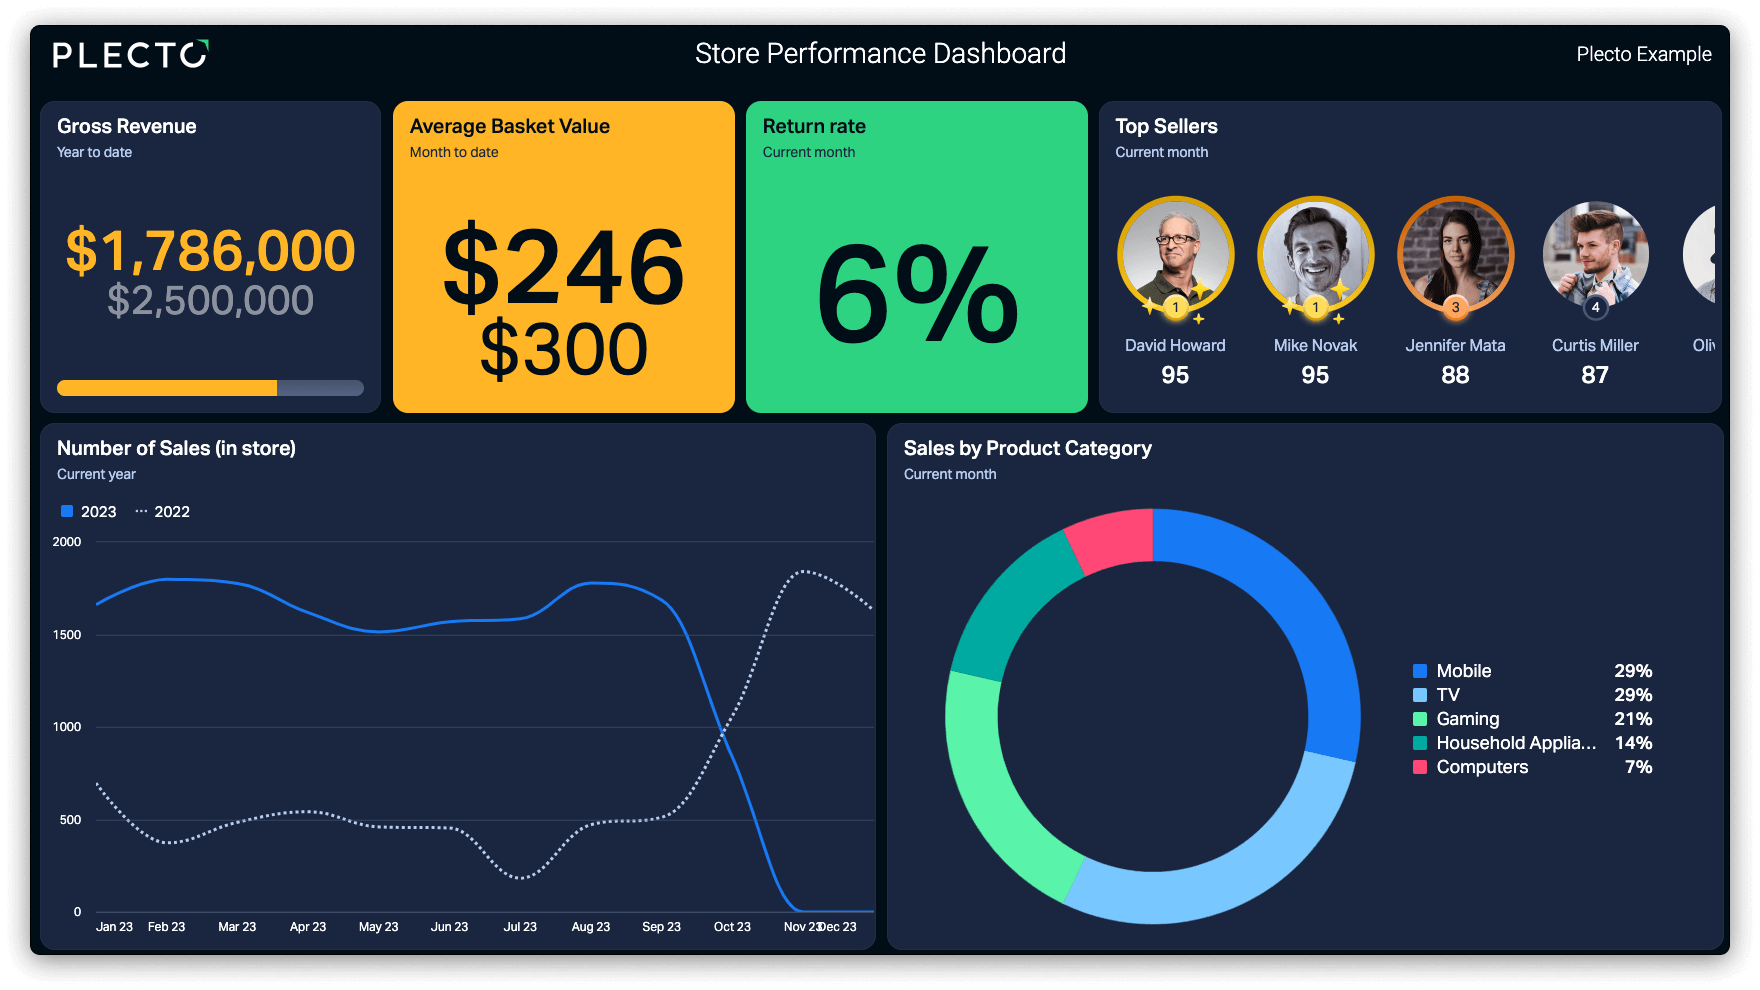
Financial KPIs are the scorecard executives and board members read. They cover profitability, cash flow, and efficiency, and they travel well into monthly reporting through the dashboards and reports features.
Return on investment (ROI)
Return on investment measures the profitability of an investment relative to its cost. It is the standard way to judge a software purchase or a new hire.
Formula: (Net profit / Cost of investment) × 100
Rule of thumb: Entirely dependent on asset class and risk. Internal business investments are often held to at least 15 to 20 percent.
Operating profit margin
Operating profit margin shows how much profit remains on each unit of sales after variable costs such as wages and materials, but before interest and tax.
Formula: (Operating income / Total revenue) × 100
Rule of thumb: 10 to 15 percent is often described as healthy across industries, with software companies typically running higher.
Financial data usually lives in spreadsheets or accounting software. Plecto takes data from direct integrations, the API, SQL, Google Sheets, Stripe, Excel uploads, and manual entry, so the finance numbers sit next to everything else. Our guide to building an accounting dashboard goes through that setup in detail.
HR and customer support KPI examples
Your employees and your existing customers are the assets most dashboards forget.
Net promoter score (NPS)
Net promoter score measures loyalty with one question: on a scale of 0 to 10, how likely are you to recommend us? Scores of 9 and 10 are Promoters, 7 and 8 are Passives, and 0 through 6 are Detractors.
Formula: (% of Promoters) − (% of Detractors)
Rule of thumb: The usual reading is that anything above 0 is net positive, above 30 is good, and above 50 is excellent.
Employee turnover rate
Employee turnover is the share of staff who leave during a period. Sustained high turnover usually points at management, pay, or culture rather than at the individuals.
Formula: (Number of employees who left / Average number of employees) × 100
Rule of thumb: Around 10 percent a year is often treated as normal, but it varies enormously by sector — retail and hospitality run far higher by design. The number worth watching is your own, against your own history.
Average resolution time
For support teams, speed is the product. Average resolution time tracks how long an agent takes to fully resolve an issue from the moment the ticket opens.
Formula: (Total time taken to resolve tickets / Total number of resolved tickets)
Rule of thumb: Common targets are under 24 hours on email and under 15 minutes on live chat.
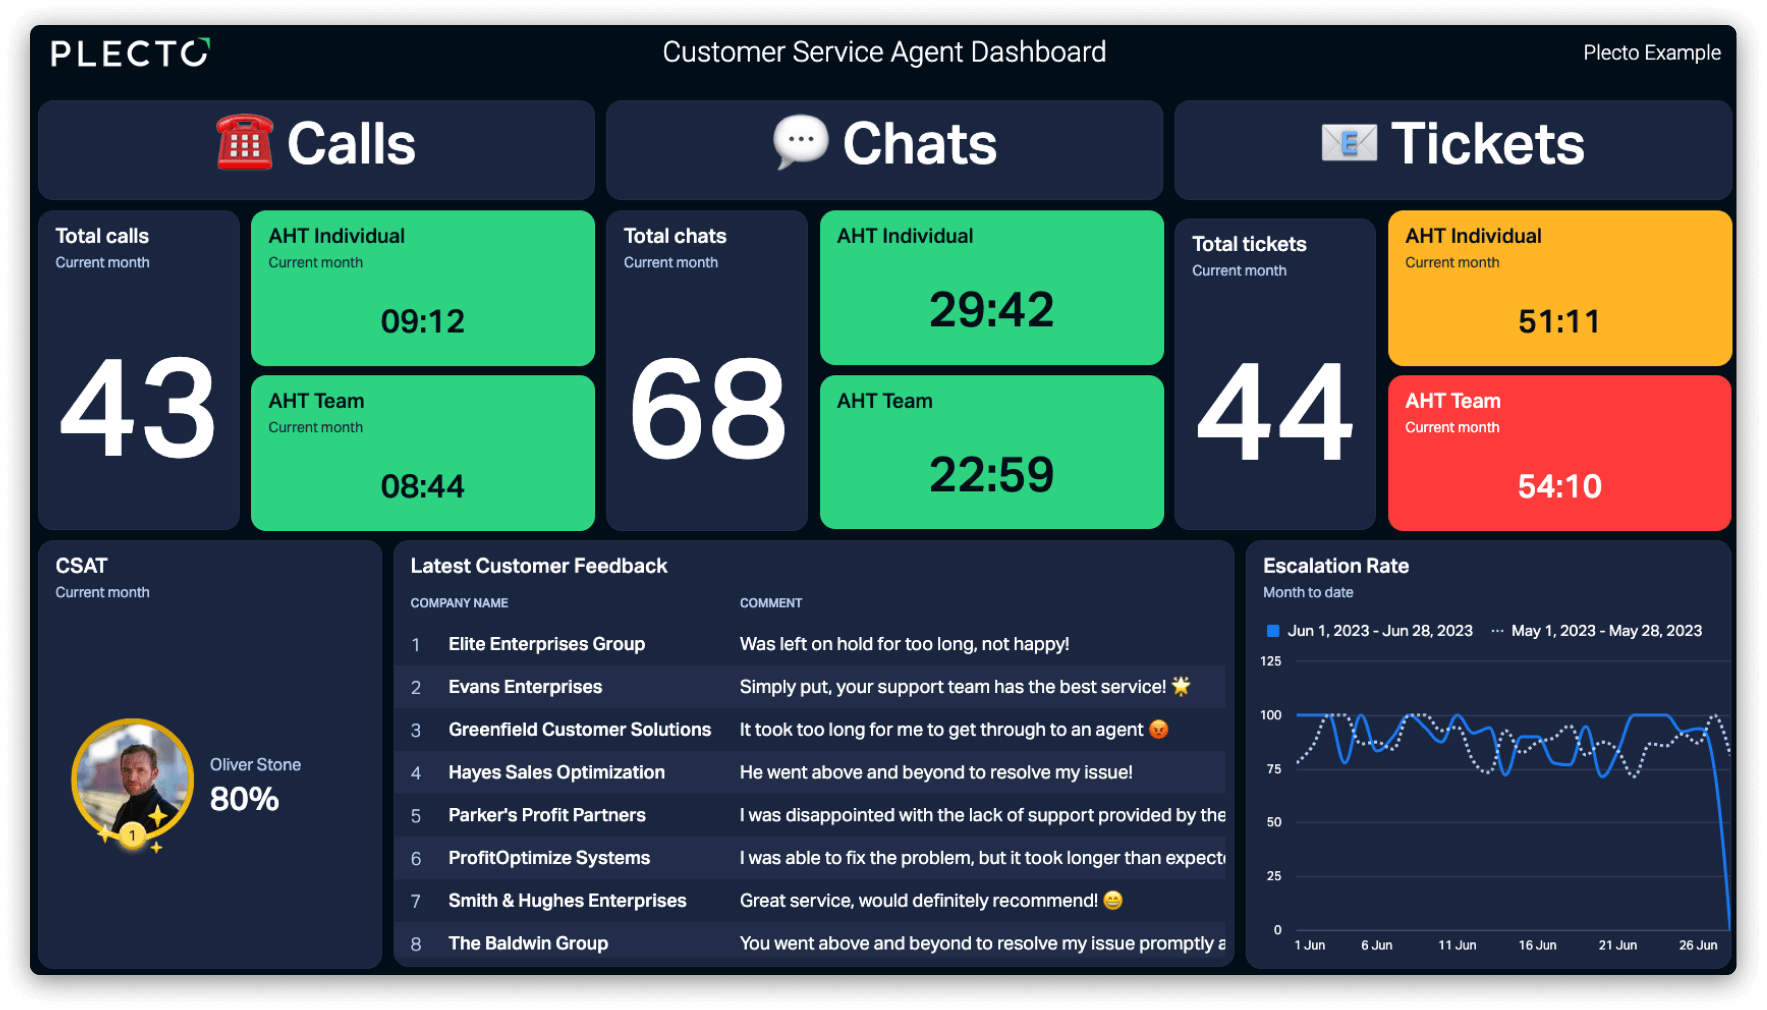
Connecting Zendesk or Dixa puts these numbers on the office screens, where the team can see the queue building before it becomes a backlog.
How to visualize and act on your data
Data only helps if the team sees it. KPIs buried in a spreadsheet lead to misalignment and missed targets, so bring them into the room.
Plecto integrates with 150+ business systems, including Salesforce, Pipedrive, and HubSpot. Live dashboards run on office TV screens through slideshows on LG and Samsung TVs, and remote staff reach the same targets through the mobile app for iOS and Android.
Building them does not require a data team. Plecto supports dashboard building in plain conversation through MCP, which works with Claude and ChatGPT, and the AI Formula Assistant writes the complex calculations for you.
This scales further than it looks. G4S, Denmark's oldest and largest emergency response company and part of a group employing over 800,000 people worldwide, rebuilt its Sales and Retention department around Plecto dashboards, replacing the Excel sheets that used to carry management reporting.
Choosing your first KPI key performance indicator example
Picking the right KPI key performance indicator example for your department is where a data-driven culture starts. Whether that is MRR in sales, CAC in marketing, or average resolution time in support, you need an accurate formula, a named owner, and a screen the team actually looks at. Move the numbers out of static spreadsheets and onto live dashboards, and people get the context to hit the target while there is still time to act.
See how Plecto turns your KPIs into dashboards your team actually uses.
Questions
KPI examples FAQs
Most departments should focus on three to five primary KPIs. Tracking more dilutes focus and makes it hard to tell which numbers are driving growth. Keep the primary targets on the main dashboard and move secondary metrics into detailed reports.
It depends on the metric. Sales teams should watch MRR and daily activity in real time. Marketing usually reviews CAC and ROAS weekly. Executive teams review financial KPIs such as operating profit margin monthly or quarterly.
Plecto integrates with 150+ business systems, including Salesforce, Pipedrive, Zendesk Support, and Google Sheets. The getting started guide walks through setting up the first connection, and anything without a native integration can come in via API, SQL, or Excel.
A metric reports the status of a process, such as how many calls were made. A KPI measures progress toward a strategic objective over a set timeframe, such as the share of those calls that converted into booked meetings. Every KPI is a metric; most metrics are not KPIs.
Start your 14-day free Plecto trial today.
Enjoyed the article? Share it:


