 Sign in

Executive dashboards
Executive dashboard examples for a complete company overview
Create an executive dashboard to visualize your company’s key KPIs, and get the full picture of your organization’s performance on one single source of truth.
What is an executive dashboard?
An executive dashboard is a single, real-time view of the company-level KPIs that leadership uses to steer the business, such as revenue, pipeline, customer satisfaction and costs. It pulls data from the systems each department already uses, so executives see how the whole company is performing without waiting for a manually compiled report.
Unlike a team dashboard, which tracks daily activity such as calls or meetings, an executive dashboard shows results against targets and the trends behind them. It usually holds a handful of numbers per leader, each one tied to a goal the leadership team owns. The sections below show executive dashboard examples for the CEO, CFO, COO and sales leader, and how to build one.
Get a panoramic view of your company's operations
View all your departments on one executive dashboard
Visualize each department's key KPIs on one easy-to-understand dashboard. Pull data from each department and keep track of the essential company-level metrics.
Read more about real-time dashboardsKPIs for a bird's eye view
Design your executive dashboard so that you get an all-around picture of your company's performance. Visualize essential KPIs like MRR, CSAT score, and new business sign-ups and track your data in real-time.
See our library of KPIs
CEO dashboard example: the KPIs to track
A CEO dashboard is an executive dashboard built for the chief executive: a handful of company-level numbers, each shown against a target. For a subscription business, a CEO dashboard typically shows:
- Revenue growth: revenue growth rate against plan, month to date and year to date.
- Recurring revenue: MRR and ARR, with new MRR and MRR churn beside them.
- Pipeline and sales results: weighted pipeline value and win rate.
- Customer health: customer satisfaction (CSAT) or Net Promoter Score.
- Efficiency and cash: customer acquisition cost, gross profit margin and operating cash flow or burn rate.
Plecto's own CEO tracks MRR and ARR, churn, LTV, CAC and cash flow this way. Read how Plecto uses Plecto from the CEO's perspective for the full list and where each number comes from.
CEO dashboard example

CFO, COO and sales leader executive dashboard examples
Each leader needs a different slice of company data. Start from the questions the role has to answer, then pick the KPIs that answer them.
CFO dashboard
- Gross profit margin
- Operating cash flow
- Burn rate
- Revenue growth rate
- Budget versus actual cost
COO dashboard
- Average resolution time
- First response time
- Customer satisfaction (CSAT)
- Orders or jobs completed against target
- Output per team
Sales leader dashboard
- Win rate
- Weighted pipeline value
- Average sales cycle length
- Sales conversion rate
- Revenue against quota
Looking for more layouts? Browse our dashboard examples or the management dashboard page.
What to include on an executive dashboard
Include a number only if it changes a decision. A useful executive dashboard has four layers:
| Layer | What it answers | Example KPIs |
|---|---|---|
| Results | Are we hitting our goals? | Revenue vs. target, MRR, gross profit margin |
| Growth | Is the business growing? | New customers, new MRR, pipeline value |
| Health | Are customers and teams in good shape? | CSAT, churn, first response time |
| Cash | Can we fund the plan? | Operating cash flow, burn rate, cost vs. budget |
Show each KPI with a target and a time comparison, such as this month against last month, so the number carries meaning at a glance. Keep the detail in team dashboards that sit beneath the executive view and link out to them, rather than crowding the top screen.
Real-time executive reports
Simplify your executive reporting
Say goodbye to manually compiling reports over and over again. Automatically display the KPIs you are already visualizing on your dashboards, and watch your data update in real-time.
Schedule, automate and export!
If you have a recurring meeting or need reports to be ready to hit certain deadlines, then our reporting feature is perfect. Simply schedule your executive reports to be sent out at a specific time to your email, or export them as a PowerPoint or Excel file.
Learn more about real-time reporting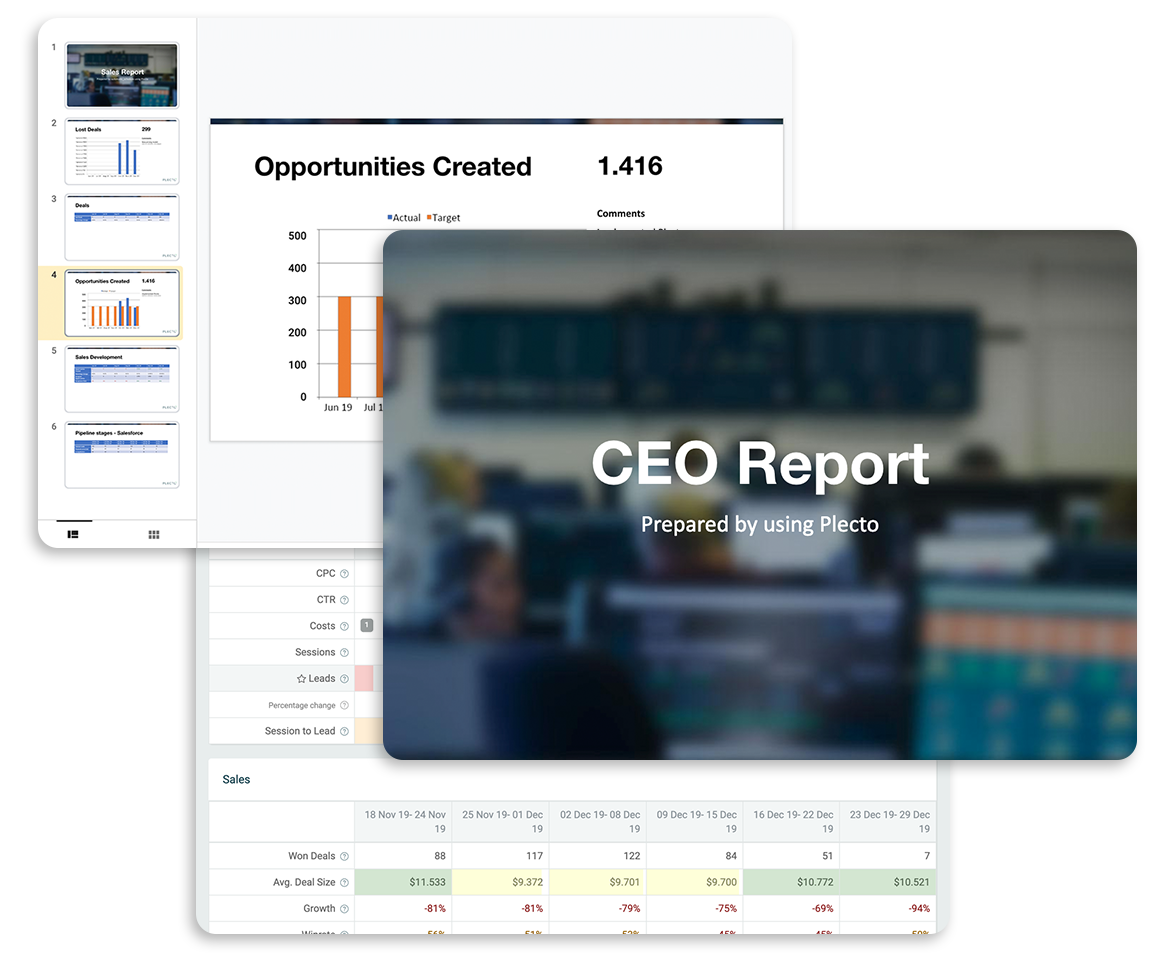

“I never need to spend time on dragging our reports; when you have Plecto, you get everything in one solution.”

Nikolaj Boffy
Nordic Retention Team Manager, Nets
How to build an executive dashboard in Plecto
- Connect your data. Link the systems that hold your company KPIs, such as your CRM, billing or accounting tool, helpdesk and spreadsheets, from our library of 150+ integrations.
- Create the dashboard. Go to Dashboards > New dashboard. Use the Dashboard Builder to generate widgets from a connected system, or start with an empty dashboard and add your own KPIs.
- Add one widget per KPI. Pick widgets from templates or build your own formulas, then set the time period for each KPI and compare it with a target.
- Restrict access. Limit the dashboard to the leadership team with team-based access settings, so sensitive numbers stay with the people who need them.
- Share it. Put the dashboard on a TV with slideshows, and send the same KPIs as scheduled reports in PowerPoint or Excel for board and management meetings.
You can try all of this in the free 14-day trial. For organizations with several departments or locations, see how an enterprise dashboard rolls team numbers up to management.
Executive dashboard best practices
- Keep it to a handful of KPIs. Our dashboard guidance is three to five KPIs per person, so give each leader a short list rather than one crowded screen.
- Mix leading and lagging indicators. Pair results such as revenue with the activity and quality KPIs that predict them, such as pipeline and win rate.
- Set a target for every KPI. A number without a target does not tell leadership whether to act.
- Use real-time data. Numbers that update automatically are trusted more than a monthly spreadsheet. Plecto refreshes data from your connected systems, so you stop compiling reports by hand.
- Review it on a rhythm. Open the same dashboard in every leadership meeting and revisit the KPI list each quarter. For more on layout and design, read our KPI dashboard guide.
CEO dashboards let you make data-driven decisions
A properly-constructed CEO dashboard will give you the confidence to take big decisions with the knowledge that they are backed by data. Use the insights that are generated by your KPIs to improve the performance of your business.

Stay in control of your data
Data is at the heart of any successful modern business, so we give you the tools to put you in control
Customizable and easy to use
Plecto puts you in control of what you want to visualize. Our platform is intuitive, and you don't need to have experience with coding or be a data whizz to manage the platform.

“It’s the whole ‘what gets measured gets managed’ mentality. With data visualization, I can address performance problems in real time.”

Cort Ouzts
CEO of POS Nation
Discover how Plecto will benefit your whole company
Gamification to spark motivation
Gamification is a powerful tool that is proven to boost the engagement, motivation and performance of employees. Set up contests, achievements and notifications to bring your data to life.
150+ integrations
Our ever-growing library of native integrations contains many of the most popular systems used by sales, support and marketing teams. Connect your systems in just a few clicks and visualize on Plecto in real-time.
Performance Agreements
Master your performance management by introducing performance agreements with Plecto. Empower your employees by implementing targets and goals that they are responsible for hitting.

“Plecto saves us at least 8 hours every day just from team leaders not having to manually organize and gather data.”

Johan Hilding
CEO and Co-Founder Förebygg
Executive dashboard FAQ
An executive dashboard is a real-time overview of the company-level KPIs leadership uses to steer the business, such as revenue, sales pipeline, customer satisfaction and costs. It replaces manual reporting with numbers that update automatically from the systems your teams already use.
Pick a handful of KPIs that reflect your strategic goals: typically revenue against target, new and lost customers, pipeline value, customer satisfaction, and cost or budget metrics. Our KPI library has formulas for each.
An executive dashboard is built for leadership and focuses on company-level KPIs. An enterprise dashboard gives every department and location its own live view and rolls the numbers up for management.
Yes. Plecto turns the KPIs on your dashboards into automated reports and sends them by email in PowerPoint or Excel format on a schedule you choose.
A CEO dashboard is an executive dashboard built for the chief executive. It shows a few company-level KPIs against target, typically revenue growth, recurring revenue, pipeline, customer satisfaction and cash flow, so the CEO can spot problems early and report to the board with current numbers.
List the decisions leadership makes, choose three to five KPIs per leader that inform them, and connect the systems that hold the data. In Plecto you create a dashboard, add one widget per KPI with a target, restrict access to leadership, and show it on a TV or send it as a scheduled report.
Start building your first dashboard today.
No credit card required.