 Sign in

A Guide to KPIs (Key Performance Indicators) for Modern Teams
A practical guide to KPIs (key performance indicators): leading vs lagging, the SMART, MPRA, Balanced Scorecard and OKR frameworks, and what goes wrong.
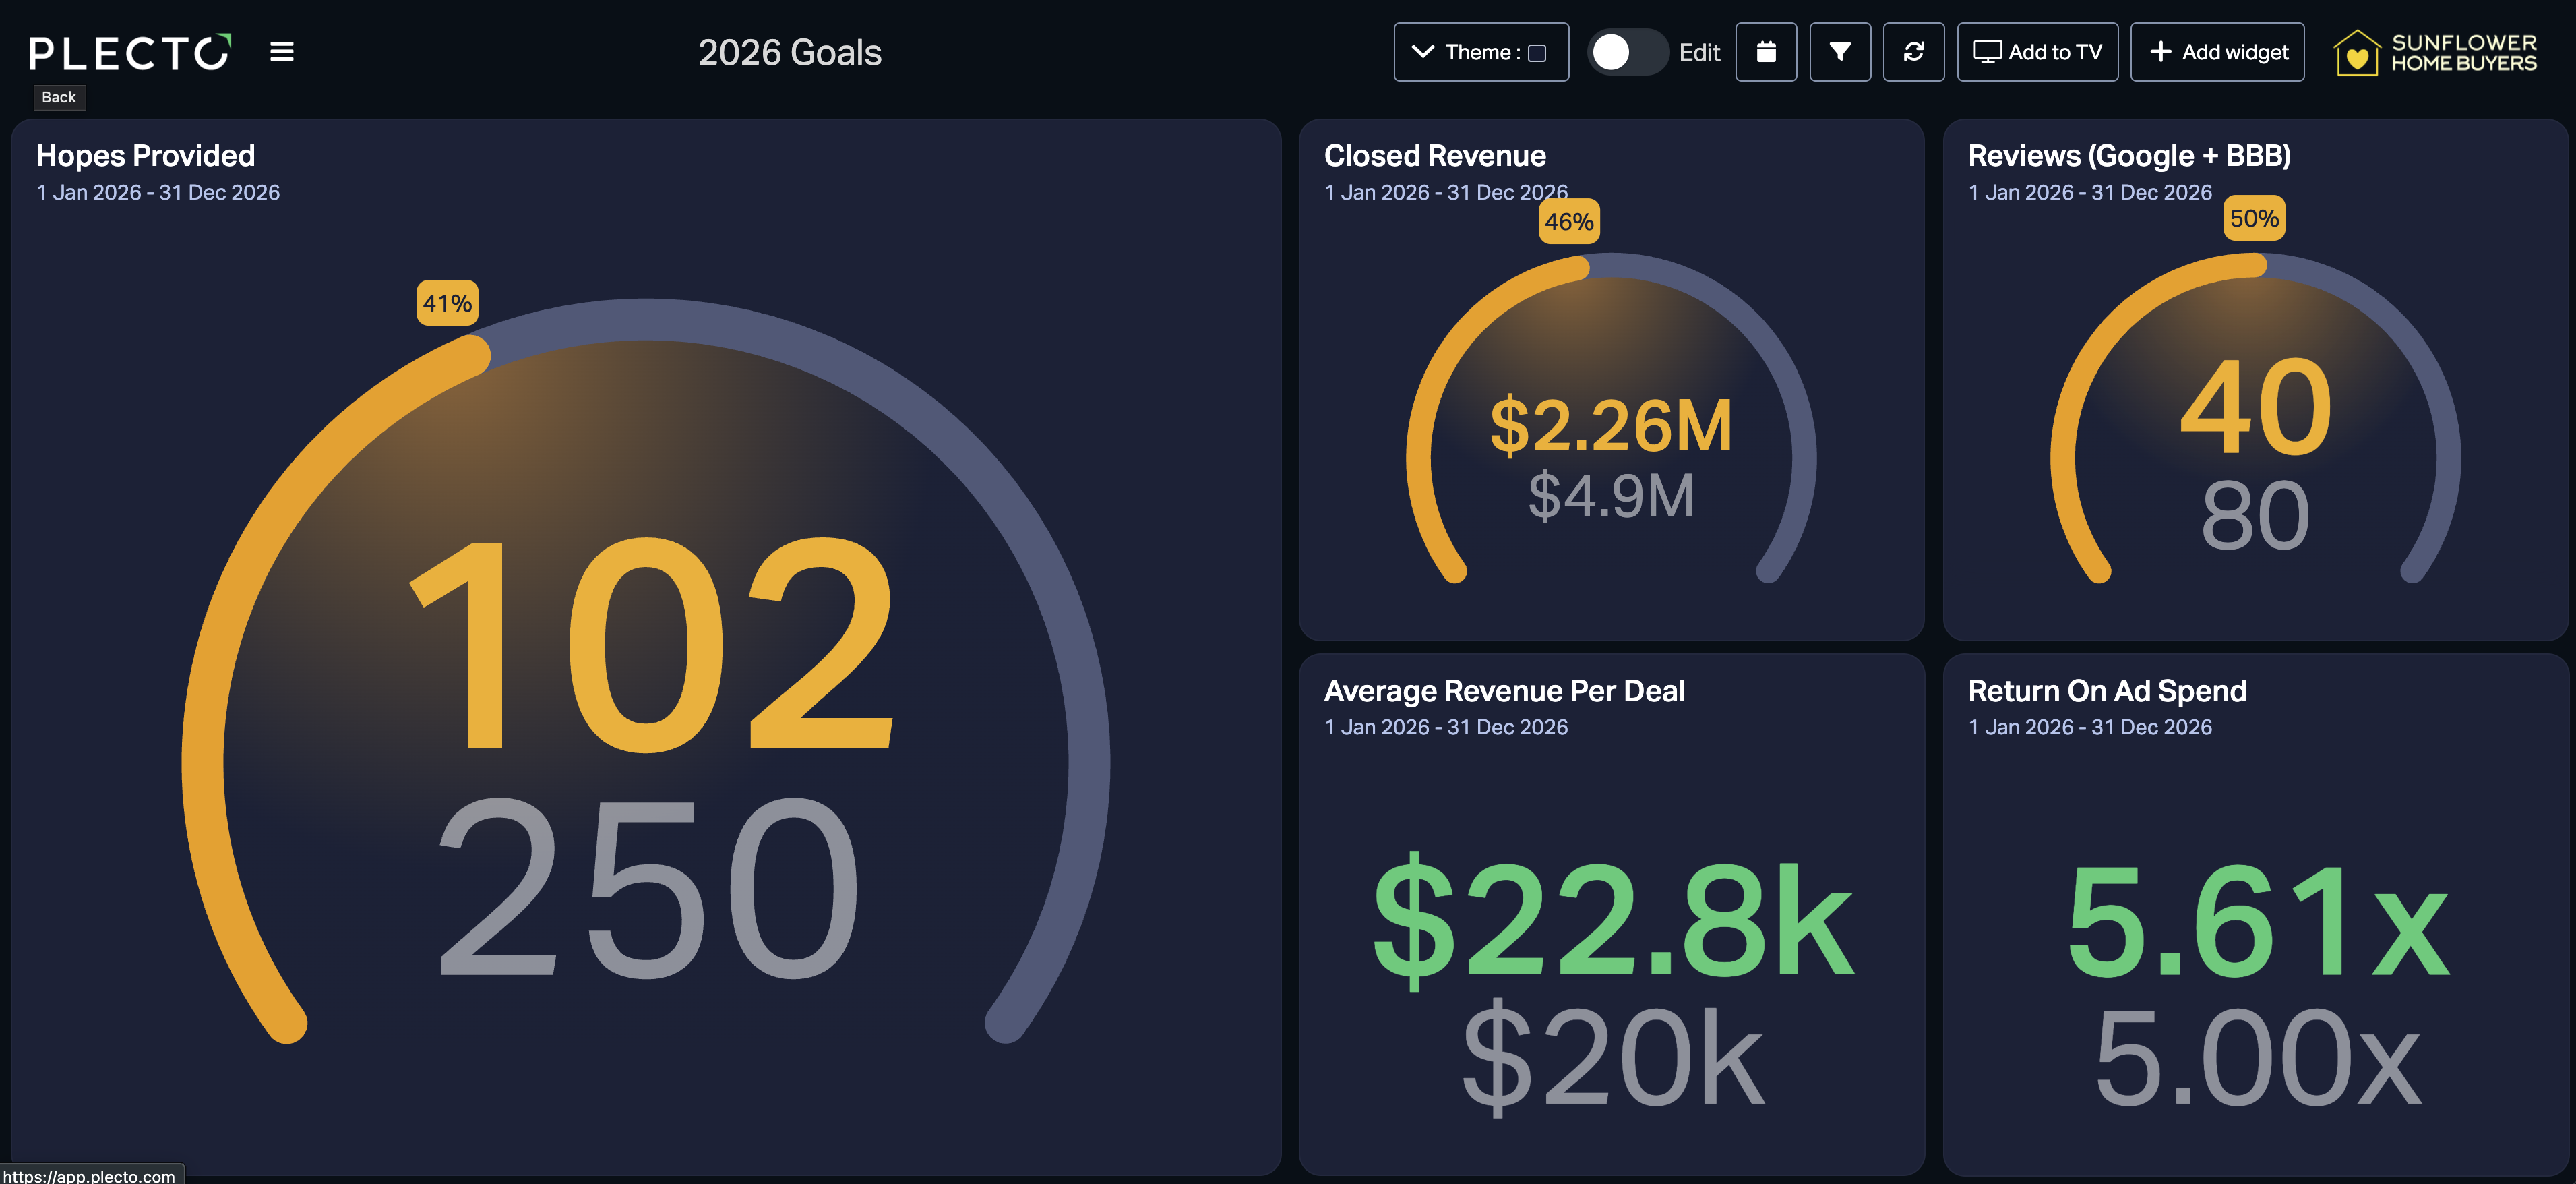
Tracking business success takes more than raw data. KPIs (key performance indicators) filter out the noise by connecting daily operations to the goals the company is actually chasing. Most management teams struggle to balance the tactical measures that run the week against the strategic ones that decide the year, and a well-defined indicator is what resolves that tension. It gives the team a target, measures progress objectively, and shows where the strategy needs adjusting.
This guide covers how indicators differ from ordinary metrics, how to balance the predictive ones against the backward-looking ones, the frameworks worth using, and the failure modes that make a badly chosen indicator worse than no indicator at all. If you want the formulas and benchmarks for specific numbers, start with our KPI examples by department.
The difference between a metric and a KPI
People use the two terms interchangeably, but they do different jobs. A metric is any quantifiable measure of business activity. A KPI is a strategic metric tied to a specific business outcome. All KPIs are metrics; most metrics are not KPIs.
| Metrics | KPIs | |
|---|---|---|
| Purpose | Track granular operational data | Measure progress toward strategic goals |
| Focus | Tactical and broad | Strategic and specific |
| Example | Email open rates, website traffic | Net Promoter Score, customer acquisition cost |
| Actionability | Gives context for daily tasks | Drives executive decisions |
If your goal is to increase market share, your indicator might be the new customer acquisition rate. Daily website visitors is a metric that supports that goal without defining whether the strategy worked.
Balancing leading and lagging indicators
Effective tracking needs both kinds. Relying on one creates a blind spot.
Leading indicators are predictive. They measure the activities that shape future outcomes. Operator training hours in a manufacturing plant is a leading indicator: more training hours now usually means fewer safety incidents later. In sales, weighted pipeline value is a leading indicator of next quarter's revenue.
Lagging indicators measure results. Defect rates, closed-won revenue, and employee turnover confirm whether the strategy worked. They are definitive, and they arrive too late to change the outcome they describe.
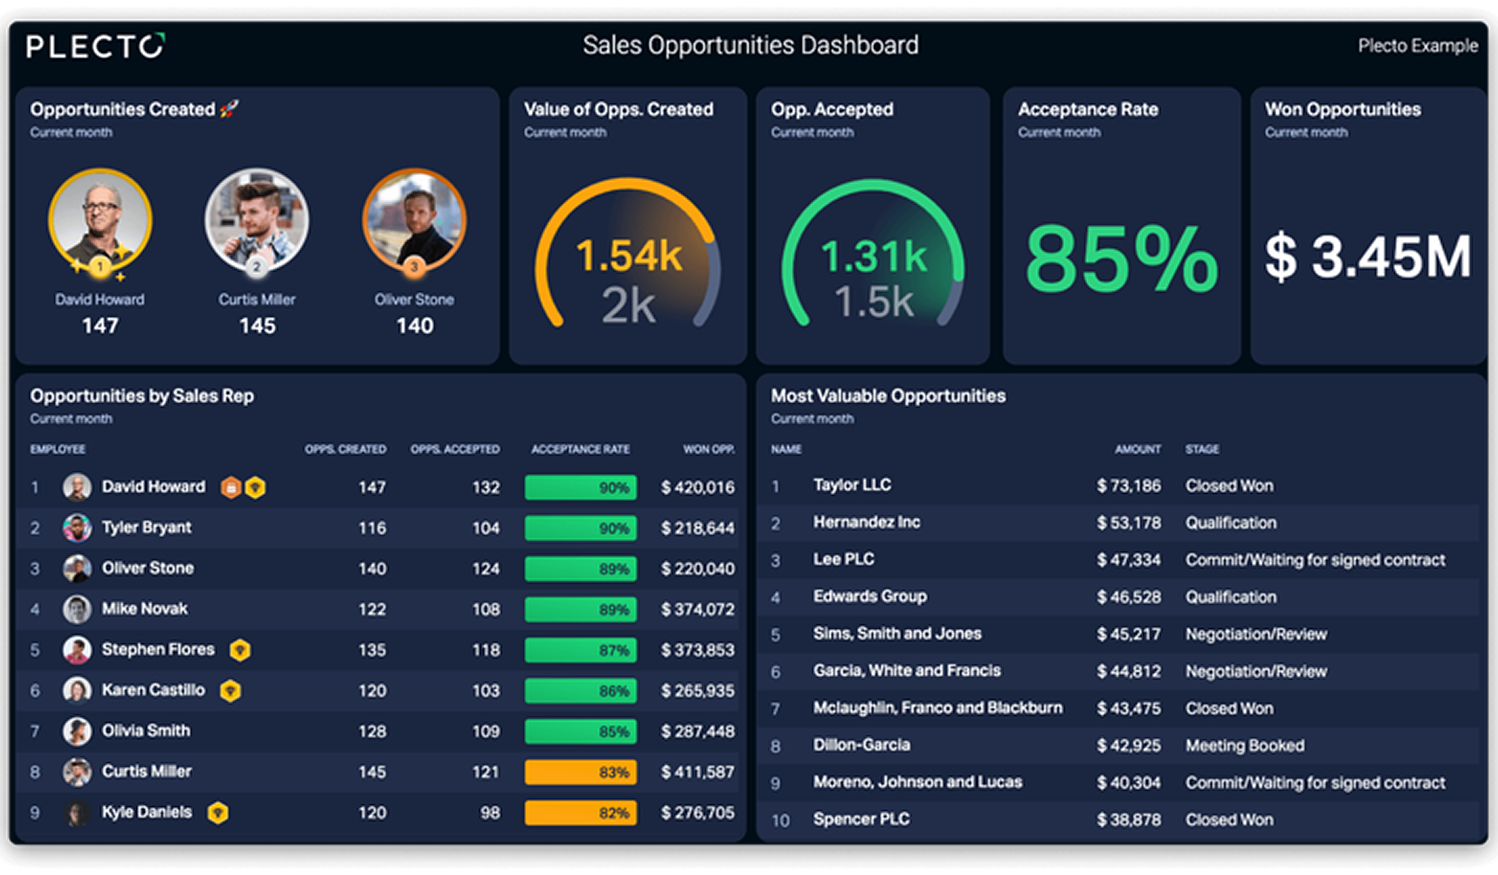
Successful organizations manage the day on leading indicators and validate the strategy on lagging ones. The dashboard above does both at once: opportunities created and acceptance rate drive today's behavior, while won opportunity value reports what that behavior produced.
Proven frameworks for setting goals
Choosing indicators works better with a system behind it. Four frameworks cover most situations.
The SMART framework
SMART keeps goals Specific, Measurable, Achievable, Relevant, and Time-bound. "Improve sales" cannot be tracked. "Achieve a 20 percent increase in new customers over the next quarter" can. The detail is what removes the argument about whether you hit it.
The MPRA framework
Measure, Perform, Review, Adapt is a loop rather than a target. Measure the baseline, let the team perform against it, review the results at a set interval, adapt the strategy from what you find. The cycle is what stops a goal from going stale. The coaching tools give the review and adapt phases somewhere to happen.
The Balanced Scorecard
Introduced by Kaplan and Norton in 1992, the Balanced Scorecard forces you to look past the financials, evaluating performance across four perspectives: financial, customer, internal processes, and learning and growth. It exists to catch the trade-off where improving one area quietly damages another, such as cutting costs at the expense of customer satisfaction.
Objectives and Key Results (OKRs)
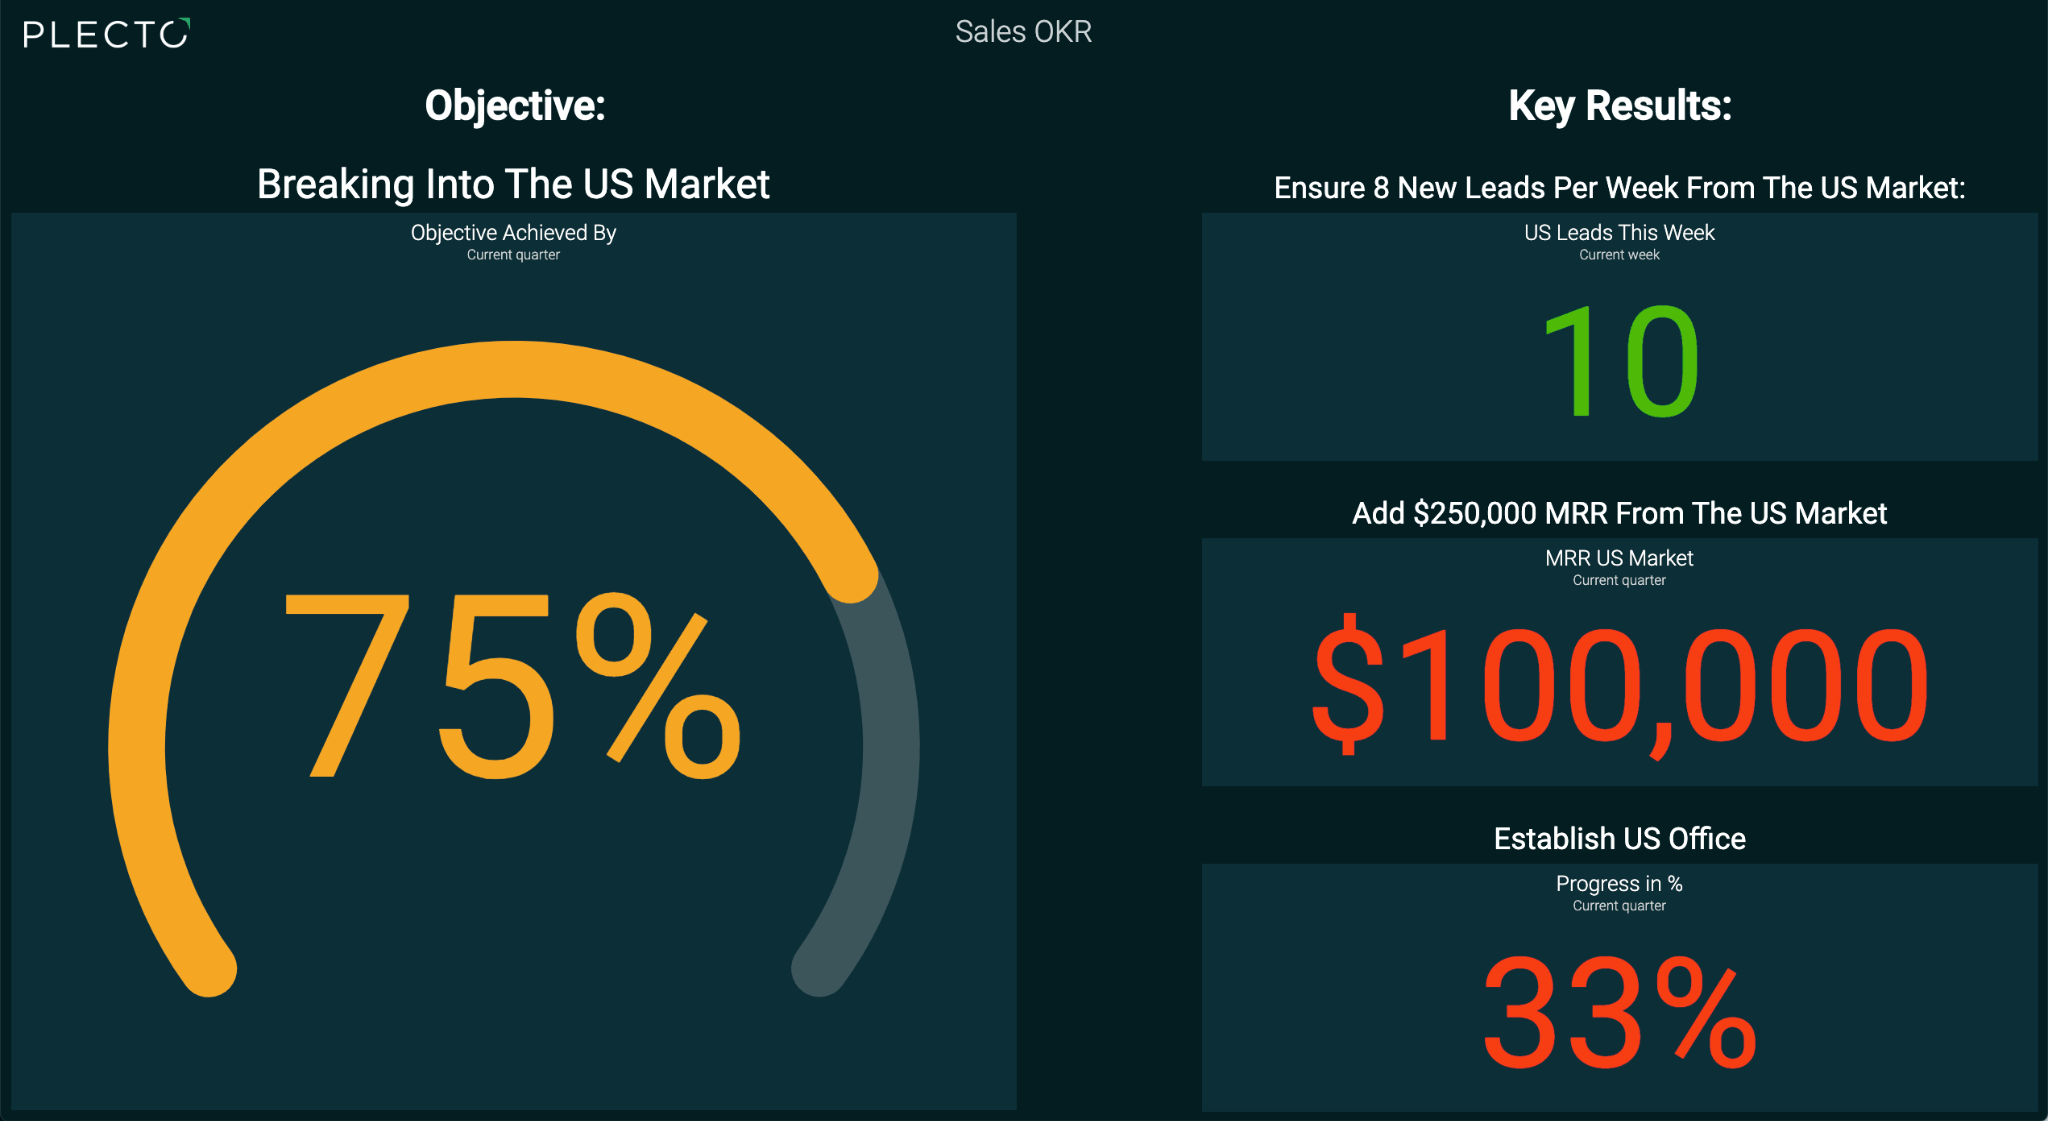
OKRs pair one broad qualitative objective with three to five quantitative key results. An objective of "deliver an exceptional customer experience" might carry key results of a Net Promoter Score of 50 and average ticket resolution under two hours. The structure is what connects an individual's week to a company-wide ambition.
Industry examples and standards
Different industries need different indicators, and some of them are formally specified.
In manufacturing, the ISO 22400-2 standard defines key performance indicators for operations management. The best known is Overall Equipment Effectiveness (OEE), which combines availability, performance, and quality into one measure of how efficiently a facility runs. Plant managers use it to find bottlenecks and cut machine downtime.
Real estate agencies track property turnover, agent activity, and client acquisition. Home Østerbro, a franchise of the Danish agency Home, runs its eleven employees on real estate dashboards and the mobile app. The wider Home network has 185 franchises, over 900 staff, and sells 40 billion DKK of property a year.

Retail businesses watch foot traffic, inventory turnover, and average transaction value. On a retail dashboard, those numbers let a store manager adjust staffing to the pattern in front of them rather than last month's report.
How poorly chosen indicators damage performance
Tracking the wrong number is often worse than tracking nothing. People optimize for whatever they are measured on, including when that harms the business.
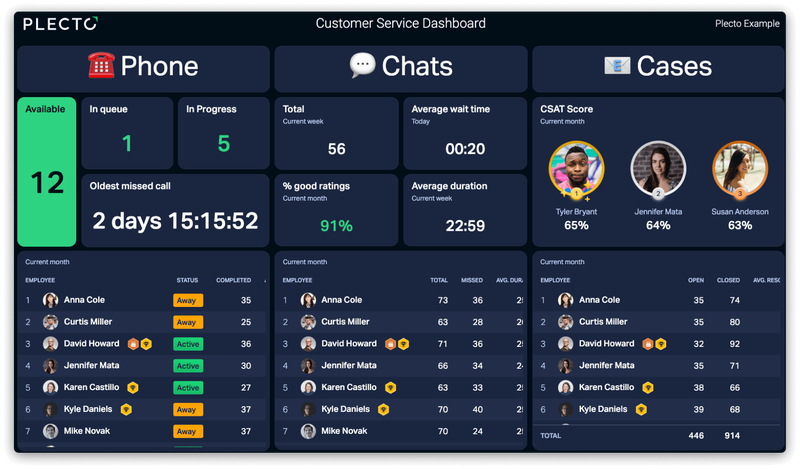
Take a support centre that tracks only Average Handle Time. Push agents to keep every call under three minutes and they will rush customers off the phone. AHT looks excellent on the wallboard while unresolved issues pile up and satisfaction falls. It is the classic anti-pattern: an operational metric promoted to a strategic indicator it was never built to be.
The Wells Fargo cross-selling scandal is the expensive version. Management set a quota of eight financial products per customer and tied it to job security and bonuses. Employees opened millions of unauthorized accounts to hit the number, and the bank paid billions in fines along with lasting reputational damage. The metric worked exactly as designed, which was the problem.
Pair every indicator with the outcome it is supposed to serve, and check periodically that the two still point the same way. We covered how to run that audit without disrupting the whole organization in when KPIs fail at scale.
Automating tracking with a performance platform
Manual spreadsheet updates introduce delay and error. By the time a manager has compiled the weekly report, the numbers describe a week that is already over.
Plecto integrates with 150+ business systems, including Salesforce, Zendesk, and Pipedrive, so several sources consolidate into one dashboard without custom code. Live data on TV displays around the office keeps the targets in front of people, and reports handle the automated exports for board meetings.
Visibility alone does not hold attention indefinitely. Gamification features such as automated notifications, real-time contests, and achievement badges keep the numbers worth looking at, and managers can run one-on-ones against the same live data instead of a recollection of the quarter.
The role of AI in next-generation goal setting
Artificial intelligence is starting to shape which indicators get set, not just analyze the ones you already have. Run over enough history, it can surface performance drivers nobody thought to measure and turn them into indicators worth putting in front of executives.
That means testing assumptions about profitability and efficiency against the data rather than inheriting them. It also means tooling that handles the calculation. Plecto's AI Formula Assistant writes advanced formulas from a plain description, and MCP support lets you build dashboards in conversation with Claude or ChatGPT.
Where to start
Pick three metrics that move revenue or retention. Build one dashboard that shows them daily, and put a monthly review in the calendar to check whether they still deserve the slot. That is a working KPI (key performance indicator) setup, and it beats twenty numbers nobody reviews.
Start your 14-day free trial or read how other teams set theirs up in our customer stories. The getting started guide walks through the first dashboard step by step.
Questions
KPI tracking FAQs
Three to five strategic indicators per department. More than that dilutes focus and makes it hard to tell which numbers matter. If you have twenty priorities, you have none.
It depends on the indicator. Operational data such as daily sales calls belongs on a real-time dashboard. Strategic indicators such as market share or customer retention get reviewed monthly or quarterly in a formal management meeting.
Yes, and they should. An indicator that was critical in the startup phase, such as raw user acquisition, often matters less than profitability or retention once the company matures. Audit the setup annually against current objectives.
A leading indicator measures activity that predicts a future result, such as pipeline value or training hours. A lagging indicator measures the result itself, such as closed revenue or defect rate. Manage the day on leading indicators; validate the strategy on lagging ones.
Start your 14-day free Plecto trial today.
Enjoyed the article? Share it:


