Everything You Need to Know About CPG Order Fulfillment

Most popular
4 Things That Slowly (But Surely) Mess Up Your Data
Is your dashboard lighting up while sales stay flat? Your data might be "correct" but completely misleading. Discover 4 silent factors that are messing up your business decisions before you notice.

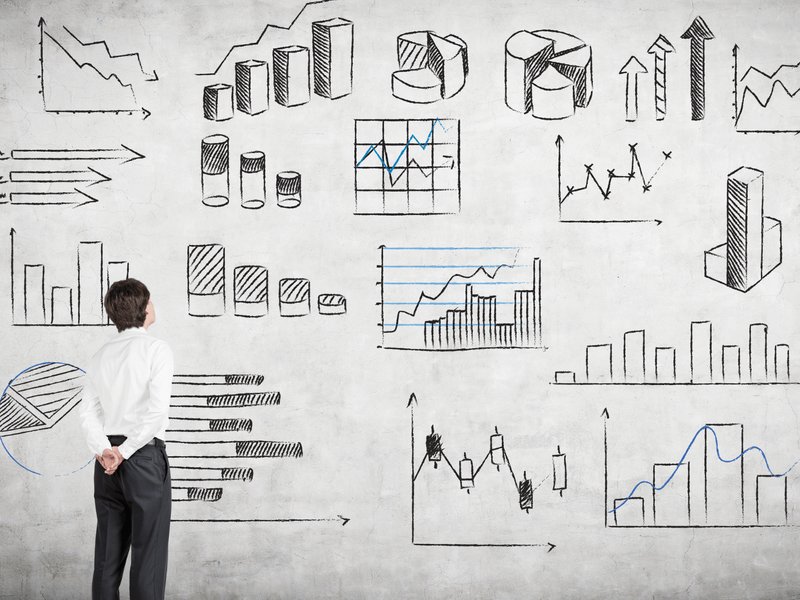
Why Data Visualization Matters: Science, Business, and Strategy
Why is data visualization so important? Explore the scientific, business, and strategic benefits of visualizing data—from faster brain processing to better employee coaching.

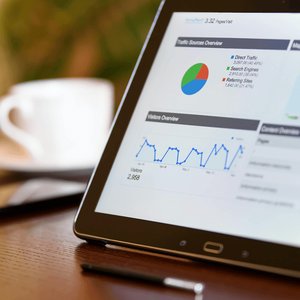
Unlock Your Database: How to Visualize SQL Data for Better Decisions
Don't let your data sit hidden in a database. Learn how to connect SQL sources to Plecto's real-time dashboards to boost team transparency, accountability, and performance.

4 Sports-Themed Sales Contest Ideas to Engage Your Team in 2026
Ready to skyrocket sales performance? Learn how to run high-energy, sports-themed contests that turn every deal into a touchdown. Perfect for Plecto users!

Step-by-Step Guide: How to Create a Fun and Engaging Contest
In this Step-by-Step Guide, you'll learn how to create fun and engaging Plecto contests for your team in no time!
The 15 Golden Rules of Dashboard Design
Transform your data into action. Discover the 15 golden rules of dashboard design to align your team, visualize KPIs, and boost performance at a single glance.
How to Analyze Data: A Beginner's Guide for 2026
Master the basics of data analysis. Learn the 6 essential steps to gathering, scrubbing, and interpreting data to reduce costs and outperform your competition in 2026.
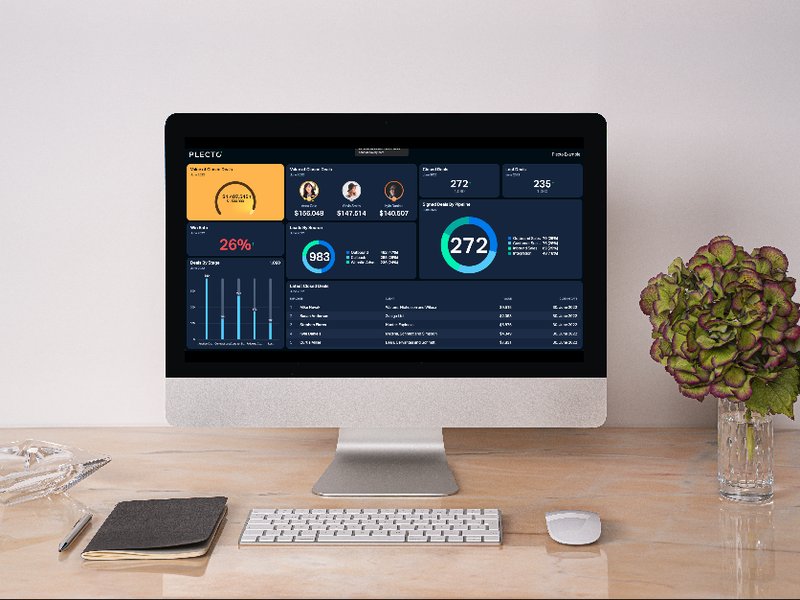
What Are Data Dashboards, and Why Should You Be Using Them?
Find out what a data dashboard is, what it can do for your business, and how to use dashboards to make the best decisions for your business.
The 3 Types of Dashboards You Need To Be Using
Learn the three mission-critical dashboard types, which ones you should choose, and how to get the most out of them in your company’s operations.
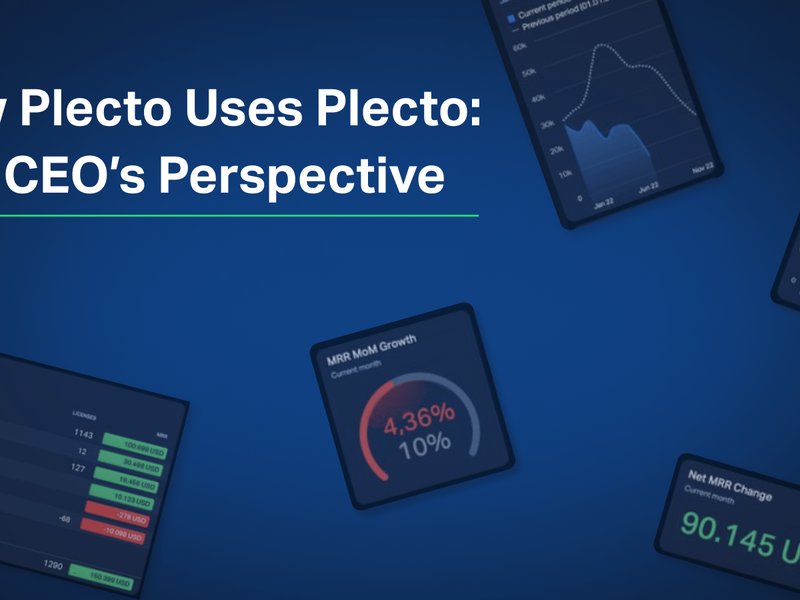
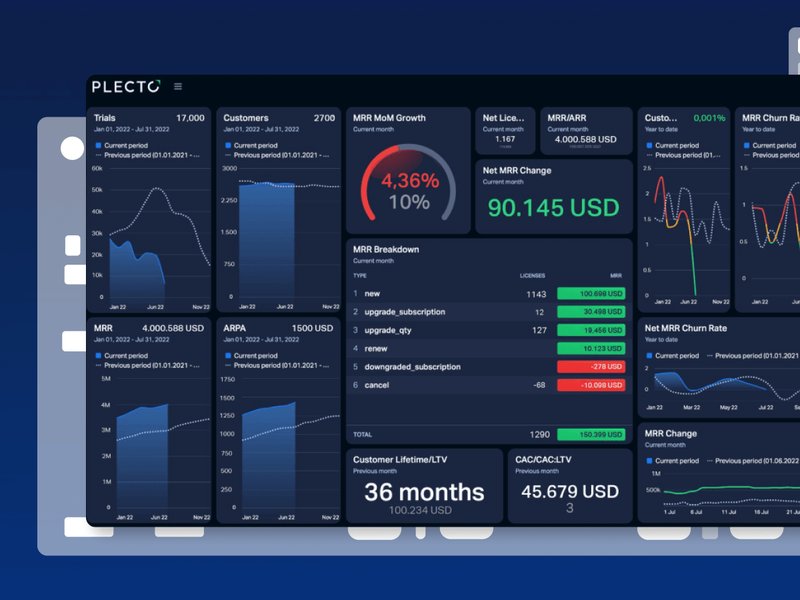
How Plecto Uses Plecto: The CEO's Perspective
Ever wonder how a SaaS CEO tracks performance? Kristian Øllegaard shares the exact KPIs, dashboards, and automated reports he uses to lead Plecto and manage investors.
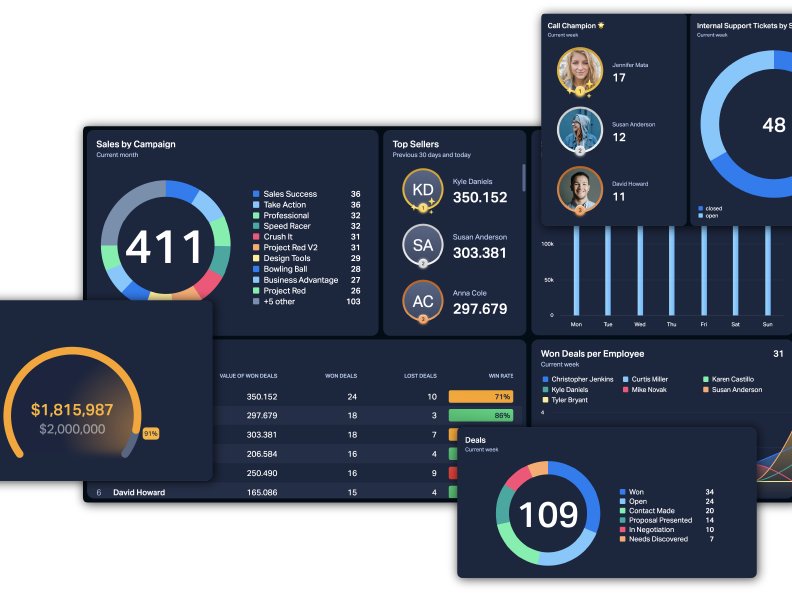
Business Dashboards 101: Definition, Types, and Top Benefits
Discover how visualizing data on dashboards automates reporting, improves decision-making, and motivates teams. Learn about KPI, Project, and Executive dashboards here.