Everything You Need to Know About CPG Order Fulfillment

Most popular
4 Things That Slowly (But Surely) Mess Up Your Data
Is your dashboard lighting up while sales stay flat? Your data might be "correct" but completely misleading. Discover 4 silent factors that are messing up your business decisions before you notice.

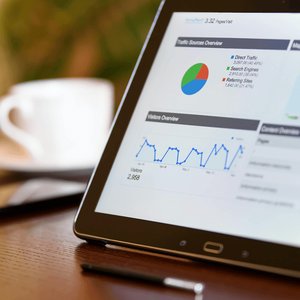
Why Data Visualization Matters: Science, Business, and Strategy
Why is data visualization so important? Explore the scientific, business, and strategic benefits of visualizing data—from faster brain processing to better employee coaching.

Unlock Your Database: How to Visualize SQL Data for Better Decisions
Don't let your data sit hidden in a database. Learn how to connect SQL sources to Plecto's real-time dashboards to boost team transparency, accountability, and performance.
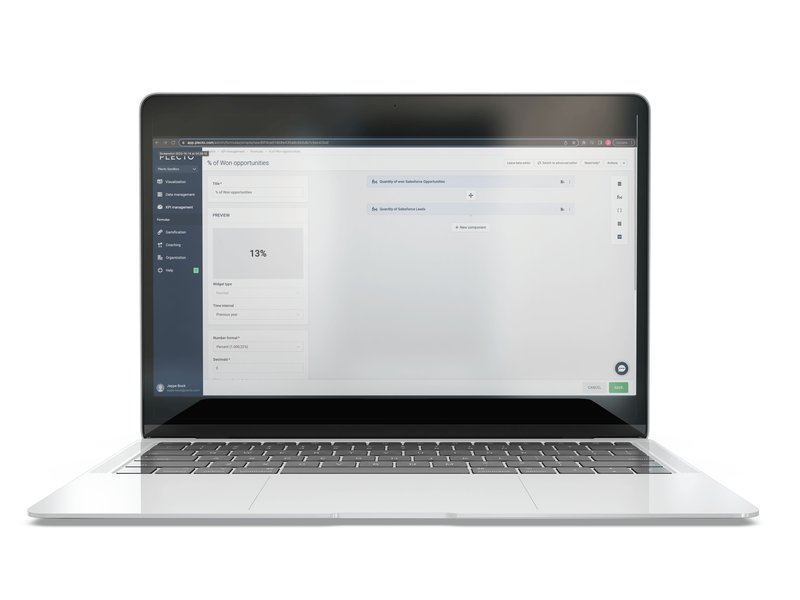
Step-by-Step Guide: How to Create Custom Metrics in Plecto
Discover how to create and customize specialized metrics in Plecto in this easy step-by-step walkthrough.
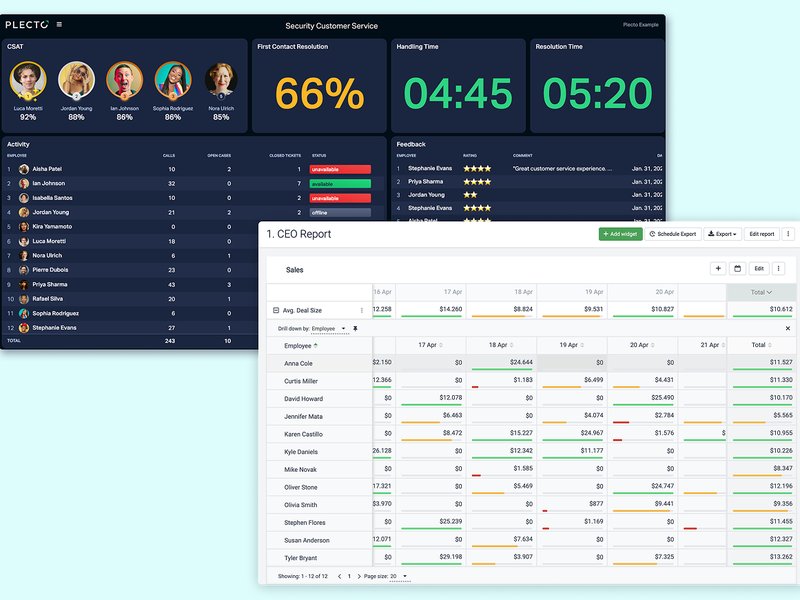
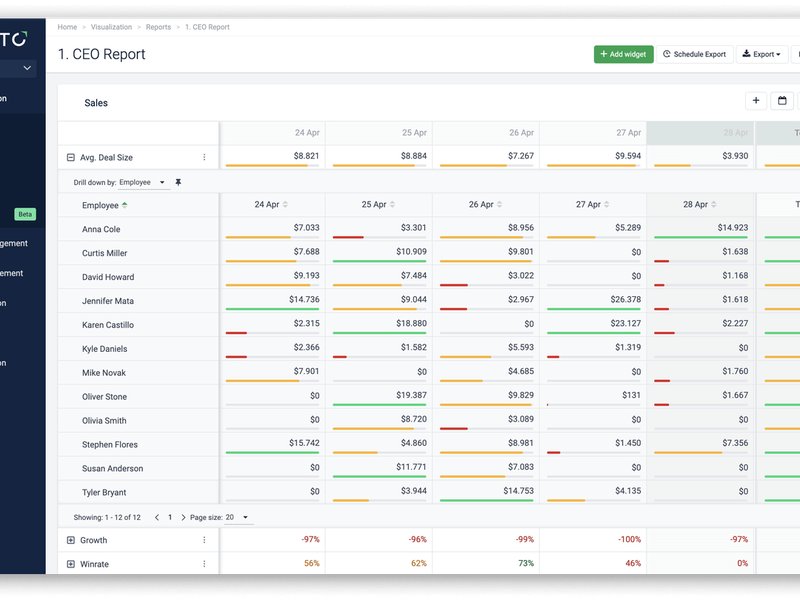
Dashboards vs. Reports: Key Differences Explained
Dashboards and reports are two crucial features for understanding your business data. Learn here about their differences and similarities, and how to leverage both for maximal eff…
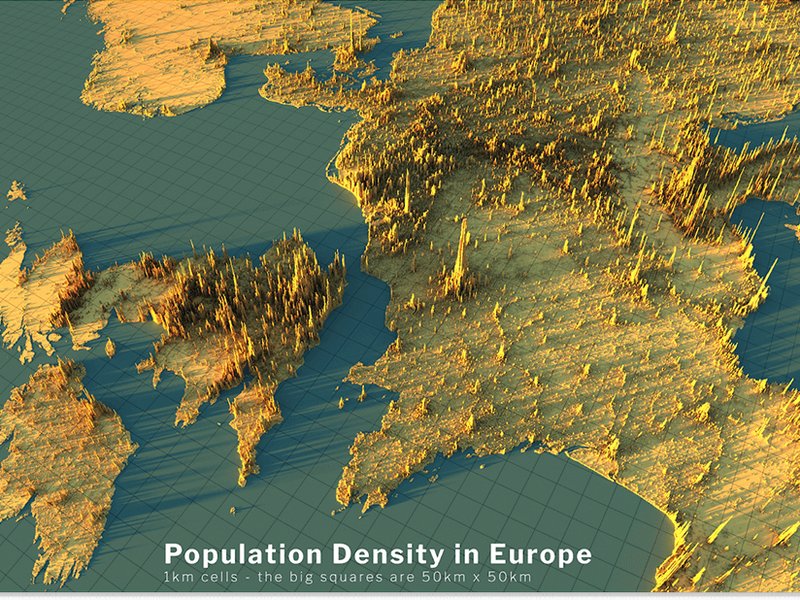
5 Examples of the Best Data Visualizations
What makes a data visualization truly "great"? Explore 5 world-class examples—from 3D terrain maps to interactive federal budgets—that turn complex data into visual masterpieces.
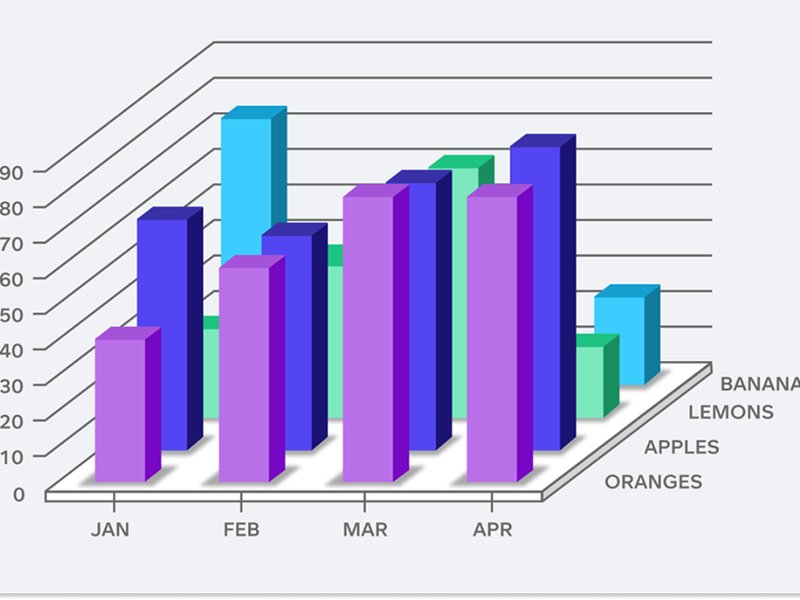
6 Examples of Bad Data Visualizations
We break down six examples of poor-quality data visualizations, looking at what makes them bad and how they can be improved for clearer, more effective data storytelling.

6 of the Biggest Data Visualization Trends of 2025
Explore 6 top data visualization trends of 2025—including real-time dashboards, AI-driven insights, and mobile-first design—that enhance business competitiveness and decision-maki…

How to Visualize Data for Actionable Insights in 2026
Did you know 90% of information sent to the brain is visual? Master the art of data visualization to uncover hidden trends, empower your team, and drive smarter business decisions.

Top 10 Dashboard Solutions for Businesses: A Comprehensive Guide
Discover the top 10 dashboard solutions for businesses in this guide, featuring key features, pricing, and strengths to help you choose the perfect platform for your data needs.
Step-by-Step Guide: How to Create an Automatic Report in 2026
Still writing reports by hand? Discover how automated reporting saves hours of manual work and delivers real-time KPI insights straight to your inbox.