data visualization_3 articles
Gamification: Align Employee Behavior with Company Goals
Learn how gamification aligns employee behavior with company goals using real-time feedback and rewards to boost engagement and performance.
Most popular

Everything You Need to Know About CPG Order Fulfillment
4 Things That Slowly (But Surely) Mess Up Your Data
Is your dashboard lighting up while sales stay flat? Your data might be "correct" but completely misleading. Discover 4 silent factors that are messing up your business decisions before you notice.

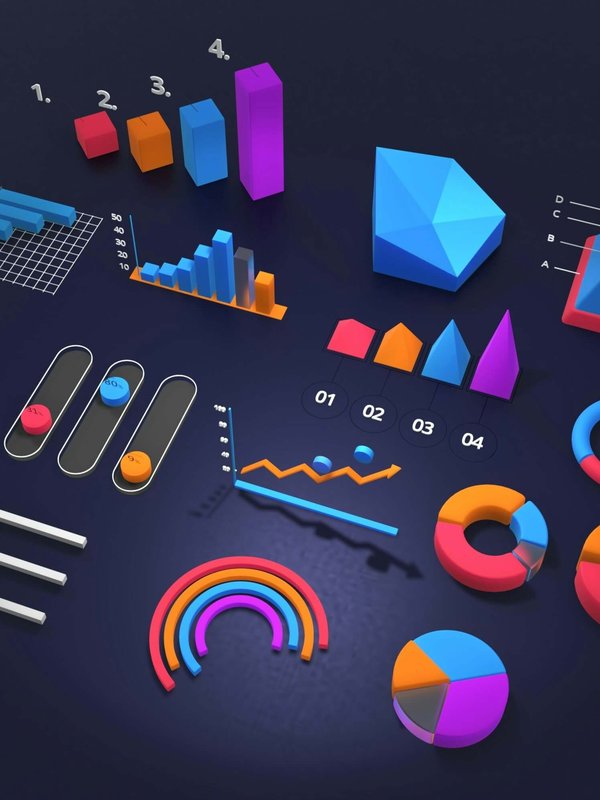
Why Data Visualization Matters: Science, Business, and Strategy
Why is data visualization so important? Explore the scientific, business, and strategic benefits of visualizing data—from faster brain processing to better employee coaching.
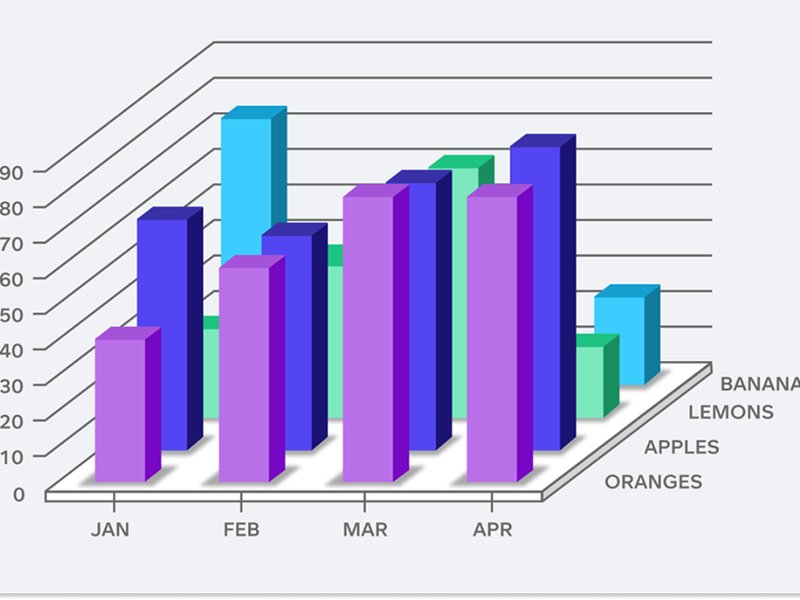
6 Examples of Bad Data Visualizations
We break down six examples of poor-quality data visualizations, looking at what makes them bad and how they can be improved for clearer, more effective data storytelling.

6 of the Biggest Data Visualization Trends of 2025
Explore 6 top data visualization trends of 2025—including real-time dashboards, AI-driven insights, and mobile-first design—that enhance business competitiveness and decision-maki…

How to Visualize Data for Actionable Insights in 2026
Did you know 90% of information sent to the brain is visual? Master the art of data visualization to uncover hidden trends, empower your team, and drive smarter business decisions.
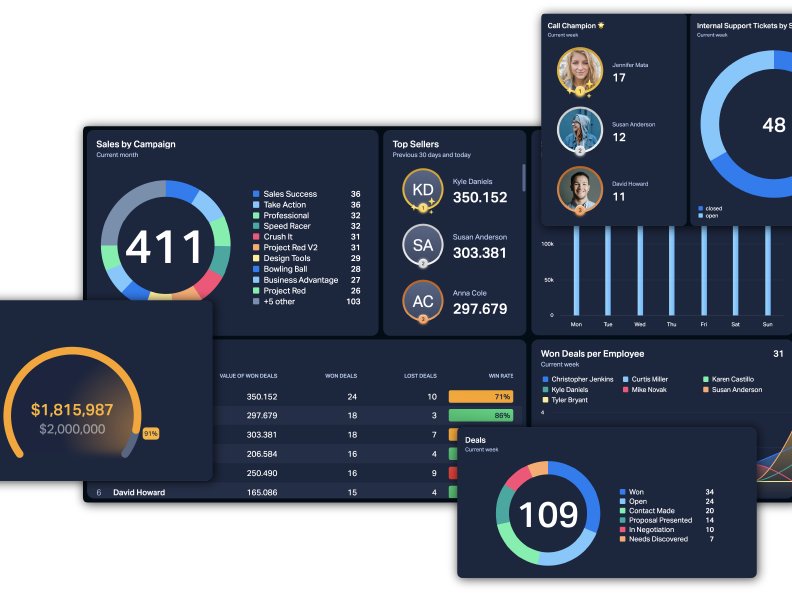
What Are Data Dashboards, and Why Should You Be Using Them?
Find out what a data dashboard is, what it can do for your business, and how to use dashboards to make the best decisions for your business.