
Table of contents:
How to Easily Measure Metrics in Plecto
Milestones, long-term goals, short-term objectives, ongoing KPIs… It’s not about what to measure, it’s more about the how. And you’re very close to discovering how easy it is to track whatever KPI you need in Plecto, by creating simple formulas - in a matter of minutes.
We’ve had our awesome Support team creating a step-by-step guide, on how to create simple formulas on Plecto. With this DIY guide, you can easily get started with your dashboards in no time.
Let’s get started!
Simple Formulas in Plecto
Formulas are a plain text representation of how a certain result is calculated and are a crucial part of the Plecto user experience.
These formulas will take the data from the data sources, and convert it into the metrics that will be shown on the dashboard. For that, they take registrations (explained below) from the data source, and calculate a result according to the values set when creating the formula. The result is then shown on the dashboard, through our variety of widgets. The chart below illustrates the process:
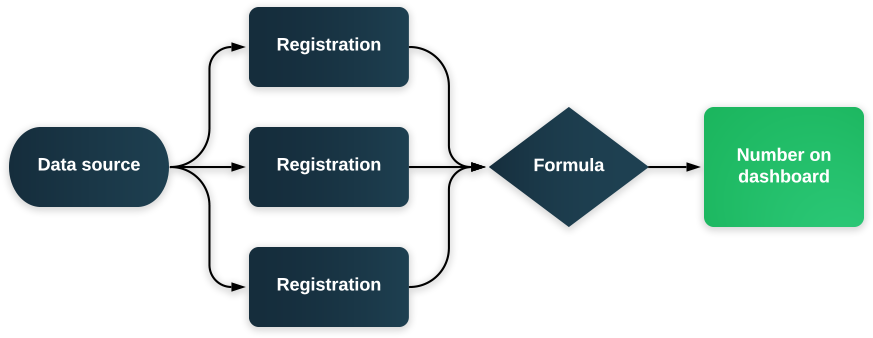
What is a registration? Just like in a spreadsheet, registrations are the rows in a table, and their fields are the columns. The table below represents three registrations:
If you’re wondering, these are the steps the formula goes through to calculate a result:
- Choose a data source
- Narrow down which registrations to include from that data source
- Choose the registration fields to look at
- Calculate the result from the values of the registrations’ fields, i.e. sum them
How to Create a Formula
In Plecto, you can create a formula on our formula-page, located in the sidebar, under “KPI Management” > “Formulas." From this page, you can follow these steps to create a formula:
- Click on “New formula”, in the top right corner
- Select the “Simple editor” (if you want the advanced editor, read more here)
- Give your formula a title that describes its purpose. This also helps keep an organized and well-structured list of formulas.
- Click on the “+” symbol on the grey button, to add a function
- Selection the function you want to use in the formula (read more about it down below this guide)
- Select the data source you want to import data from, and the fields you’d like to subtract, sum, etc. (if any)
- Press “Save” at the bottom-right corner
And your formula is now done!
Customizing Your Formulas
Functions
You can use the following functions when creating a formula:
- Quantity: Counts the number of registrations in a data source
- Unique values: Counts the number of registrations with a unique value in a specific field
- Sum: Sums the values of a field in a data source
- First: Returns the first value of a field in a data source based on the registration date
- Last: Returns the last value of a field in a data source based on the registration date
- Min: Returns the lowest value of a field in a data source
- Max: Returns the highest value of a field in a data source
- Average: Returns the average of all values in the field you select
You can read more about the available functions in our support article Lookup Functions.
Formatting
There are many ways of formatting a formula, and each of them alters the way a formula is calculated and displayed on the dashboard.
You can change the formatting when creating or editing a formula under “Number formatting."
It is also possible to display the number of decimals the formula should display on the dashboard from the same place.
For instance, using the format “Text”, you can write a title for your calculation. Same happens with the date-format when you select “Won date”, so the formula will output the date of the latest won deal.
Filters
Filters are very useful to custom the exact data that you want to use. You can add filters to your data sources by clicking on “Add filter”, and choosing the field and value you wish to filter.
You can, for instance, create the “OR” filter for all your won or lost deals. For that, you should create one function for Won Deals, and another one for Lost Deals, and then add them together with the “+” symbol.
It’s case-sensitive, which means you should type the filter exactly as the values are displayed in the chosen data source.
Extra tip: The simple editor allows up to three filters per function. To add more, you can use the advanced formula editor.
Making Calculations
The formula editor allows you to do calculations in your functions, from adding, subtracting, dividing, and multiplying, to more complex calculations, depending on your needs.
Time Periods in Formulas
Actually, time periods are not defined in the formula itself, but on the widget you’ll use to display it on the dashboard. This way, one same formula can be used on multiple widgets, for different time periods, so you don’t have to create a new formula every time.
You can add a formula to a widget by following the steps:
- Go to the dashboard you would like to add the formula on
- Add a widget
- Select the formula you would like to use
- Click on “Time period” in the settings of the widget, and select the time period you would like to use on the widget
- Click “Save.”
Example Formulas
You can use the below formula examples for inspiration! And please, don’t hesitate to reach out to our support team if you have any questions!
Conversion Rate (%)
This formula will divide the number of Won Deals by the total number of deals to return the Conversion Rate of Won Deals. The format of the formula should be set to “Percent” for this formula to work properly.
“OR” Filters
In this case, we’ve set the formula to show the state of Intercom Conversations, that it will either be “open” or “snoozed”.
Revenue
This formula, for instance, is an example of how to return the revenue from different data sources (integrations) in a combined output.
You can also add a prefix/suffix to the formula according to the currency being used.
Start your 14-day
free Plecto trial today.
MORTEN KAAE
Solution Architect