Step-by-Step Guide: How to Create an Automatic Report in 2026
Why Businesses Need Automated Reporting
How much time do you spend writing your reports? And how many different reports do you usually need?
We know that writing reports can be very time consuming and monotonous, and that’s just one of the many other tasks that a manager has to deal with regularly. Wouldn’t it be great to free some time by automatizing your tasks?
That’s what we asked ourselves in Plecto. And no, we can’t have the meetings for you yet.
But we can certainly provide you with the most updated data you need for each of your stakeholders – in no time! How? Creating reports automatically with the most relevant KPIs and metrics every time, and sending them to your inbox when you need them.
What is a Report?
Simply put, a report in Plecto is an alternative option to dashboards and slideshows for displaying your data. Furthermore, it allows a bigger combination of data and, afterwards, it can be exported to Excel or PowerPoint format.
What makes it so easy to create is that the reports use the same formulas and KPIs that you are already using for your dashboards, so you don’t have to create them every time. Instead, every formula and KPI is updated automatically wherever you are using it!
This means that whenever a metric updates, it will show in every dashboard or report using it, in real-time.
If this sounds easy, wait to see the step-by-step guide on how to create an automatic report!
How to Create an Automatic Report
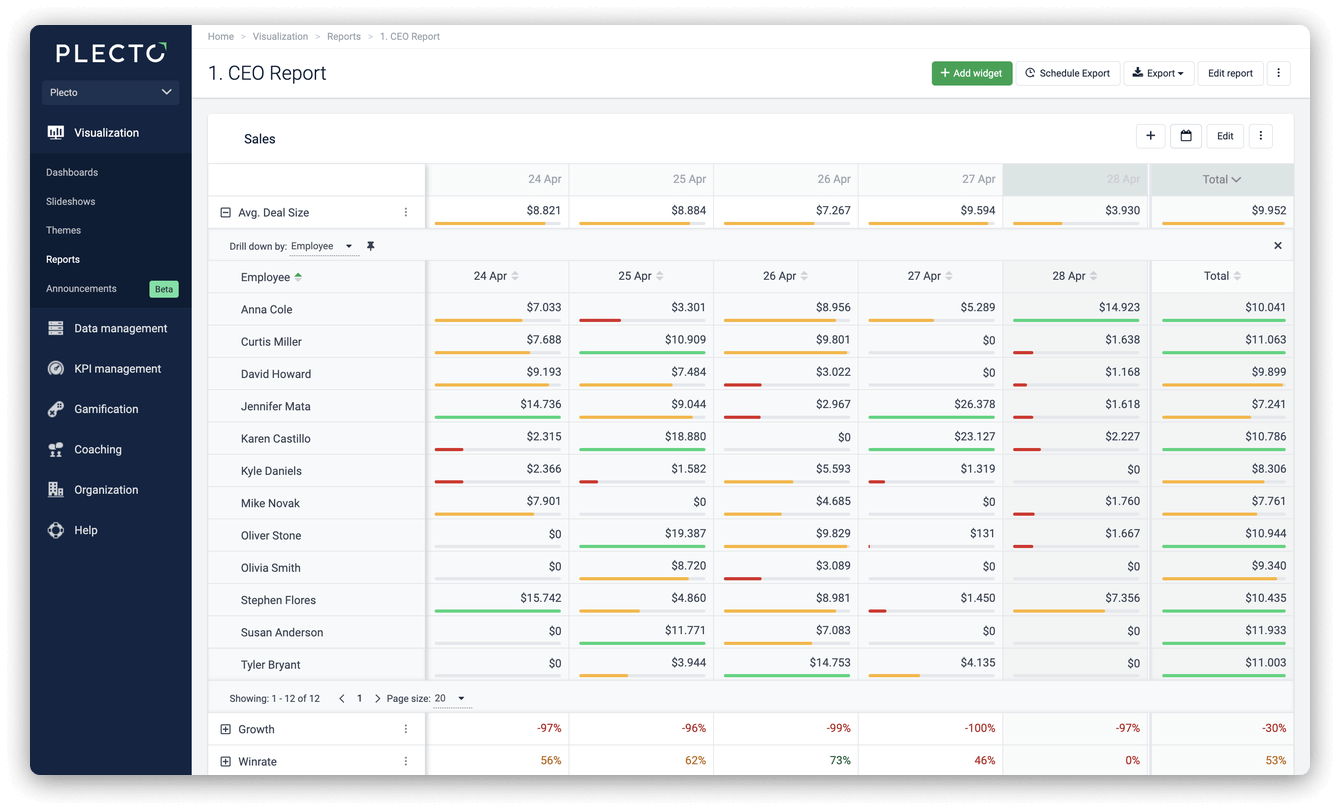
- First, you can get started by clicking on ‘Reports’, under the ‘Visualization’ section on the left sidebar.
- After selecting ‘+ New Report’, in the top-right corner, you should include Title, Available for (the employees or teams that will be able to see the report), and Show data for (the type of data that should be included).
- After selecting ‘Confirm,' your report is created.
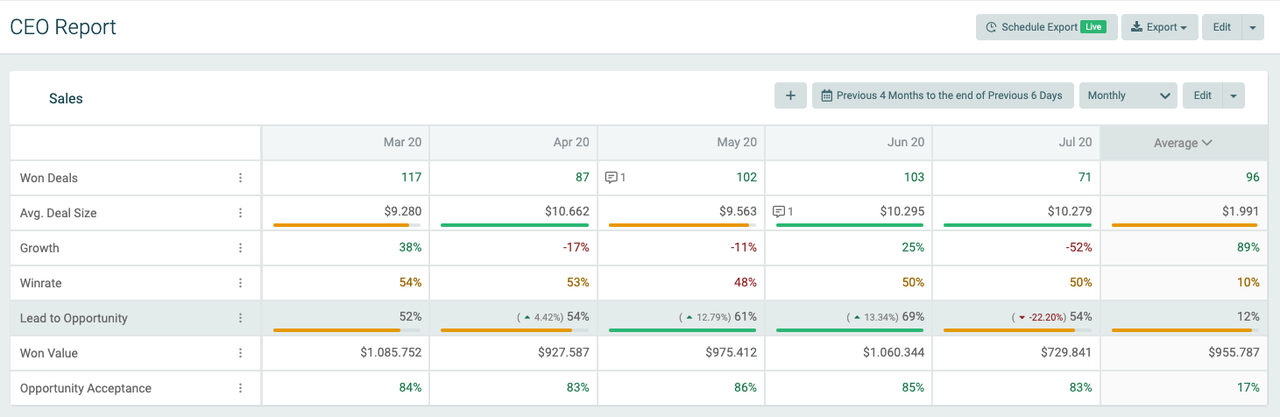
- You can create as many reports as you need, as well as include as many KPIs as relevant in each of them.
- And now, your KPIs will update automatically so that you have your latest data at all times, at just a glance!
- But that’s not all. One of the benefits of using reports in Plecto is the exporting option. Yes, you can easily receive the reports done in your inbox by just deciding the frequency and format.
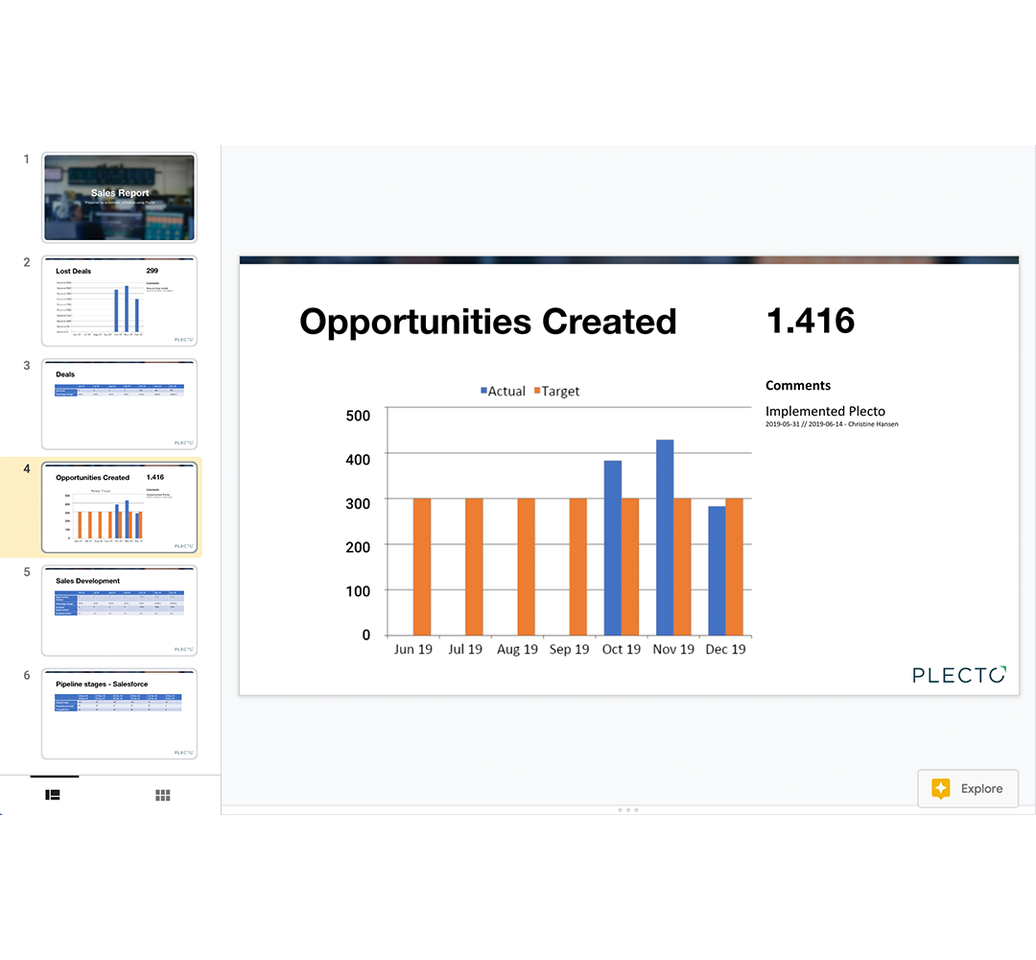
- By selecting ‘Export’ in the top-right corner of the report, you can choose to export it into an Excel (.xlsx) and/or a PowerPoint (.pptx) format. Easy!
Moreover, you can decide when you want to receive a specific report if, for instance, you have regular meetings that you need data for. In this case, you can schedule the report to be sent daily, weekly or monthly - when you need it!
Visualizing KPIs in Your Reports
We are constantly working on improving your experience in Plecto, from the dashboard to the gamification and reporting options. And recently, we have scaled up our ‘Report’ funcion to make it even more useful for you and your business.
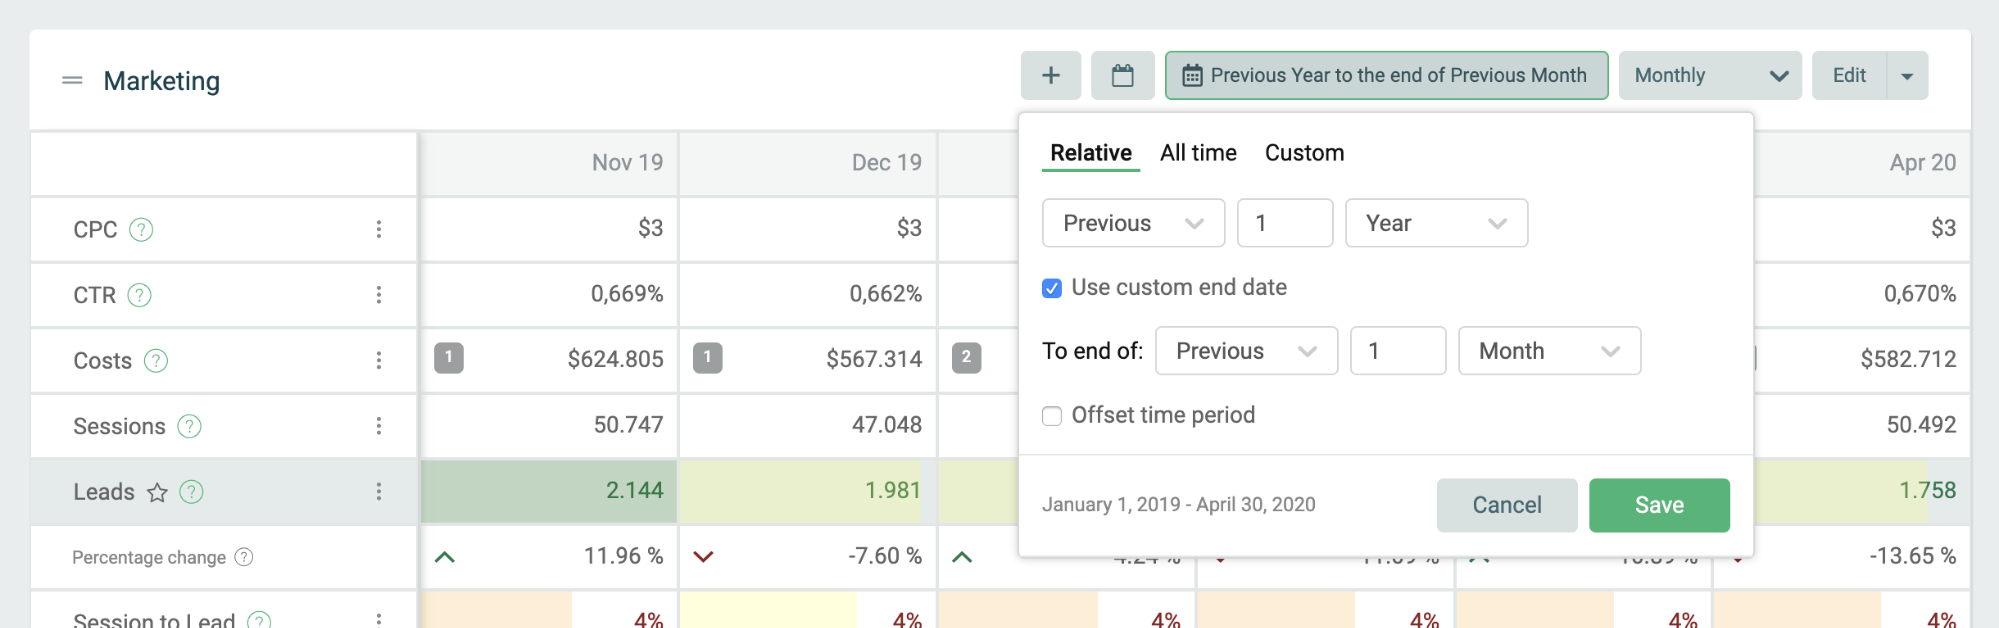
For instance, we recently included the option of customizing the time period for each report. This enables you to focus the KPIs in each report on the time span that it’s most convenient for your meetings.
This new custom period also allows you to compare your current situation with a KPI to its historic data or future forecasts - which enables you to make more accurate data-driven decisions for all areas of your business.
NOTE: The ‘Automatic Reports’ function is only available for users with the Large or Enterprise plan.
Start your 14-day free Plecto trial today.
Enjoyed the article? Share it:
NATALIA TOBAJAS