Table of contents:
How to Use Social Media Metrics Successfully
While most companies have a social media presence, many don’t track social media metrics – or they track vanity metrics that look great on paper but don’t deliver any real business value. Having a big social media following might be impressive at face value, but those followers won’t help your company reach its business goals unless they’re buying from, promoting, or otherwise contributing to its bottom line.
This article will help demystify social media metrics by answering the question, “What are social media KPIs?” while exploring and suggesting how to choose and track the social media KPIs that will make a difference in your business.
What Are Social Media KPIs?
Let’s start by answering an important question – what are social media KPIs?
Social media KPIs or “key performance indicators” measure how well your company’s social media presence is performing on each of its platforms. Choosing the right mix of social media KPIs can help you calculate ROI, and ascertain things like which types of content perform well, and whether your social media strategy is working.
To derive business value from your social media metrics, it’s critical to avoid tracking vanity metrics. The following four categories of social media KPIs are a strong starting point that will deliver actionable insights that can help shape an effective social media strategy:
- Reach
- Engagement
- Web traffic
- Conversions
The 4 Categories of Social Media Metrics That Matter
As with most metrics-tracking endeavors, you should start by defining the business goals you’d like your efforts to support. This approach will help steer you away from vanity metrics by focusing your attention on your business goals instead of arbitrary numbers that don’t deliver any real business value.
Let’s take a closer look at how social media metrics within the four categories mentioned above can help you achieve your business goals.
Category 1: Reach
Creating high-quality content is time-consuming and expensive – and it only provides business value if people see it. Reach is one of the most commonly tracked social media metrics, and it’s a fantastic starting point.
It can tell you how many unique users have seen each of your company’s social media posts and the total number of impressions, including repeat views. A high number of impressions is a clue that you’ve created a particularly engaging piece of content, which could be the key to unlocking more of the same magic!
To identify the types of content your audience likes to engage with, measure your average reach/impressions alongside the same metrics for each piece of content you publish. Tracking the reach percentage among both your followers and non-followers can provide useful insights into whether your content is being shared, and which types of content perform best in each platform’s algorithms.
Category 2: Engagement
It doesn’t matter how many social media followers your company has. If they’re not interacting with your content, they’re not providing any business value. Engagement metrics measure the effectiveness of your brand campaigns and the extent to which your followers are engaged in liking, sharing, or commenting on your content.
Keeping tabs on engagement rates for individual posts is another way to identify which types of content are resonating with your followers. While likes, comments, and shares aren’t directly tied to revenue, all of these interactions increase your company’s visibility on social media, which can result in an indirect revenue boost. They can also indicate an engaged following, which could mean word-of-mouth recommendations and a high net promoter score.
When evaluating engagement rates, consider the content type. For example, a high number of likes on a stunning product image could be considered a success, whereas a post with a text-based call to action that got a similar number of likes but few comments, shares, or click-throughs could indicate that your graphic design is on-point but your content writing could use some work. These types of insights can help shape your content strategy and tone of voice, and help you spend your social media budget most effectively.

Category 3: Web Traffic
Aside from a sense of duty to keep up with the times, driving website traffic – and ultimately revenue – are the main reasons most companies are active on social media. If your company’s social media strategy is driving the reach and engagement discussed above, then web traffic and sales shouldn’t be far behind.
These five social media KPIs are a solid starting point for getting a handle on how your company’s social media activity is affecting its web traffic:
- Sessions – The number of times users visit your website via a social media link.
- First-time visitors – The number of visitors who visited your website via a social media link for the first time. Strong numbers could indicate that your content is getting good engagement, which is boosting its visibility organically – or that your paid campaign is working.
- Pages per session – The average number of pages a visitor browses during their visit to your website. Driving users to your website is only half the battle. The longer they stay, the more likely they are to convert.
- Bounce rate – The percentage of users who click through to your website, but then leave without visiting another page. A high bounce rate could indicate technical issues or that your messaging is off and people aren’t finding what they expected.
Category 4: Conversions
These are the money metrics! Keeping a close eye on these two conversion-related metrics will fill in a lot of the blanks around how your social media content is affecting revenue.
- Conversion Rate – Compares the number of users who clicked through to your company’s website and subsequently bought a product or completed the intended task (e.g., requested more information or subscribed to a newsletter). For the most in-depth picture, track this social media metric overall, by platform, and per individual post.
- Cost per Conversion (CPC) – If you’re using sponsored posts and/or high-budget content, it’s especially important to keep an eye on how much each conversion is costing you compared to how much revenue it’s generating. Looking at this in tandem with your engagement and web traffic metrics can help you gauge whether your budget might be better spent on content creation vs. content promotion.
Use Dashboards and a Social Media Metrics Tracker
Tracking your company’s social media metrics means that you’re proactively tracking the effects of specific content strategy components. Make sure to get the most out of your efforts by tracking a manageable number of metrics that drive customer behaviors that will result in revenue.
The best way to get started is to choose a handful of social media KPIs from the examples we’ve given above. Social media platforms generally include a social media metrics tracker or related tools to help you keep tabs on your efforts.
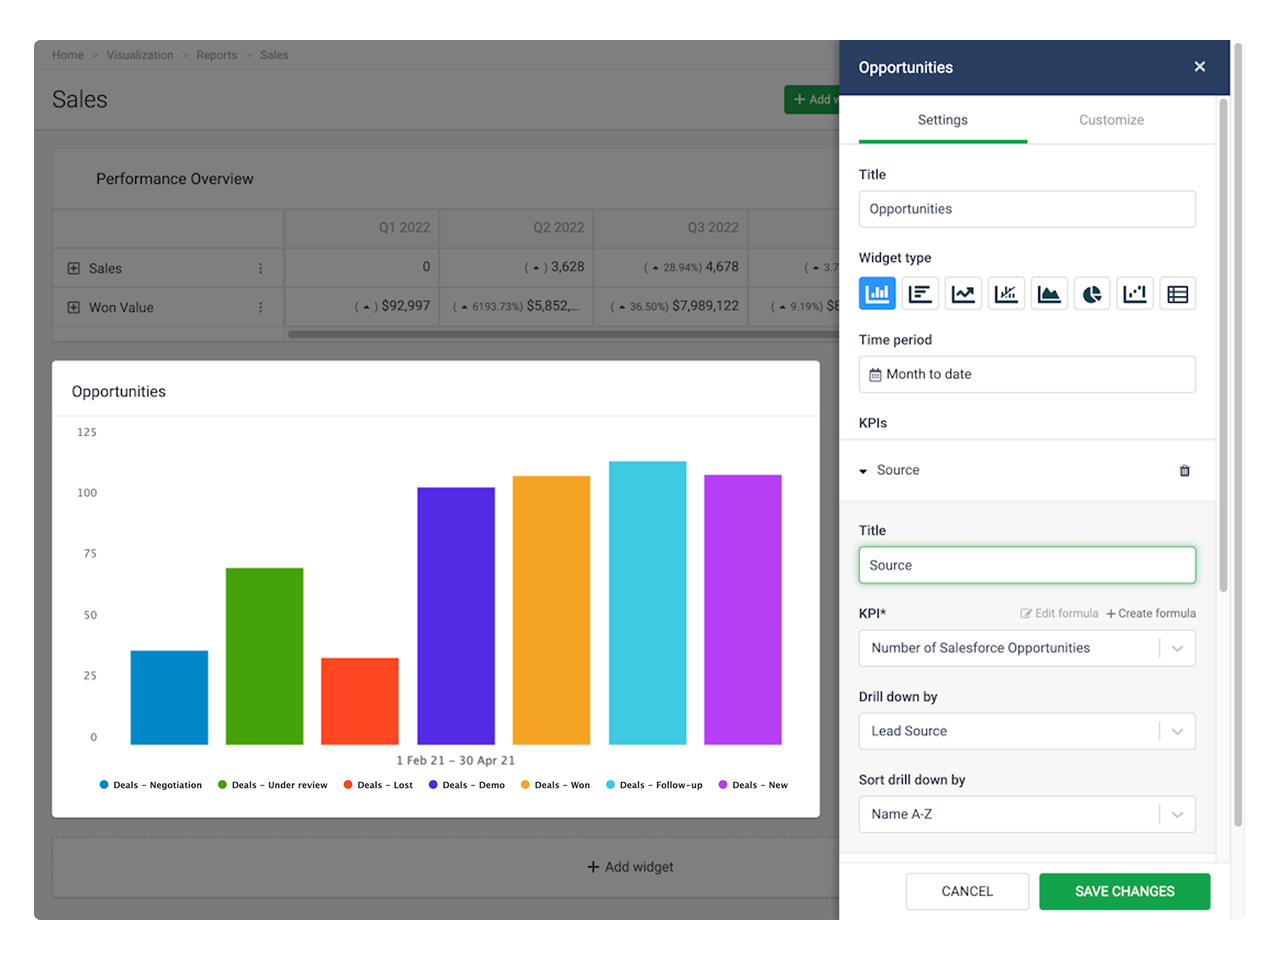
Using a social media metrics tracker in tandem with Plecto can enable you to schedule and generate automatic reports using real-time data to help you keep track of how your social media strategy is performing.
In addition, Plecto’s real-time dashboards make it easy to get an on-demand overview of your social media metrics. If you’re new to dashboards, you might want to read our blog post about the benefits of using dashboards for your business.
Sign up for a free demo of Plecto and start using social media to your fullest advantage!
Start your 14-day
free Plecto trial today.
SAGE CRAWFORD
Content Manager