Table of contents:
Why You Should Create Engaging Visual Content
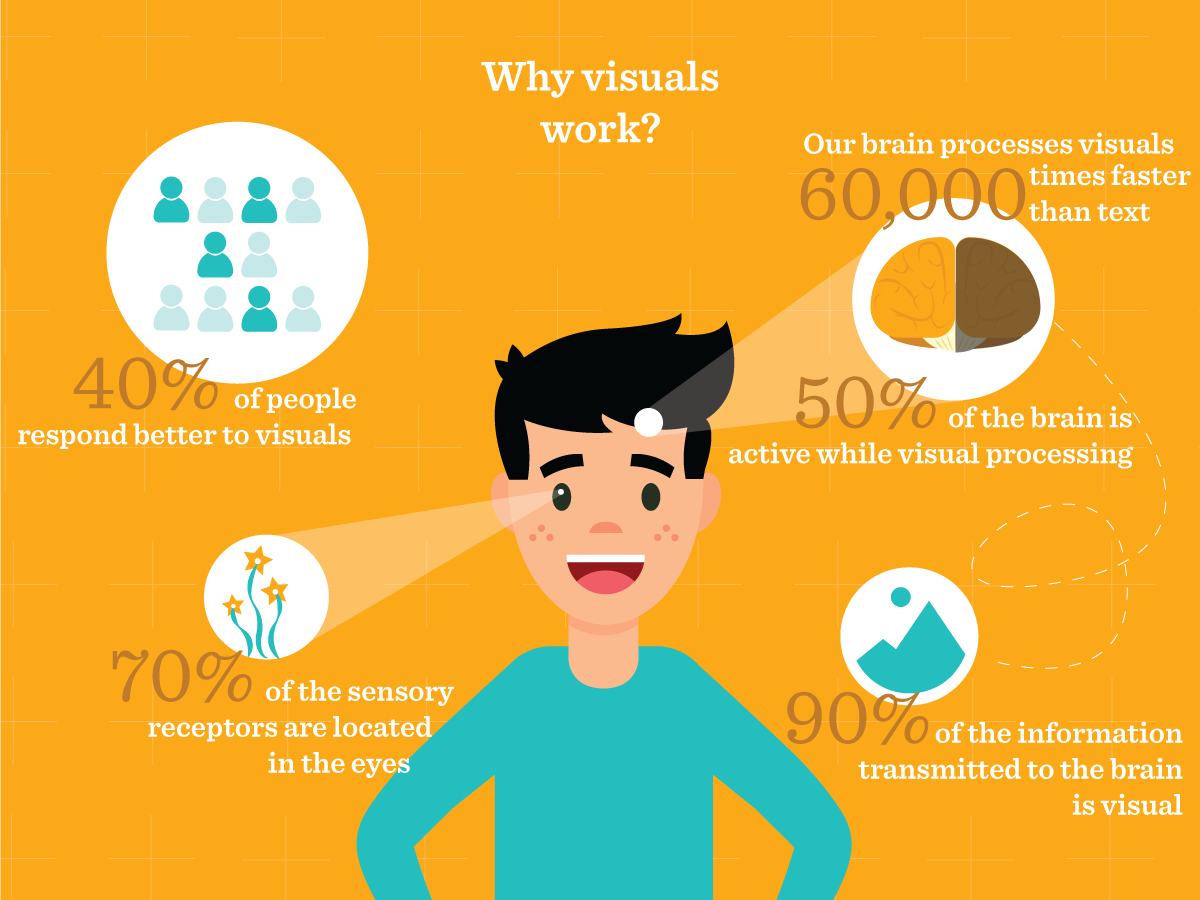
The Power of Visuals
Visuals are more important than ever before. In a world where we're constantly overwhelmed with text and receive five times as much information every day as we did just 30 years ago, most of us hunger for different ways of perceiving this information.
The brain processes visuals 60,000 times faster than text. Visuals are a way of getting people’s attention quickly and effectively, regardless of the message.
Whether you are a private person, a blogger, or representing a big company, visualization is crucial when it comes to engagement. As Frank Niles says in HuffPost: “When we visualize our desired outcome, we begin to see the possibility of achieving it.”
Why High-Performing Content Matters
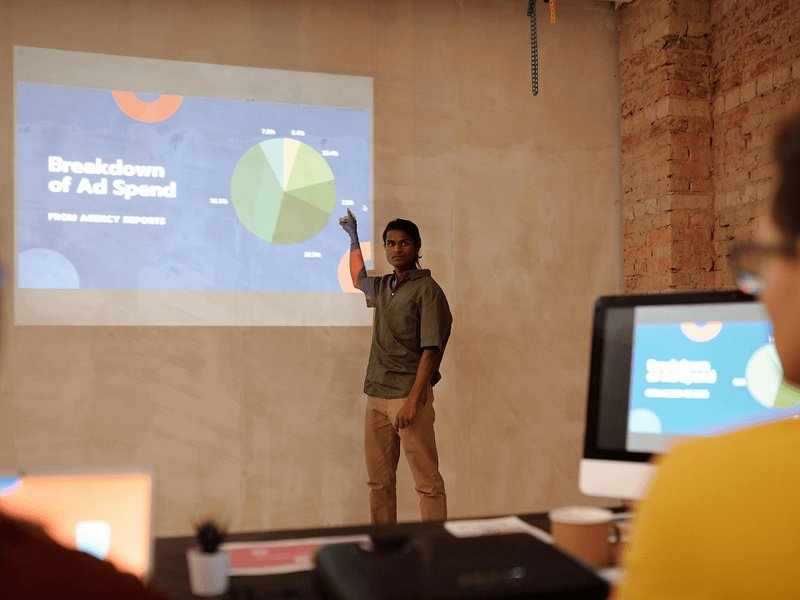
Across departments and industries, performance culture is becoming a crucial part of our everyday life. Companies are starting to understand that data-driven decisions make for increased performance.
Let’s take performance on social media as an example. 80% of marketers use visual assets in their social media marketing which is easy to understand when you look at the statistics. While only 10% can recall what they’ve read three days back, 65% can recall visual content.
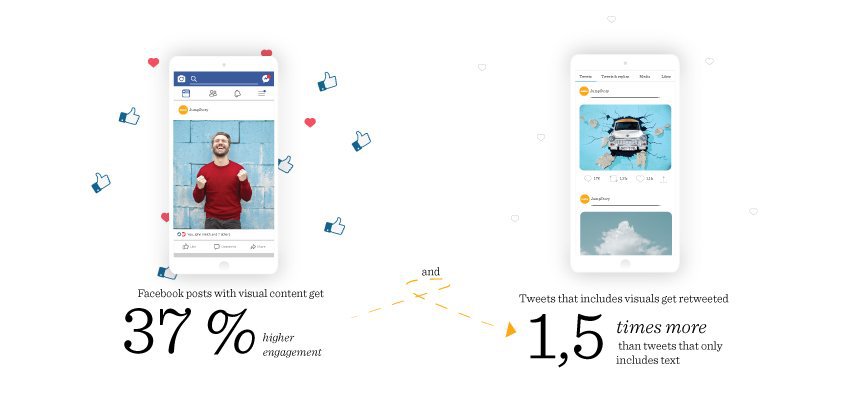
On Facebook posts with visual content get 37% higher engagement, and Tweets that include visuals get retweeted 1.5 times more than tweets that only contain text; this clearly indicates that if you want your company to be top of mind you need to use visual content.
Thanks to platforms like JumpStory, it is cheap, time-efficient and simple to download unlimited numbers of photos with cleared copyrights to boost the visual effort within your company.
Even when it comes to content such as blogs and case studies that originally holds long texts, visuals are becoming key to increase engagement. Let’s take this article as an example; we have included visuals because we know that articles with images get 94 % more views.
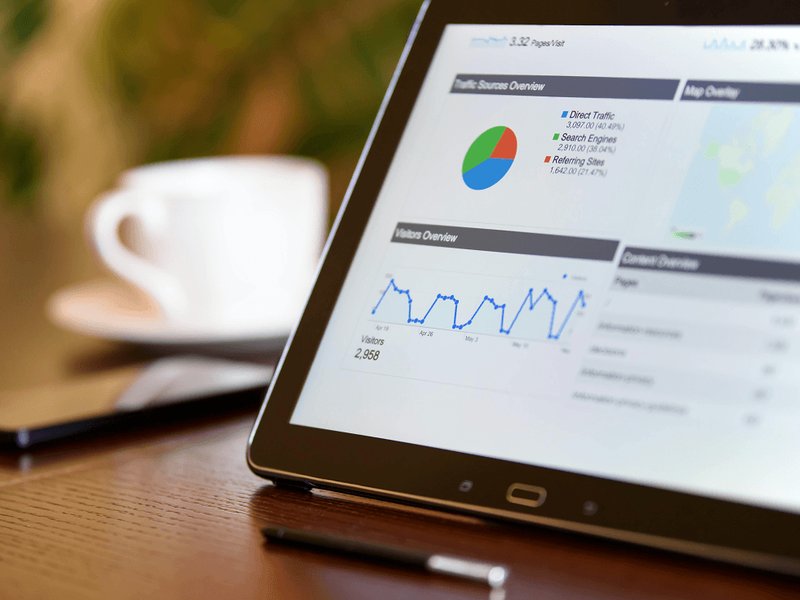
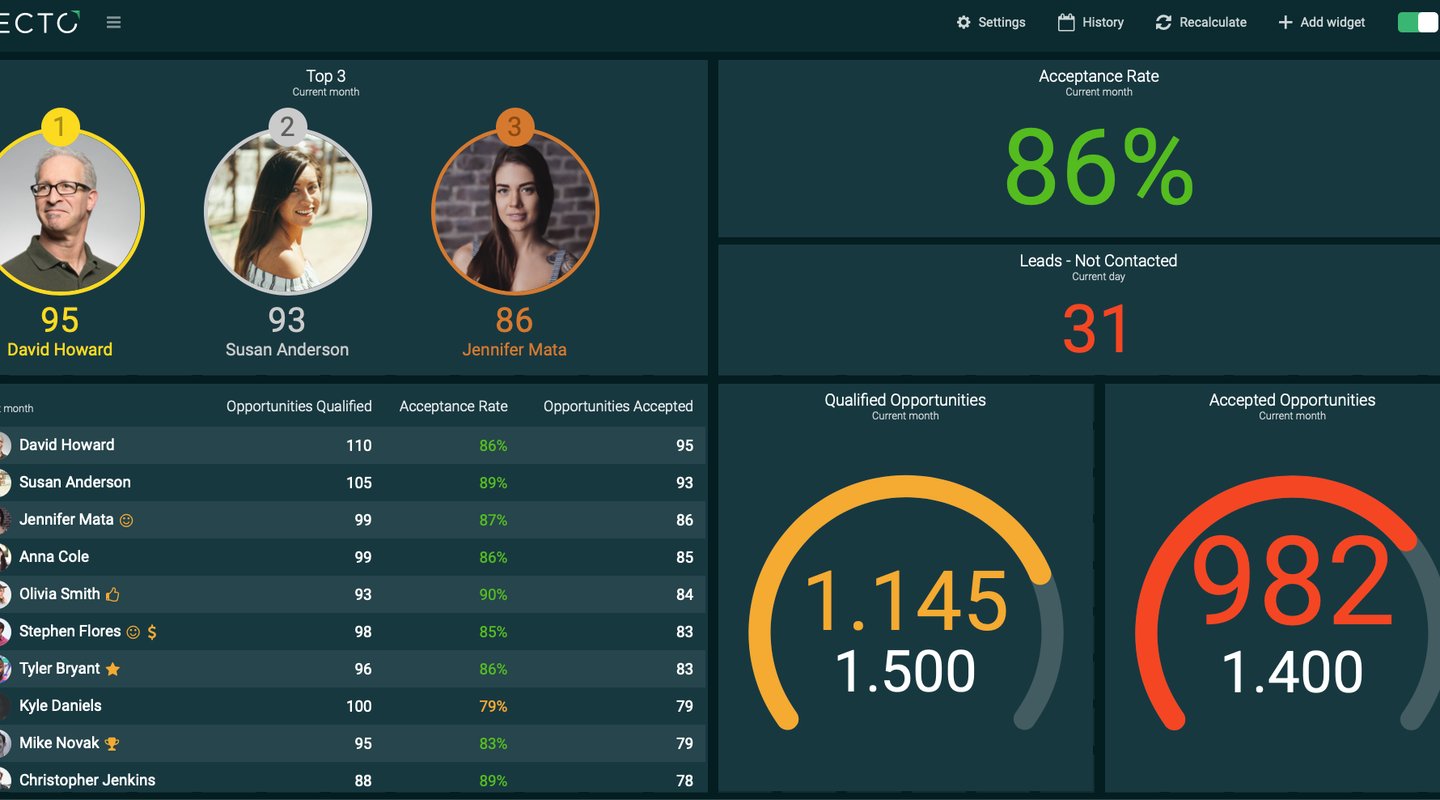
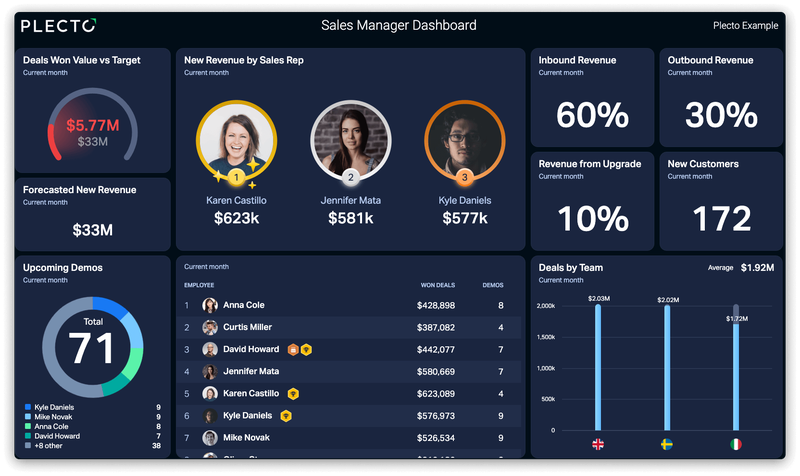
When it comes down to getting an overview of your campaign performance, Plecto can easily show you which campaigns perform best and what the return on investment is for each campaign. The overview is not only a way for executives to get insights; it’s also a way of using visuals to spark engagement and motivation in your teams.
Why use time on instructing your employees with long texts and spreadsheets where the essential insights get drowned beneath a never-ending overload of unnecessary information? The human brain follows visual instruction 323% better than written instructions – use Plecto to make your team take responsibility for your company’s key results.
Want to experience the power of visualization? Sign up for a free Plecto demo today.