
Table of contents:
Why KPI Reporting Matters
KPI stands for Key performance indicators and are used in business to track and measure performance in order to achieve set-out objectives.
Tracking KPIs is pivotal for businesses since they will give companies and individuals an overview of their performance. KPIs identify trends in your data and reveal what areas need to be prioritized and improved on, enabling you to make data-driven decisions.
In order to get the maximum from KPIs you need to do KPI reporting they will help you combine all the data related to your KPIs and visualize them. Keep on reading to find out about best practices in KPI reporting.
What Is KPI Reporting, and Why Should You Do It?
The purpose of KPIs reports is to visualize a company´s performance in relation to set KPIs. The reports are used in order to analyze current strategies and make future data-driven decisions and strategies.
Here are some of the benefits of doing KPI reports:
1. Overview of the company’s performance
This is something all companies can benefit from. With this information, you can identify trends, pinpoint new opportunities for growth, track your progress, and make data-driven decisions.
2. Identifying opportunities and set goals
By reporting on the right metrics you will gain complete insight into your operations. With this, you will be able to see where you are underperforming and can come up with solutions more effectively.
3. Employee development
With the help of KPIs, you can monitor your employee performance. By doing so you can easily find out what motivates your employees and how to continue doing that or find out what is that your employee struggles with. Your employee struggling with their tasks affects their performance and productivity. So realizing it on time and implementing new training will make a world of difference. Also by, having motivated employees you already made a positive impact on their performance. One of the ways to keep employees motivated is by reporting their contribution to the KPIs, allowing them to gain a more long-term perspective of their performance.
A Step-by-Step Guide to Creating KPI Reports
Now that we have established the KPI report meaning and its benefits, you may be wondering to yourself, "Okay, but how do I actually make KPI reports?"
Read on to find out what steps to follow when performing your KPI reporting.
Step 1: Set your goals and objectives
Before setting your KPIs you need to know what you want to achieve. So sit down and determine your goals and set measurable and reachable objectives based on that. By setting your objectives you will gain an understanding of which KPIs are valuable to you and where should you focus your efforts.
Step 2: Select what data is valuable for you
It’s likely that you’re dealing with masses of data on a daily, perhaps even hourly basis. So, it’s essential that you pick and analyze the data that is most important and relevant for your KPIs.
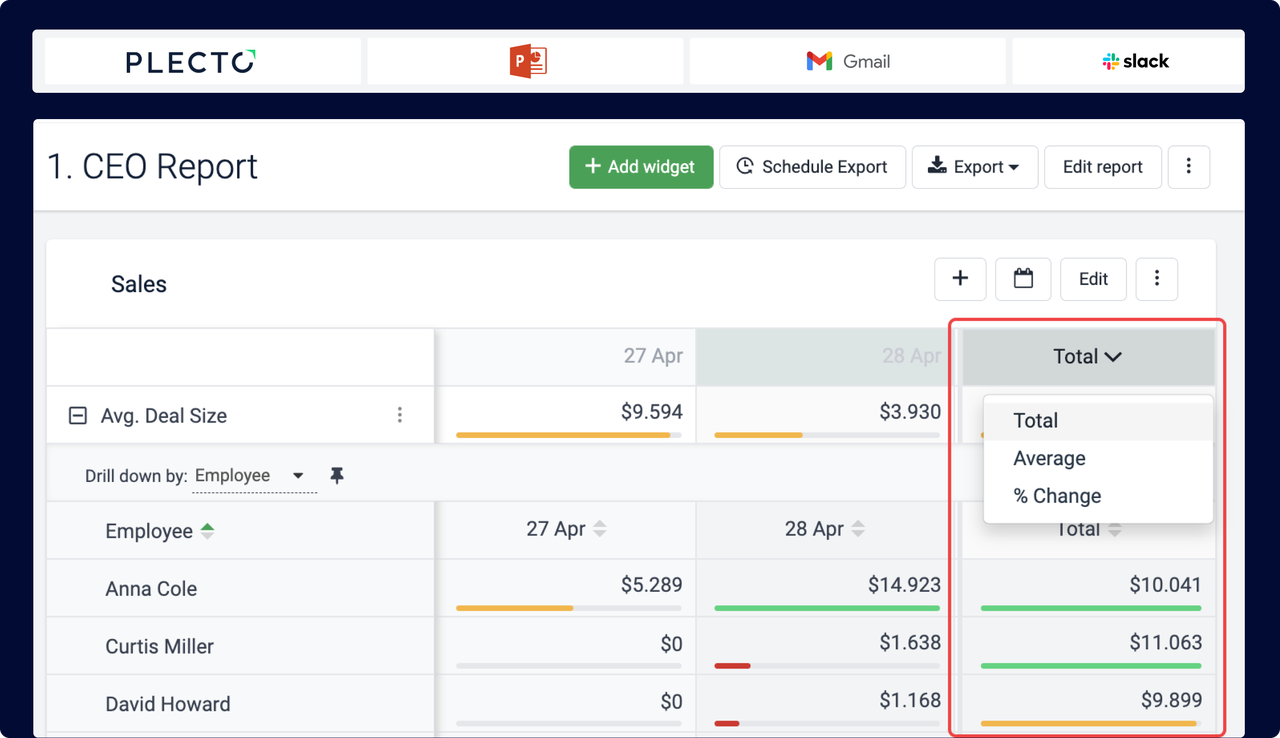
A good way of having your desired data collected and put together is by setting up automated reports. Plecto’s automated reports are real-time reports, meaning whenever your data gets updated your report will get updated with it.
Step 3: Set your KPIs
Now that you have your goals and have identified the data that is at the core of your operations, it's time to set your KPIs. Your KPIs will vary on your time, individuals, and team. So your sales team will have different KPIs than your customer service team. Also, your KPIs can depend on the industry you are in, SaaS industry will track different KPIs compared to the insurance industry.
Step 4: Break down the data
After you have compiled your report, you want to analyze it. Analyzing the data will help you with identifying patterns and areas that need improvement.
Step 5: Showcase the data
Once you have identified areas that need to be improved and noticed patterns, share your findings with your team so that you can optimize your performance. The most effective way of doing so is by taking the same KPIs that you are measuring in your reports and visualizing real-time data dashboards.
How Can Plecto Help With Your KPI Reports?
We already mentioned that by automating your reports with Plecto you will save time and choose how often you want your reports exported. Well, Plecto offers you that and more.
By choosing Plecto, you will have the option of having your data visualized on both real-time reports and real-time dashboards. Sign up for a free demo, and see how Plecto can help you with your KPI reporting and dashboard visualization so that you can see improvement instantly.
Start your 14-day
free Plecto trial today.
MARIANA PREPROTIC
Content Writer