
Table of contents:
20 Essential CS KPIs
Looking to optimize your CS call times, data tracking, and employee motivation Look no further. Below are 20 of the most critical KPIs for every CS team to accomplish these goals. They're especially valuable when tracked on a live data dashboard to encourage team transparency, accountability, and decision-making. Enough talk—let's dive in.
1. Average Call Duration
Customers want their issues resolved quickly and efficiently, and companies want to minimize costs. Keeping the average call duration to a minimum is a win all around—customers will be impressed with the company’s efficiency and reps will be able to serve more customers in less time.
2. Average Wait Time
How long a customer spends on hold before speaking with a rep directly correlates to their level of satisfaction with the service they receive. Research shows that 60% of customers feel that holding for even one minute is too long. First impressions matter, and that’s why this KPI is first on our list.
3. Average First Response Time
Today, not all customer service happens over the phone. Customers and companies are interacting via chat, social media, email, instant messaging apps, and more! This KPI can give you a holistic view of how quickly your company is responding to initial tickets across all channels. The average FRT is 12 hours and 10 minutes, yet 46% of consumers say they expect a response in less than four hours and 12% expect a response within 15 minutes.
These numbers show a huge gap between what customers expect and what they’re actually getting. Streamlining processes around this KPI could be a quick and easy win. However, it’s important to note that auto-responders should not be included when calculating this KPI—it should only track responses that add value for the customer.
Average Wait Time = (Total Wait Time/ Total Number of Calls) x 100
4. First Contact Resolution (FCR)
FCR is one of the best call center KPIs to track to get a snapshot of your team’s accuracy and efficiency. It measures the percentage of calls your agents can resolve in a single contact without having to follow up – and without the customer having to call back because their issue wasn’t resolved.
In other words, FCR measures the percentage of calls that receive ideal outcomes. How quickly the issue was resolved and how well the solution met the customer’s expectations are two of the most important customer satisfaction drivers.
If your call center is resolving most inquiries in a single contact and to each customer’s satisfaction, you’re likely to get stellar marks for service. A realistic FCR target is between 70 and 75%.
First Contact Resolution Rate = (Number of Issues on First Contact / Total Number of Issues) x 100
5. Average Resolution Time
Not every issue can be solved during the first contact, so this is an important metric in assessing how efficiently more complex cases are being resolved. This KPI measures how long it takes from the customer’s first contact about the issue until the ticket is closed.
Benchmarks vary by industry, but here are some general guidelines:
- Good: < 12 hours
- Average: 12–48 hours
- Poor: 48+ hours
Average Time to Resolution = (Total Resolution Time / Number of Tickets)
Keep in mind that it’s OK for some cases to take longer than others and that a quick resolution doesn’t necessarily indicate a satisfactory resolution. This is an excellent KPI to correlate with the department’s average customer satisfaction score KPI (see below).
6. Average Cost Per Resolution
You’re in business to make money, and while outstanding customer service is important, so is keeping costs to a minimum. Tracking the average cost per ticket is one of the most effective ways to optimize staffing levels and get a handle on operating costs.
If your costs are off the charts, you might want to look into self-service tools. 40% of customers who are looking for quick answers to simple questions choose self-service tools as their first option. Knowledge bases containing things like troubleshooting tips, video tutorials, and FAQs can improve customer service while reducing operating costs.
7. Cost per Call (CPC)
Our list of call center KPIs wouldn’t be complete without a financial metric. Companies are in business to make money, and while outstanding customer service is important, keeping costs down is also important.
Tracking the average cost per call is one of the most effective ways to optimize staffing levels and keep an eye on operating costs. If your cost per call is higher than you’d like, you might consider looking into self-service tools.
In a departure from customer service of the past, toll-free numbers aren’t the automatic first choice – especially for younger customers. Increasingly, customers who are looking for quick answers to simple questions choose self-service tools as their first option.
Online knowledge bases containing troubleshooting tips, video tutorials, and FAQs can provide better convenience while reducing operating costs. When calculating CPC, you can choose to only include direct labor costs or also include overhead costs like software licenses, hardware, and office costs for a fuller picture.
CPC = Total Cost of Calls Handling / Total Number of Calls Handled
8. Average Handling Time (AHT)
AHT is an important metric for assessing your call center’s efficiency. It measures the average amount of time it takes to handle a call from start to finish – including navigating phone menus, hold time, talk time, and post-call administrative work. Customers want their issues resolved quickly, and companies want to minimize their support costs.
Keeping the AHT to a minimum can be a win all around, because customers will appreciate the company’s efficient service while the call center team serves the maximum number of customers in the least amount of time. However, it’s important not to sacrifice thoroughness for speed – placing too much emphasis on efficiency could backfire if the quality of service suffers.
Average Handing Time = (Total Talk Time + Total Hold Time + Follow-up Time) / Total Number of Calls
9. Average Abandonment Rate
Average abandonment rate tracks how many callers hang up before speaking with someone. It’s one of the most important KPIs for call center performance tracking because a high abandonment rate could point to a range of issues including frustrating phone menus and understaffing, which lead to long wait times and frustrated customers.
Today’s time-pressed customers expect quick and convenient service, and they’re likely to hang up if they’re frustrated by the phone menu or feel that they’ve been waiting too long to speak with an agent. This is one KPI that you’d like to see as close to “zero” as possible.
Average Abandonment Rate = (Number of Calls Abandoned / Total Number of Calls) x 100
10. Escalation Rate
Escalation Rate measures the percentage of customers whose ticket has been escalated to a new level. This could be to a manager or supervisor, or specialist team.
By tracking this customer service metric, you will gain insights into potential problems with your product/service or customer service team itself. A high escalation rate can indicate that something about your product/service is unclear.
If it’s often the case that customers are often requesting more detailed assistance, it might be worth running a few extra training sessions to bring your representatives up to speed. Whatever the reasons for escalation, it is likely to have a negative impact on customer satisfaction, so solving issues relating to this is crucial.
11. Repeat Contact Rate
Also referred to as the Repeat Call Rate, this metric refers to the percentage of customers who reach out to customer service multiple times due to the same issue. Having to go over the same issue multiple times, eats into your agents’ valuable time and increases the queue for all customers.
One of the most effective solutions for this problem could be creating self-service support where frequently asked questions are answered and explained. By doing so, you will be saving your time and your customers' time.
Some other solutions include implementing a last-agent routing system. This means you redirect your customer to the last person they talked to, as they are more familiar with the customer’s specific problem.
Matching the customer with a more experienced or specialized customer service representative can also cut down on time and increase efficiency. To tackle the core of the problem, it’s worth regularly training all of your representatives about ways to resolve problems and on new processes.
12. Calls Answered Over Time
This is an important individual customer service KPI because it can help compare performance between reps to help identify who could benefit from further training—or who might have some tips that could benefit the whole department.
13. Volume by Channel
COVID permanently changed the customer service landscape. Now 67% of consumers say they regularly use three or more channels to engage with a single company. Understanding how your customers are contacting your company can help drive staffing decisions to ensure the adequate coverage where most customers are initiating support requests. It can also help you avoid the pitfall of de-staffing channels based on intuition, which can result in poor resolution times and low satisfaction-related scores.
14. Agent Utilization
With the agent utilization metric, you are able to monitor how much your customer service representatives spend time on individual customers’ requests.. In short, it’s the ratio of representatives’ productivity to their time capacity.
Agent utilization is a metric that you need to keep in constant balance. It affects your costs, and by maintaining a high agent utilization rate you can reduce the cost per ticket.
But as said, you need to keep a healthy balance. Having an extremely high agent utilization will lead to employee burnout and unmotivated employees. This will likely increase employee turnover, resulting in even higher costs to cover.
15. Average Customer Satisfaction Score (CSAT)
None of the other call center KPIs matter if most of your customers are dissatisfied. CSAT measures how well your service met the customer’s expectations. It’s measured based on one question: On a scale of 1–5 how satisfied were you with our service today?
This is the formula to calculate CSAT:
CSAT Score = (Number of Positive Ratings / Total Number of Responses) x 100
Here are some current industry CSAT benchmarks for phone support:
- High: 95%
- Average: 87%
- Low: 76%
16. Average Customer Effort Score (CES)
This customer service KPI is based on a one-question survey that asks something along the line of: On a scale of 1–7, how easy was it to get your issue resolved? An average rating of 5+ means that your company’s customer service is perceived as fairly helpful and easy to contact. Lower scores could use some attention.
With 50% of customers saying they’d take their business elsewhere after one bad customer service experience, this metric can prove crucial to customer retention.
17. Net Promoter Score (NPS)
Before we get into the nitty gritty of call center KPIs, let’s talk about NPS, which is an important counterpart to CSAT. Going a level deeper than CSAT, NPS measures customer loyalty based on how likely the customer is to recommend a company or product to others. Like CSAT, NPS is measured based on one question: On a scale of 1–10, how likely are you to recommend us to a friend?
Generally, customers fall into three groups:
- Detractors: 0–6
- Passives: 7–8
- Promoters: 9–10
This is the formula to calculate NPS:
Net Promoter Score = Total Percentage of Promoters – Total Percentage of Detractors
18. Customer Retention Rate (CRR)
Providing outstanding customer service is one of the easiest ways to retain customers, while providing lackluster service is one of the quickest ways to lose them. That’s why this customer service KPI concludes our list. A high CRR indicates that you’re providing the right level of service and should reap the rewards of higher customer lifetime values and increased profits.
19. Employee Turnover Rate (ETR)
Customer service personnel are as important as the customers they serve, so we’d be remiss not to mention this one on our list of the most important KPIs in customer service! This is a notoriously high-turnover business and the cost of recruiting, training, and onboarding new employees can be staggering—especially in large teams. Keeping an eye on this metric will help identify negative trends so you can take a closer look at what’s driving the attrition and make the necessary adjustments.
20. Service Level
The second of our call center KPI examples is essential to assessing whether the call center is meeting customers’ expectations for prompt service. Service level tracks the percentage of calls that are answered within a target timeframe, which is often measured in seconds.
A common service level target is “80/20,” which refers to answering 80 percent of calls in under twenty seconds. How long a customer spends on hold before speaking with an agent has been shown to directly impact their level of satisfaction with the service they receive.
Research shows that 60% of customers feel that holding for even one minute is too long. A high service level indicates that the call center is adequately staffed with the right competencies, though this metric should be assessed within the context of satisfaction-based metrics like CSAT and NPS.
Number of Calls = (Answered Within the Service Level Threshold / Number of Calls Offered) x 100
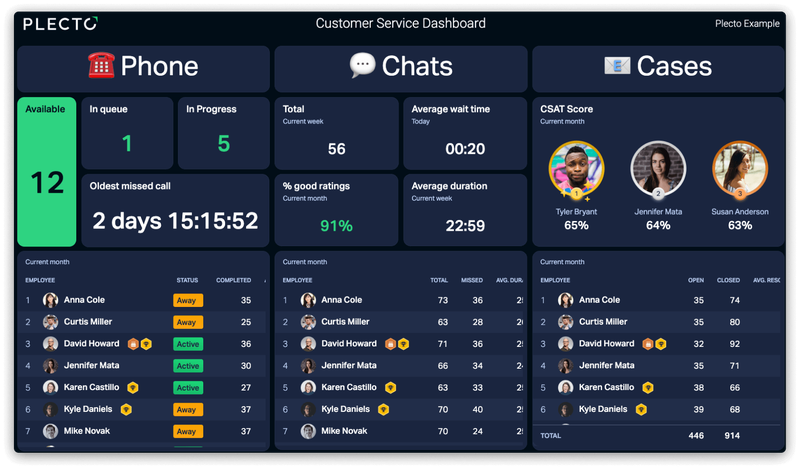
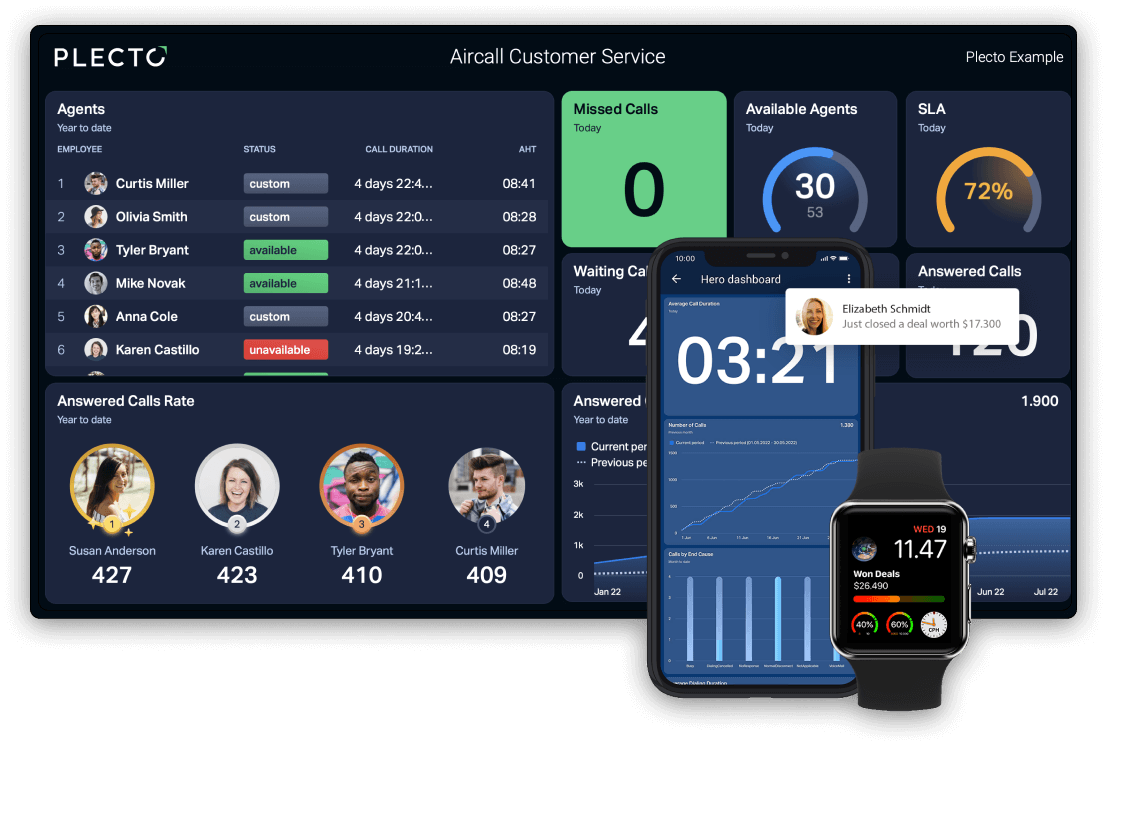
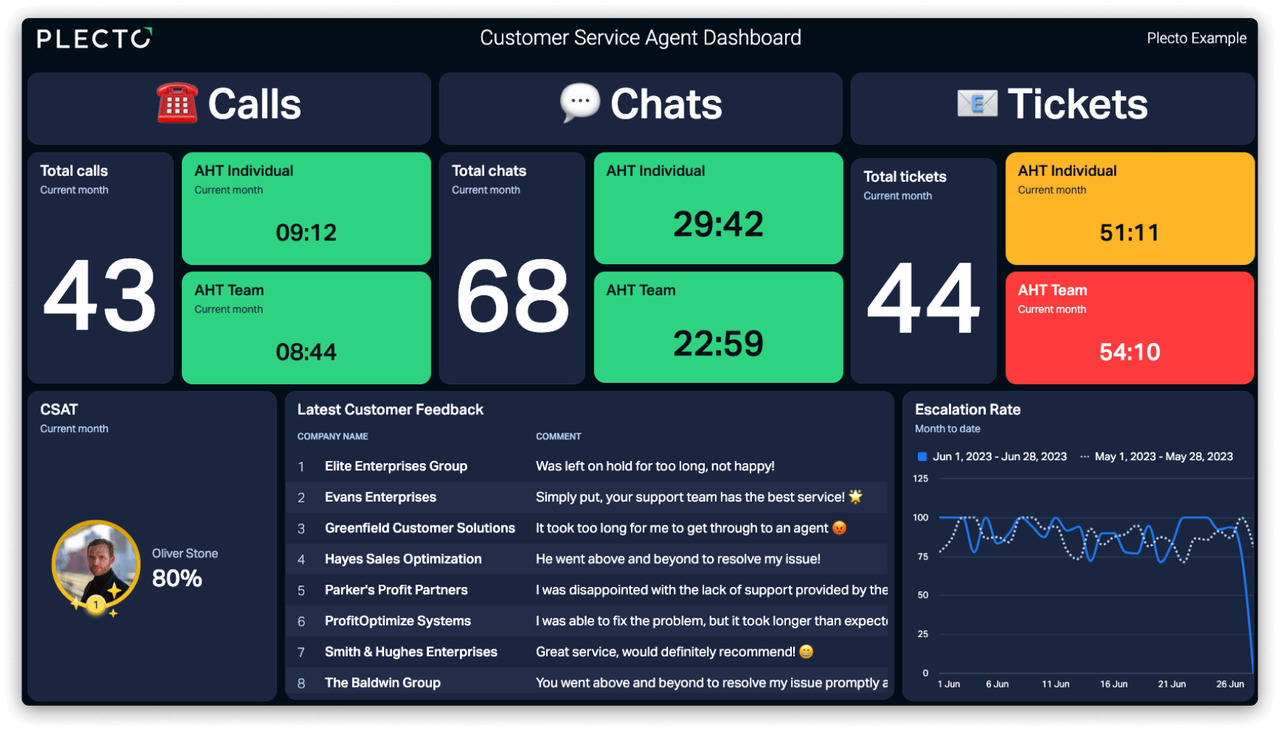
Build Your Best CS Dashboards with Plecto
Can't get enough of these 20 CS KPIs?
The good news: You can track these—and many more—on Plecto's Real-Time and Dynamic Dashboards.
Revolutionize how your team does customer support. Sign up for a free trial or demo today!
Start your 14-day
free Plecto trial today.
SAGE CRAWFORD
Content Manager