Table of contents:
The Importance of Sales KPIs
Tracking the right sales KPIs is one of the first and most important steps to building a performance-driven sales culture in your organization. But how do you know that you’re tracking the right sales KPIs — the ones that will drive measurable results that outperform your targets?
The following 21 sales KPI examples will set you on the path to success. They can be tracked individually, per team (e.g., inbound/outbound), by location, or whatever makes sense for your organization.
What are Sales KPIs, and Why Should You Track Them?
Before we dive into the sales KPI examples, let’s talk about what sales KPIs are and why they’re important.
Sales KPIs help sales leaders and the sales reps themselves ascertain how well their team is performing. But in order to do this, it’s essential that everyone in your organization has access to the right data, preferably in a visual format — like charts and graphs. With the right data, in an easy-to-understand format, your team will be able to optimize their pipeline, track progress against targets, and focus their attention where it matters the most.
Understanding how your pipeline is performing is the key to your future success. When you understand what’s happening and why, you’re better able to forecast, predict revenue for the current sales cycle, and know whether your current processes are working or in need of adjustment.
Many sales organizations make the mistake of collecting too much data that’s irrelevant to the bottom line. Instead, they should focus on a handful of KPIs that directly contribute to profitability. Sales KPIs aren’t simply metrics, they’re measures of performance against specific goals. Over time, these sales KPIs can help you understand where you are and where you’re going — and why some deals closed while others didn’t.
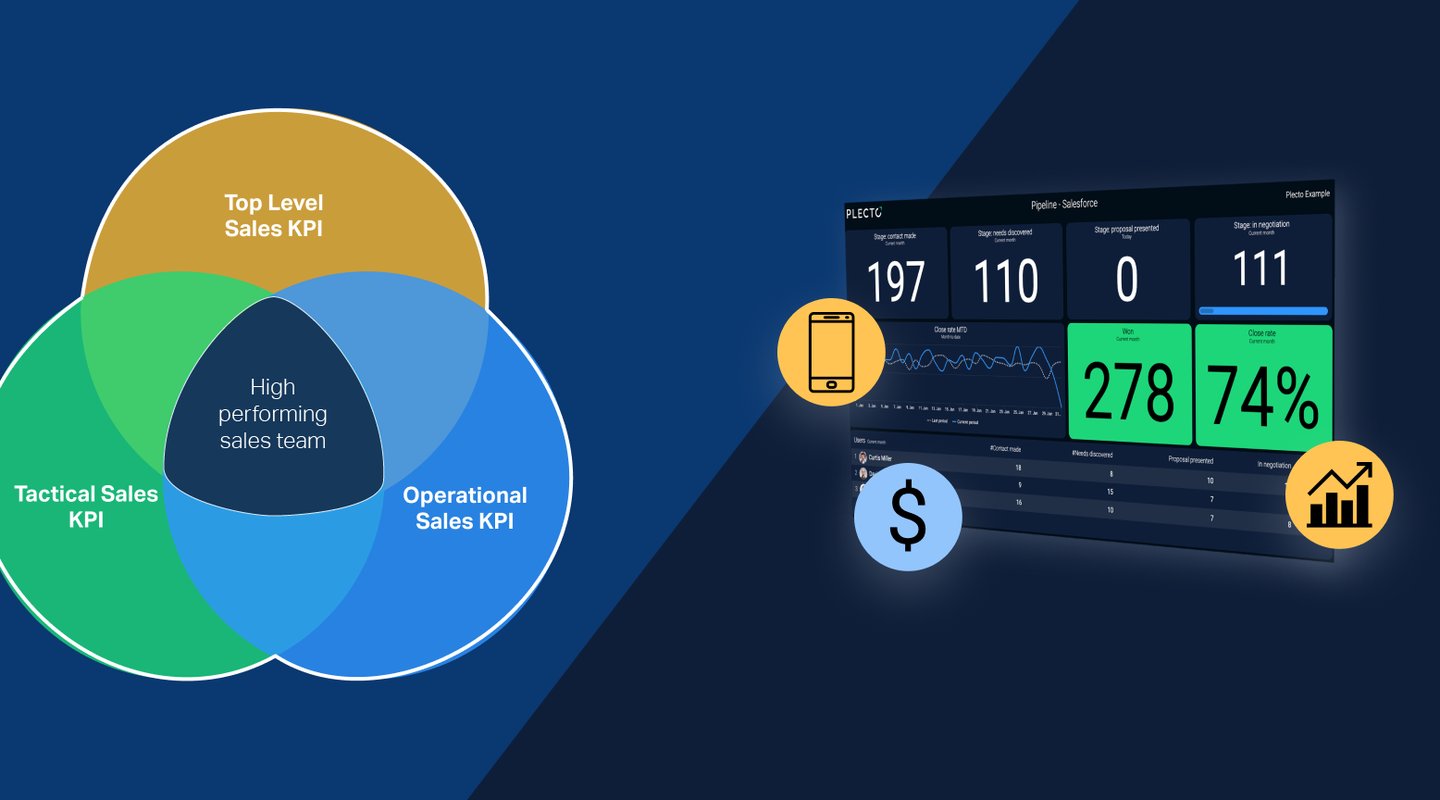
An effective mix of sales KPIs is multi-faceted and measures top-level performance as well as the operational and tactical effectiveness of your organization’s current activities and practices.
To make the most of the data you collect, it’s imperative to visualize that data in dashboards that are accessible to everyone in your organization. Without visible data, you’re likely to find that KPIs are ineffective in driving the kind of performance you’re aiming for.

Top-Level Sales KPIs
Following are seven important top-level sales KPIs that can be indicators of how your sales force is performing overall. These sales KPIs can contribute to the overall picture of your team’s performance. If you're new to tracking sales KPIs, this is a great place to start — consider it your sales KPIs “starter pack."
1. New Business Revenue
Perhaps one of the most obvious KPIs, this one tracks how much income you’re generating from first-time buyers. Sales organizations generally put a lot of effort into prospecting, and “new business revenue” is a good barometer of how well your sales machine is functioning.
This KPI is best tracked monthly against a target percentage (e.g., 30% of revenue should come from first-time buyers).
To calculate this KPI, use the following revenue formula for your new business customer subset:
Revenue = Number of Units Sold x Average Sales Price
2. Repeat Business Revenue
This KPI tracks how much of your revenue comes from your current client base. This can come from reorders or cross-selling and upselling. This is an important KPI because it helps you identify the value of your current customer base and can help you identify which accounts should be nurtured, so your reps are directing their attention where it will matter the most.
This KPI is best tracked monthly (MRR), quarterly, or annually (ARR) against a target percentage (e.g., 70% of revenue should come from repeat customers).
Use this formula to calculate MRR:
Monthly Recurring Revenue = Number of Paying Customers x Average Revenue per Customer
3. Projected Pipeline Sales Value
Projected pipeline sales value measures the worth of projected deals in your sales funnel. It’s a fantastic way to get a snapshot of how your organization is tracking against its targets.
This KPI is determined based on the projected value of the deals in your pipeline and a percentage probability of them closing. It’s best tracked monthly as a monetary amount of potential revenue expected to close within a specific timeframe (e.g., $250,000 within the next 6 weeks).
Use this formula to calculate your projected pipeline value:
Projected Pipeline Sales Value = Deal Value x Probability of Closing
4. Save Rate
Nobody wants to lose business, but it happens. Fortunately, even when a customer has one foot out the door, it’s sometimes possible to bring them back in. Your team’s save — or retention — rate will show you how successful they are in re-engaging customers who are on their way out.
This can give you valuable insights into customer psychology, which can ultimately help you lower your churn rate by providing the right training to your team.
How often you track this KPI should be based on the size of your business and attrition. Most companies measure it annually, quarterly, or monthly. On average, save rates rarely exceed 30%, so make sure that you set a realistic KPI.
5. Churn Rate
An organization's churn rate is the rate at which customers stop doing business with your company. It’s important to understand that some customer attrition is circumstantial and beyond your control — companies go out of business, reorgs happen, and sometimes businesses have to cut costs.
An annual churn rate of less than 7% is generally considered “acceptable.” Beyond that, it could be time to determine areas outside of sales that might benefit from improvement — for example, customer service or product improvements.
Companies with a small customer base can get away with measuring this KPI once or twice a year, whereas companies with hundreds or even thousands of customers should track churn rates monthly to identify negative trends before they become a runaway train. A good target KPI is less than 5–7% of customer attrition in the timeframe measured.
Use this formula to calculate churn rate during a specified period:
Churn Rate = (Lost Customers / Total Customers at Beginning of Time Period) x 100
6. Customer Retention
It’s easier (and cheaper) to retain a customer than to recruit a new one. Therefore, it’s important to understand what percentage of customers your company retains over time. Happy customers can lead to word-of-mouth referrals, which can help grow your business over time with very little direct effort on your part.
Depending on the size of your business, you can track this KPI annually, quarterly, or monthly. Some huge companies track it on a weekly or even daily basis. A good target KPI is 92–95% retention.
Use this formula to calculate customer retention for a specified period:
Retention Rate = [(Number of customers at end of time period - New customers added) / Number of customers at beginning of time period] x 100
7. Sales Growth
Sales growth measures your team’s ability to increase revenue over a specified period. This is a strategic KPI that’s directly tied to revenue and profitability. It can inform strategic decisions all the way up to the CEO and board of directors. It is calculated as follows:
Sales Growth = (Current period sales - Sales during past period) / Sales during past period x 100
At a minimum, you should track sales growth on a monthly basis — but don’t forget to keep an eye on how your revenue is tracking against your quarterly and annual goals.
Tactical Sales KPI Examples
Tactical sales KPIs are timely measures of how well your current activities are driving business. These KPIs are generally measured weekly or monthly because they can give real-time insights into areas that might benefit from quick action — for example, system or process changes, or employee coaching. Following are nine tactical sales KPIs that can show you how well your current sales activities are working.
8. Revenue per Sales Rep
This sales KPI measures each sales rep’s ability to generate revenue for your company. Healthy competition is an effective motivator. Leverage this by visualizing the sales revenue generated by each rep. When employees can see how everyone else is performing, they’re more likely to outperform their targets.
9. Retention Rate by Sales Rep
Your sales reps are the face of your business and there’s more to success than just closing the deal. You want to close the right deals with the right customers — and ensure that they have a positive experience with your company.
The retention rate by sales rep sales KPI can help you to identify problematic patterns that can occur when reps close the wrong deal, over-promise, or don’t do what they say they’re going to do. Use this sales KPI to identify problematic patterns, then provide the necessary coaching to fix them.
10. Win Rate
This one might seem obvious, but it’s critical. Win rate is the clearest indicator of how your pipeline is performing — and whether you’re closing enough business to hit your targets. This all-important sales KPI can help you identify microtrends and take action before it’s too late.
Downward trends could be an indicator of a broader issue and draw your attention to potential impediments in your current processes — while upward trends can confirm that you’re on the right track!
Use this formula to calculate your Win Rate:
Win Rate = Number of won opportunities / Total number of opportunities over a given time
11. Hit Rate
Often confused with the Win Rate, a sales team's Hit Rate varies depending on what they're being measured on. For example, the goal of an Account Executive is to close deals from leads that have already been qualified. In this instance, their Hit Rate would be determined by the percentage of these qualified leads they can turn into closed deals.
The Hit Rate can therefore be considered a “work smarter not harder” KPI. It provides valuable insights into a rep's conversion efficiency rather, focusing on outcomes rather than just activity volume.
As such, the formula for the Hit Rate will depend on what you're measuring. However, if a sales rep's ultimate target is to close deals, then use this calculation:
Hit Rate = (Number of Deals Closed / Total Number of Meetings or Calls ) x 100
12. Pipeline Velocity
Your sales pipeline velocity will help you understand the customer journey from entering the pipeline to actually converting to a sale. This information can help you identify points in the process where prospects drop off and stop engaging with your sales reps. By segmenting this information, you’ll be able to pinpoint where it’s going wrong.
Use this formula to calculate your Pipeline Velocity:
Pipeline Velocity = (Number of Opportunities x Win Rate x Average Deal Value) / Sales Cycle Length
With a clear understanding of your typical customer journey, you’ll be better able to identify and address bottlenecks, keep doing what you’re doing right, manage your pipeline, and hit your targets!
13. Customer Acquisition Cost (CAC)
Marketing, advertising, and outbound sales cost money — and acquiring new customers can be expensive. These costs directly affect your company’s profitability, but do you actually know how much it costs to acquire a new customer? This KPI can help you track marketing ROI and identify places in need of adjustment.
If cold-calling isn’t working, maybe it’s time to pivot to social media campaigns and inbound sales. Keeping a close eye on customer acquisition costs will help you nip negative trends in the bud — and identify and leverage positive trends.
Use this formula to calculate CAC:
CAC = Total cost of acquiring customers / Number of customers acquired
14. Customer Lifetime Value (CLV or LTV)
Customer lifetime value measures a customer’s revenue over the entire time they do business with your company. It’s a sales KPI that can help you identify the types of leads your sales reps should be pursuing.
Larger deals with a higher lifetime value result in lower operational costs and higher profits. Understanding these customers’ key attributes can help your sales reps focus their attention on prospects with the highest ROI potential—and close the right deals.
Use this formula to calculate LTV:
LTV = Average purchase value x Number of purchases during a given time x Average retention time
15. New Leads
Another way to tap into your sales team’s competitive spirit is to visualize the number of leads generated by each rep. This is an important KPI because it highlights each rep’s contribution to the pipeline — and ultimately the bottom line.
16. Conversion Rate
This metric tracks how many leads become customers — and within what timeframe. It’s one of the most accurate indicators of whether you’re on track to reach your targets — if this KPI is on-point, your team is likely on the road to success. It’s also an effective way of assessing the quality of your team’s lead generation.
Use this formula to calculate the conversion rate:
Conversion Rate = (Total number of conversions / Total number of leads) x 100
Start your 14-day
free Plecto trial today.
Operational Sales KPI Examples
Operational sales KPIs are an important part of sales performance management. Companies use these KPIs to monitor and evaluate efficiency in their daily operations on an ongoing basis — daily, weekly, or monthly — to get real-time insights into which processes are effective and which could be improved.
Following are six operational sales KPIs that can offer insight into how your sales reps are spending their time — and help you determine whether your sales process is a well-oiled machine — or in need of some fine-tuning.
17. Number of Calls Made
To drive revenue, you need a strong pipeline. To get a strong pipeline, your sales reps need to be talking to people and qualifying leads.
This is largely a numbers game, so you’ll want to ensure that your team’s call volume is steady over time. On average, an outbound salesperson who’s fully allocated to cold-calling can make around 50 calls per day.
18. Number of Emails Sent
Like cold-calling, cold-emailing can be an effective way to fill your pipeline with qualified prospects. As with cold-calling, this is largely a numbers game. Of the emails sent, you want to see at least a 30% open rate.
Ideally, you also want them to respond — your target should be a response rate of about 50% of those who opened your email; a response rate of less than 30% means you should probably go back to the drawing board and fix your messaging.
19. Number of Meetings Booked
A pipeline full of fresh leads is useless if your team can’t convert them. This sales KPI tells you how effective your team is at converting leads and moving them through the pipeline to become customers.
The first step in this process is getting a meeting booked in the calendar. If your sales reps aren’t converting leads to meetings, you should probably start looking for barriers — common roadblocks include inadequate training or support, inefficient sales processes, and ineffective lead qualification.
20. Number of Offers Sent
Your sales reps are cruising along, making calls, sending emails, and setting meetings — things are looking good! If your sales process is on-point, the next step should be sending an offer.
Looking at the number of offers sent compared to the volume of calls, emails, and meetings will give you a pretty clear indication as to whether your team is prospecting to the right people and generating opportunities that have real value.
21. Average Call Duration
Your sales reps’ average call duration is a sales KPI that can give you insights into the effectiveness of their sales pitch. A first call should be quick, to the point, and enough to pique the prospect’s interest in setting another meeting.
If you find that your reps are spending a lot of time of the phone without converting, it could be time to adjust the pitch or schedule some training. If you discover that some reps are blowing away their targets while spending less time than others on the phone, you might want to take a closer look at their pitch and perhaps have them share it with the rest of the team.

Your Sales KPIs Are Only as Good as Your Tracking
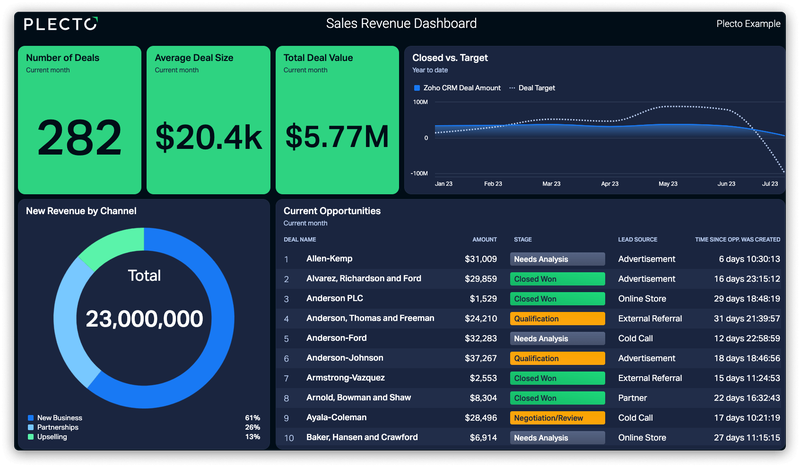
We’ve given you 21 great sales KPI examples but sales KPIs are only effective if you measure them and act on them. In order to drive performance, you have to actively track your KPIs. An excellent way to do this is by visualizing the data on dashboards that are accessible to everyone in your organization.
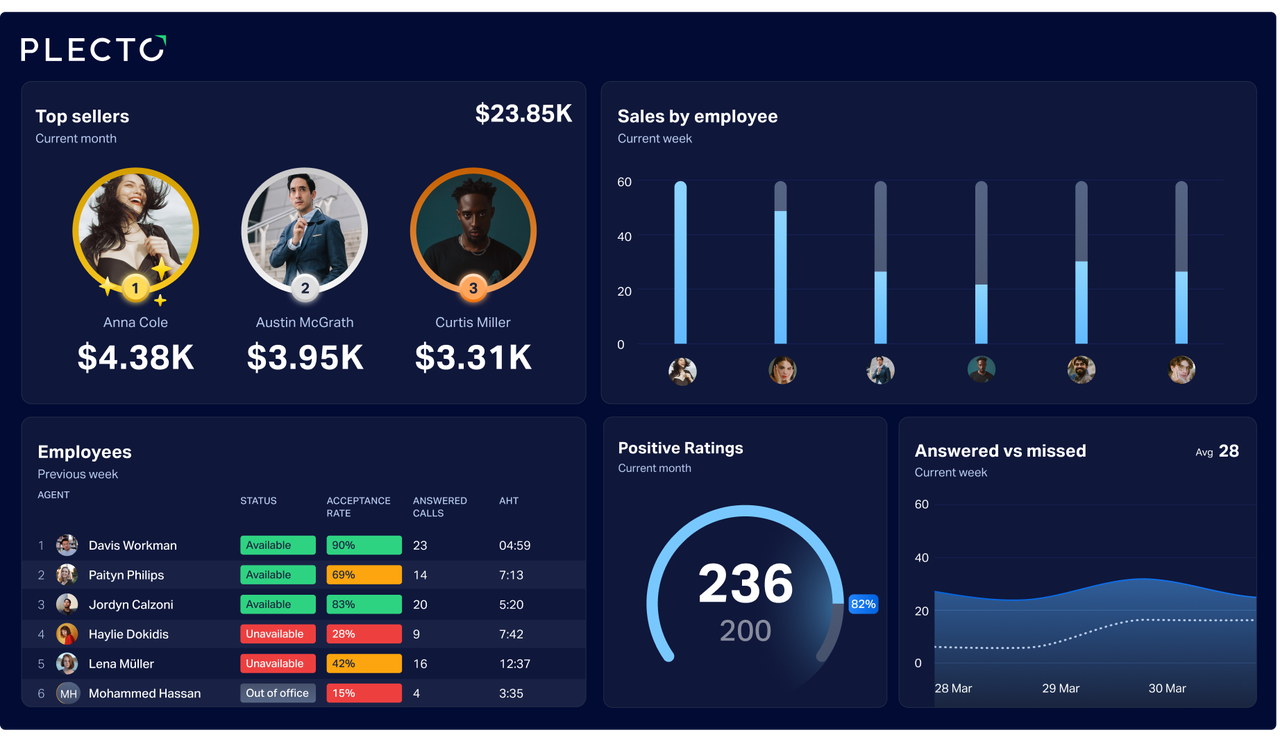
Plecto integrates with most major sales-tracking software and offers almost unlimited options for customizing your data visualization. Plecto also includes built-in performance-driving features like leaderboards, gamification, and instant notifications to spark friendly competition and keep your employees motivated!
Sign up for a free Plecto demo, and give these sales KPIs a test drive!
Start your 14-day
free Plecto trial today.
SAGE CRAWFORD
Content Manager