
Table of contents:
Why It Is Crucial to Boost Your Insurance Sales
The global insurance market is forecast to keep growing at an annual rate of 9% in the upcoming years. After the pandemic, customer preferences have shifted, and new opportunities and threats have appeared on the market. As demand grows, competition becomes more intense and so to remain competitive, insurance companies need to find new ways to engage with customers.
Struggling to come up with ideas for how to boost your insurance sales? This complete guide will provide you with ideas on how to sell insurance at your agency. You will undoubtedly be able to increase your sales after reading this article!
What Is Insurance Selling?
Insurance sales are the process of selling different insurance products and services to B2C and B2B customers. Insurance companies can sell a variety of products and services that are meant to protect against unplanned events, financial losses of tangible and intangible assets, and unplanned personal events like illness, accidents, or personal losses.
The insurance selling process is complex, and significant effort is required to reach targeted customers. It involves customer analysis and preferences and explaining and guiding customers through complex insurance policies. Post-sale service is also a vital element that helps retain customers. This can include support, policy renewals, claims processing, and assistance with policy changes.
In short, insurance selling involves marketing and sales and requires a lot of preparation and planning.
Challenges of the Insurance Market
It is difficult to determine how to sell insurance and increase market share due to market obstacles. It is essential to note that market competition and various government regulations have an impact on the insurance industry. For example, increasing competition makes customers more price-sensitive. The number of customer exceptions is growing, and they desire more personalized options that meet all of their requirements.
This era is also characterized by a rise in technological prowess across all industries. It shows the difficulty of transitioning from traditional insurance products to modern ones, which require more complex solutions. Insurance should manage massive and catastrophic events such as natural diseases, cyberattacks, loss of assets, and a great deal more, which necessitates a higher level of knowledge.
The Importance of Increasing Insurance Sales
Companies naturally want to do the best they can with their sales. By coming up with the right strategies, your insurance company can grow and boost your sales performance. This will give you the chance to improve your offerings and provide your customers with more value.
Increasing sales also means getting more customers, giving you a bigger share of the market. Also, it makes your brand seem more trustworthy, in turn attracting even more new customers and keeping the ones you already have. Diversifying can also help insurance companies lower their risks and protect them from taking on bigger losses.
Step 1: Analyze Your Customer
Achieving your sales objective should begin with the creation of essential milestones.
To initiate effective sales, you must determine what "pain" your customers are experiencing and what value you can offer to resolve it. That's the first step in learning how to sell insurance successfully.
Firstly, identify the most profitable and desired market niche first. You can choose your consumer segments based on a variety of criteria, including age, gender, marital status, occupation, and income.
For example, let's look at the demographic of age. Younger customer segments are more likely to be purchasing their first assets, such as a house or a car, which requires investments and savings. When it comes to older customer segments, it is natural to stress the benefits of health and life insurance.
Remember, if you want to be an effective insurance salesperson, you must always stay one step ahead and understand what risks your potential client may face, since this is where the true value lies.
Flexibility is the answer to the dilemma of how to sell insurance, because, as we've already hinted, being able to tailor your offering will help you appear more attractive to customers.

Step 2: Develop a Sales Strategy
After evaluating your preferred customer segment, you can begin developing your sales strategy. Focusing on a specific customer segment requires research into the state of the market as well as keeping an eye on your competition.
An examination of the external environment will aid in defining the market position and establishing a sales goal and value proposition. Perhaps it would be a good idea to evaluate your historical data in order to figure out what is achievable in the future when setting your future goals, while developing a value proposition and defining your uniqueness in the insurance market.
There are numerous propositions to consider, such as innovative product offerings, competitive pricing, or a niche product that will only be available through your company.
Setting goals should not be considered a formality; if you want to properly monitor your sales strategy, you must establish necessary sales targets and metrics to aid in evaluating your sales performance. You can track various insurance KPIs to help you meet sales targets and increase insurance selling!

Step 3: Build a Strong Relationship with Customers
It's critical to emphasize that a strong customer base will foster trustworthiness and help to build a strong brand image. Customers now want efficiency and don't want to waste time on unimportant details.
Begin with the most popular marketing channels, such as Facebook, Instagram, LinkedIn, or Twitter. Through these channels, you can promote insurance products or services, share real-life stories and promote your value, and provide advice and top tips to potential customers.
It's also critical to highlight that insurance services are not easily understood. Create a simple, user-friendly website that contains all of the necessary information. On a single page, provide straightforward information about what your packages cover, its pricing, and all the detailed information.
However, having well-designed and informative online channels is insufficient. Provide online customer service and respond to customer inquiries as quickly as possible to build strong customer relationships.

Step 4: Grow Your Customer Base and Retain It!
Right now, you may wish to say, "Finally! Success!" even if you have sold numerous insurance policies. But you are not yet finished!
The difficulties begin when you must save and retain customers. You must constantly generate new strategies for selling insurance and expanding your customer base.
If you conducted proper market research at the beginning, it must be continually updated, and your offerings must reflect the current market conditions. By designing effective marketing campaigns, you can recommend upselling and cross-selling to your customers.
Retain your customers by recommending loyalty programs, unique insurance policy add-ons, and personalized offers. We must emphasize that referrals can also be crucial to your success.
This, however, depends on the services you provide to clients from the very first minute. Staying current with the market and consumer trends will help you maintain a dominant market position.
Step 5: Include CRM in Your Process
Online channels not only changed how customers shifted their purchasing habits but also enabled businesses to collect more accurate information regarding customer preferences, trends, and purchasing patterns.
If you are thinking about how to sell insurance more profitably, let us introduce CRM systems. Having an up-to-date CRM system is the key to selling more effectively.
Updating your CRM system with the most recent data provides your insurance company with numerous advantages, such as the ability to identify customer preferences and trends. This will allow you to create personalized offers for your customers and enhance their shopping experience.
Additionally, sales will improve with effective management. CRM is an essential tool for selling insurance because it involves lead management, customer qualification, and customer retention. CRM is a must-have system for any insurance company because it automates a large number of "routine" tasks, such as sending follow-up emails or newsletters to various customer segments.
CRM centralizes all your information, allowing you to optimize your sales cycle due to the centralized structure of the information. Keeping all the information you need up to date will not only save you time, but it will also help you increase profits!

Key Data-Based Benefits for Insurance Carriers
Insurance data analytics is the collection and analysis of insurance-related data to mine actionable insights that can help drive business decisions. Data and analytics have driven pricing and claims-related business decisions for decades.
Now with the proliferation of big data, more and more insurance companies are mining and using this data to predict what will happen to their businesses in the future—and to drive decisions that will positively affect these outcomes.
In 2021, insurance companies invested $3.6 billion in big data analytics. In return, they’ve seen a 30% increase in efficiency, 40–70% cost savings, and a 60% increase in fraud detection rates. The insurance industry is a leader in the use of big data analytics and now uses this information at almost every stage of its everyday operations.
Managing risk while offering competitive policies is one of the main drivers of using data analytics for insurance. Many insurance companies offer a variety of insurance products covering everything from cars and property to health and long-term care—each with its own risk profile.
Regardless of which products they offer, all insurance companies seek to reduce costs, increase profit, and build lasting customer relationships—and many rely on data-driven predictive analysis to make sound business decisions that support these goals.
While insurance analytics can improve the efficiency of claims, policy, and sales processes, that’s just the tip of the iceberg.
Start your 14-day
free Plecto trial today.
1. Lead Generation
There are a lot of challenges out there for lead generation insurance companies. Watching the competition and taking the lead on the market, bringing in high-intent insurance leads, and always having excellent customer service, just to name a few of the challenges lead generation companies are facing.
Data analysis helps in many different ways to solve those problems.
First and foremost, data analysis gives marketers and insurers a clear understanding of their Customer Acquisition Cost or CAC, displaying how much is spent on organic lead generation and third-party vendors. The end result of this is that it puts out a clear view of where companies should invest their resources.
How to generate organic insurance leads
You will start by using data analytics to find out what your perfect leads look like and how and where to find people that fit into that. While many companies have viewed this as a disadvantage, others have seen it as an opportunity.
Many CRMs and agency management systems provide the capability to segment customers by correlating customers’ search data with their buying patterns to better understand the customer journey. This enables marketing departments to target leads with the right information at the right time via the right channel.
A pro tip for insurance companies would be to use predictive analytics, which can help them set up future steps in the lead generation process. These are the usual tactics used to generate organic insurance leads:
- Positive client reviews on their own website as well as review sites
- Word of mouth → asking existing clients to recommend you. You could even start a referral program!
- Investing in content marketing
- Networking! Both online and offline in order to make an organic lead generation pool.
Online self-service quoting tools have disrupted the usual insurance sales process, which has traditionally been high-touch and based on long-term relationships between insurance agents and the people they insure.
2. Better Customer Satisfaction
According to McKinsey, insurance companies that offer best-in-class customer experiences are 80% more likely to retain customers than companies that don't. In addition, they’re more likely to successfully cross-sell and receive referrals, which can significantly reduce marketing and customer acquisition costs.
Insurance companies have caught wind of these benefits and have begun analyzing data trends in an effort to predict their customers’ needs. This makes it easier to provide support, suggest relevant products, and close sales.
Using data analytics to uncover customers’ most common support inquiries enables insurance companies to provide comprehensive self-service tools that provide around-the-clock support and boost customer satisfaction scores.
Companies that can accurately predict their customers’ needs, whether it’s support or a particular product, are more likely to exceed expectations and reap the rewards.
3. Less Fraud
Claims fraud has always been one of the biggest challenges facing the insurance industry. In the United States alone, fraudulent claims cost at least $80 billion per year —an estimated 10% of all payouts. Fortunately, recent advances in insurance administration solutions and data analytics have yielded significant improvements to fraud-detection processes.
Data analytics in insurance makes fraud-detection processes faster and more accurate. Analytics make it easier to spot trends while advanced analytics and predictive modeling use historical data (e.g., past claims, frequency of claims) and externally sourced information (e.g., credit scores) to flag claims with a high probability of being fraudulent.
These data analytics have become so advanced that some predictive analysis models can even pinpoint customers who are most likely to submit fraudulent claims, empowering insurers to take preventative measures before they’re taken for a ride.
4. Faster Underwriting
Underwriting has long been one of the most complicated aspects of the insurance business because while the stakes were high, it was largely based on intuition and guesswork. Data analytics for insurance are changing this by using predictive trend data to produce comprehensive risk assessments.
These assessments reduce the time burden of manually assessing risk profiles while improving underwriters’ ability to set premiums that accurately reflect each policyholder’s level of risk.
Accurately assessing customers’ risk profiles ensures fair pricing for everyone while automating the most time-consuming part of the process makes it less likely that another company will make an offer first. Long underwriting times increase the chances that a customer will sign with another company in the meantime, resulting in lost revenue and sunk costs.
5. Business Growth
The intelligent and ongoing use of data analytics should culminate in business growth. Targeted marketing messages, better customer satisfaction, less fraud, and faster underwriting can only translate into improved revenue.
By selling more effectively, cutting fraud-related costs, and improving risk assessment, companies that choose to harness the power of insurance data analytics improve their bottom line. Predictive analytics, in particular, can help companies identify money pits and mitigate them before they get out of hand.

5 Key KPIs for Insurance Sales
Insurance sales is traditionally a high-touch business. Even with the recent proliferation of self-service quoting tools, agents still drive a large proportion of insurance sales. It doesn’t matter how innovative a company’s products are, they’re only profitable if people buy them.
The insurance industry is no stranger to data and analytics, which have driven claims-related business decisions for decades. However, like the old saying, “the cobbler’s children have no shoes,” the insurance industry lags behind other industries in using team KPIs to measure company-wide performance.
Regardless of whether it’s inbound or outbound, here are five sales-related insurance KPIs you should be tracking.
1. Claims Ratio
Possibly the most important metric on this list for gleaning insights into profitability, the claims ratio KPI measures the number of claims against revenue.
Use this formula to calculate the company’s claims ratio:
Number of Claims in a Specified Period ÷ Policy Revenue for the Same Period
This is an important benchmark because a higher-than-normal ratio could indicate fraud, whereas a lower ratio could indicate procedural issues that are making it difficult to file claims. It can also help determine whether premiums should be raised on certain products.
2. Expense Ratio
This KPI compares total company-wide expenses to revenue over a specified period. Together with metrics like claim ratio and average payout per claim, expense ratio can help determine whether expenses should be cut or if premiums should be raised.
Use this formula to calculate the company’s expense ratio:
Total Expenses ÷ Total Revenue
Insurance is a complicated business, and it’s easy to lose sight of exactly what’s coming in and going out. Management should always know the company’s expense ratio, and act quickly if they notice an upward trend.
3. Quota Rate
Sales targets should ensure a reasonable rate of growth while being attainable. That’s where the quota rate KPI comes in. This KPI measures how well your sales reps are performing against their quotas, which can help sales managers set the right targets.
If everyone is hitting their quotas, the goals might not have been aggressive enough. Conversely, if everyone is missing their targets, the targets were probably too aggressive. While it’s good to challenge the sales team, setting targets too aggressively can be demotivating and lead to burnout. Use this KPI to drive decisions around quota setting.
This KPI can also help identify sales reps who could benefit from more training. If most reps are meeting their quotas while a handful of reps are constantly left in the dust, it might be time for some coaching.
4. New Policies Per Agent
While quotas tell a big part of the story, they aren’t the only indicator of successful selling. The new policies per agent KPI can highlight star agents who are selling an impressive number of policies but who might not be the department’s biggest revenue generators.
This KPI can give sales leaders a reason to celebrate success—and a reason to coach. If you're looking for ways to improve your sales team's performance, discover these 3 simple steps and how to implement them.
5. Claims Processed Per Employee
This is an efficiency metric that can provide insights into operational procedures, and help drive faster settlement times to ensure client satisfaction.
Use this formula to calculate the average number of claims each employee is processing within a given timeframe:
Number of Claims Processed in a Specified Period ÷ Number of Adjusters
Use this information to identify employees who might be causing bottlenecks, and offer them the necessary coaching and training. Underperforming claims adjusters increase operational costs while long processing times can lead to dissatisfied customers who will ultimately churn and potentially damage the company’s reputation through bad word-of-mouth.
Track Your Insurance Sales Progress with Plecto!
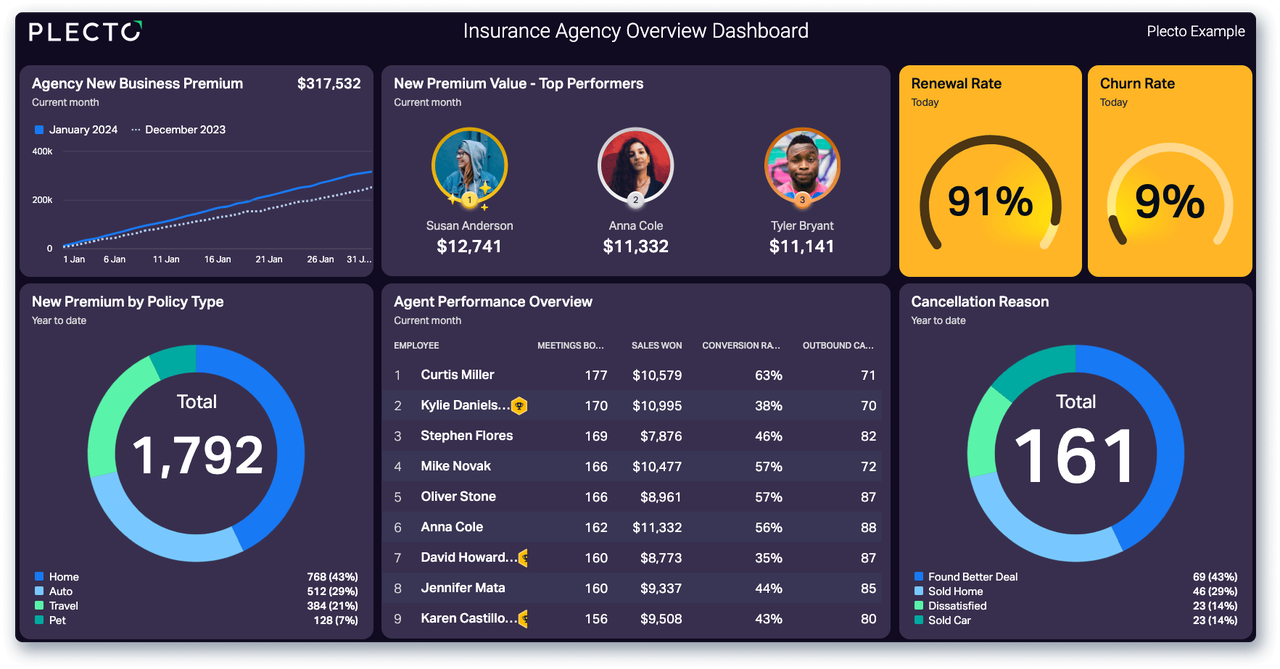
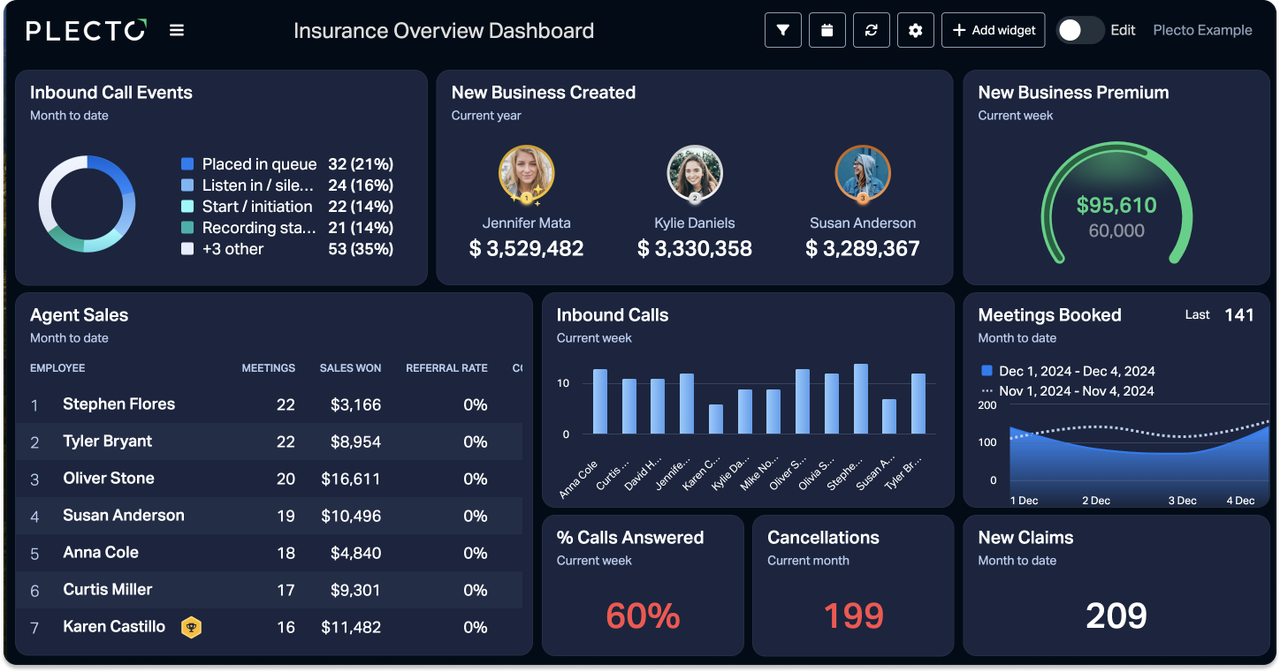
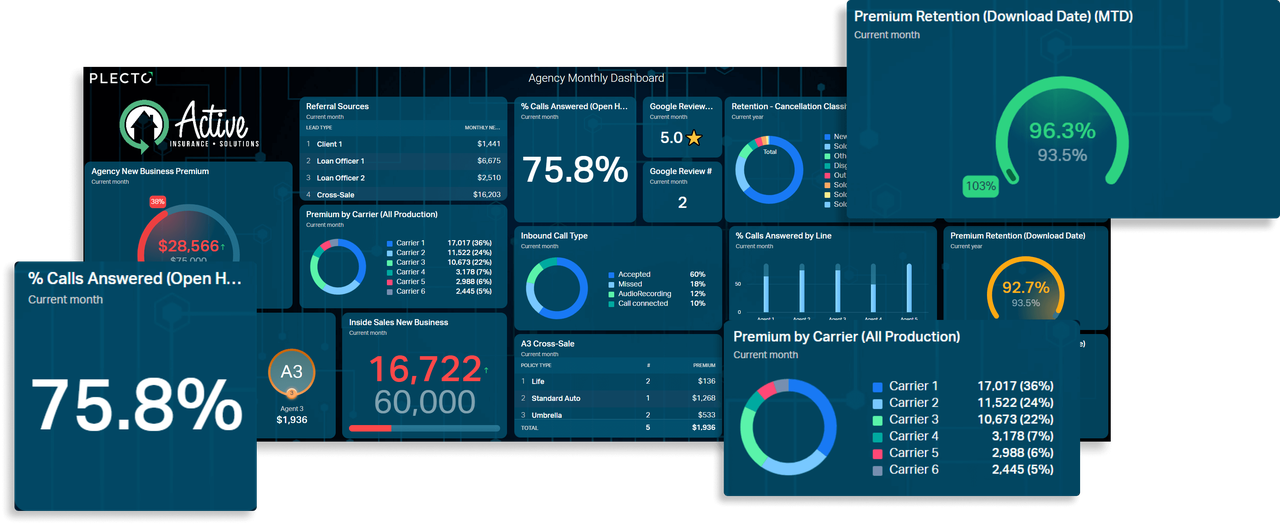
Become more efficient and integrate your CRM insurance agency data into Plecto dashboards! Track and monitor your chosen insurance sales KPI metrics and see real-time changes.
We've already discussed how having and updating your CRM can provide enormous benefits to your business, but by combining it with Plecto, your insurance sales will skyrocket.
At Plecto, we integrate with over 100+ systems, including some of the biggest CRMs, and all the data can be converted into engaging dashboards. Design your dashboard as you wish and add powerful widgets to help you track your insurance selling progress.
Thinking about how to sell insurance products more effectively? Motivated employees are the key to sales success! Add gamification elements or sales contests to spark a competitive spirit and add rewards for bringing more motivation.
Additionally, we have a practical feature for your business: automated reports, which can be scheduled and made when you need it with only a few clicks.
Start improving your insurance selling now!
Try out all the features; it will change your perspective on how to increase insurance sales! Sign up for a free demo to notice the increase in your insurance sales!
Start your 14-day
free Plecto trial today.
IVETA BALTRUKENAITE
Content Writer