


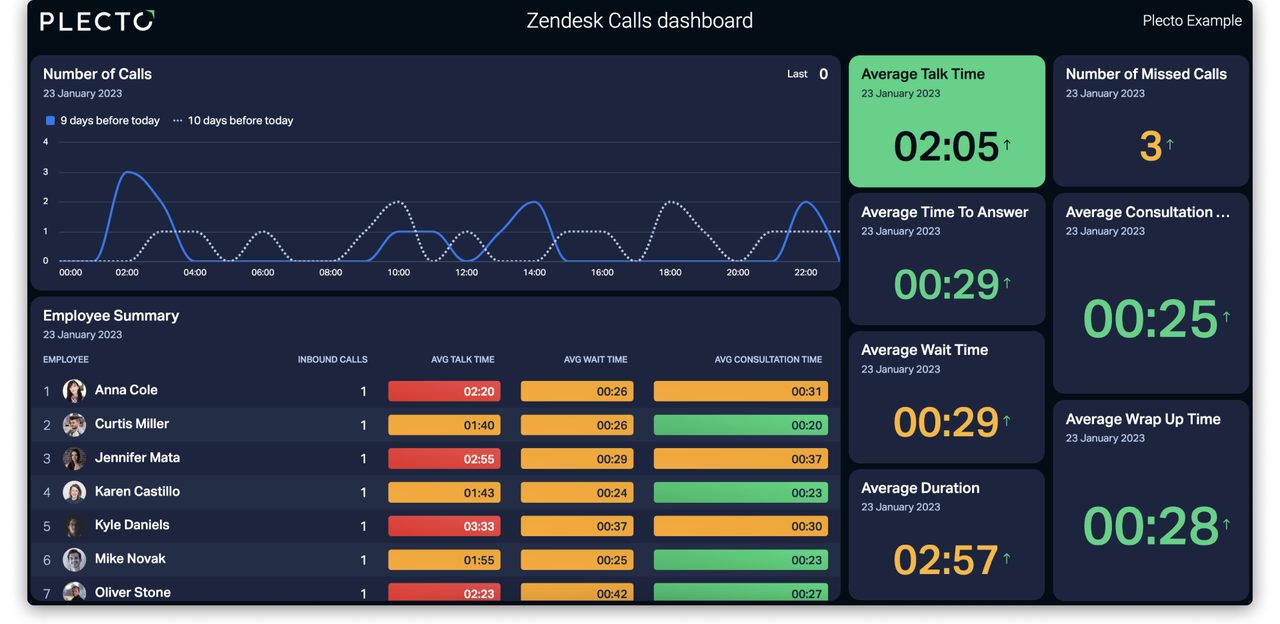
Call center team overview
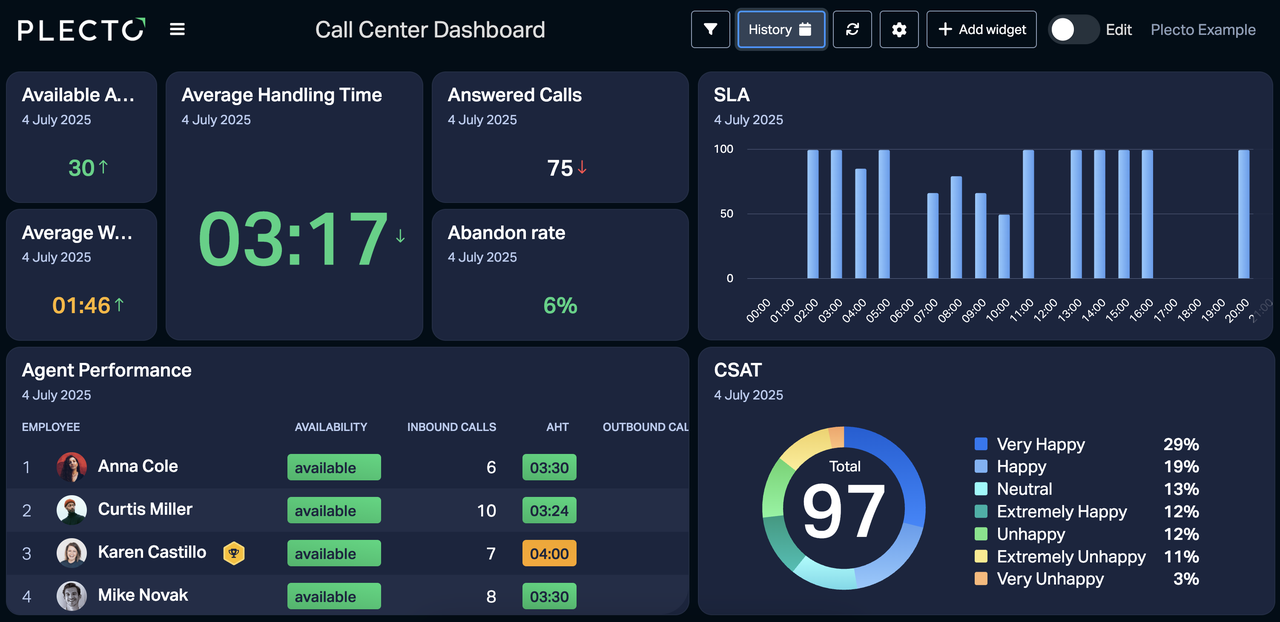
Benefits of using call center dashboards
Never miss a beat (or a call)
Real-time dashboards visualize live data, keeping call center teams informed to manage volume effectively.
Engage and reward your agents!
Plecto’s gamified dashboards combine individual and team views, showing agents how they drive collective success.
Optimize operations with unparalleled real-time data insights
Gain a long-term perspective on your call center. Use our automated reports to dive deep into your data.
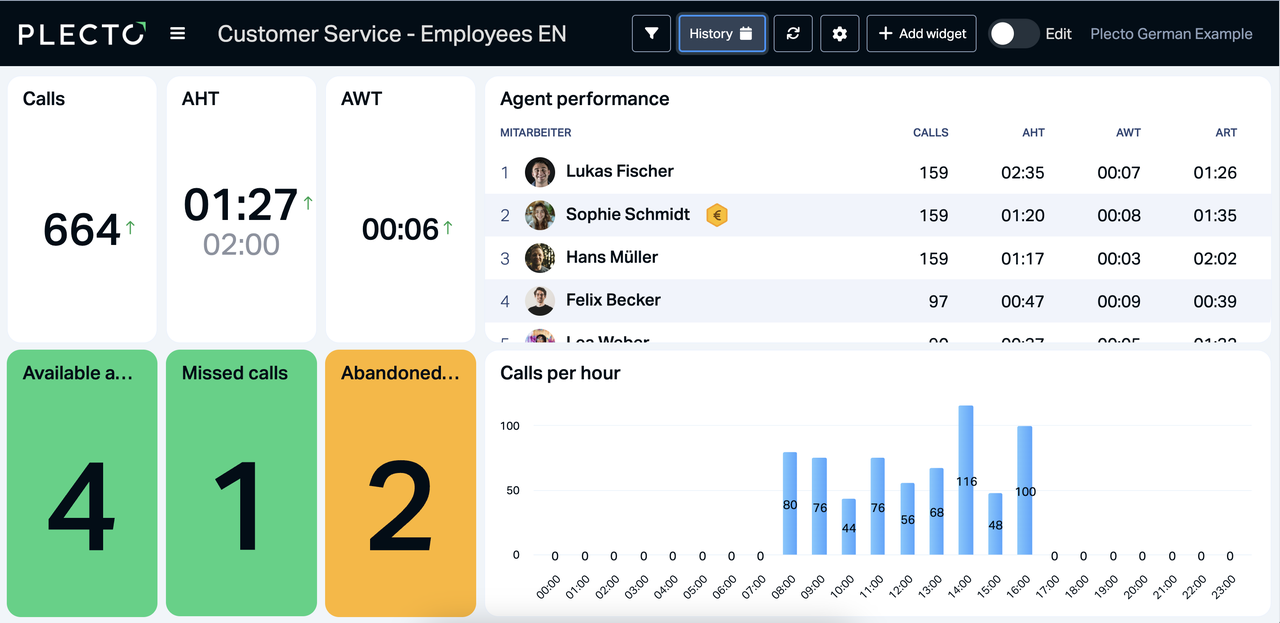
Essential KPIs for all call centers
In a call center, it's best to include metrics that can change by the minute and can impact your service levels. Here are a few essential metrics that every call center should track:
Average Handling Time
AHT measures the average duration of a customer’s interaction with an agent.
Average Wait Time
Calculates the average length of time for a customer to get through to an agent. Sometimes referred to as average time in queue.
Abandonment Rate
This metric calculates the rate ends of the call before connecting with an agent.
Calls Taken
Measure the productivity of your agents by tracking how many calls have been answered.
Service Level Agreement
Service Level Agreement (SLA) measures how well your support agents are meeting the agreed on standards.
Customer Satisfaction Score
It's always great for your call center staff to know how happy your customers are!
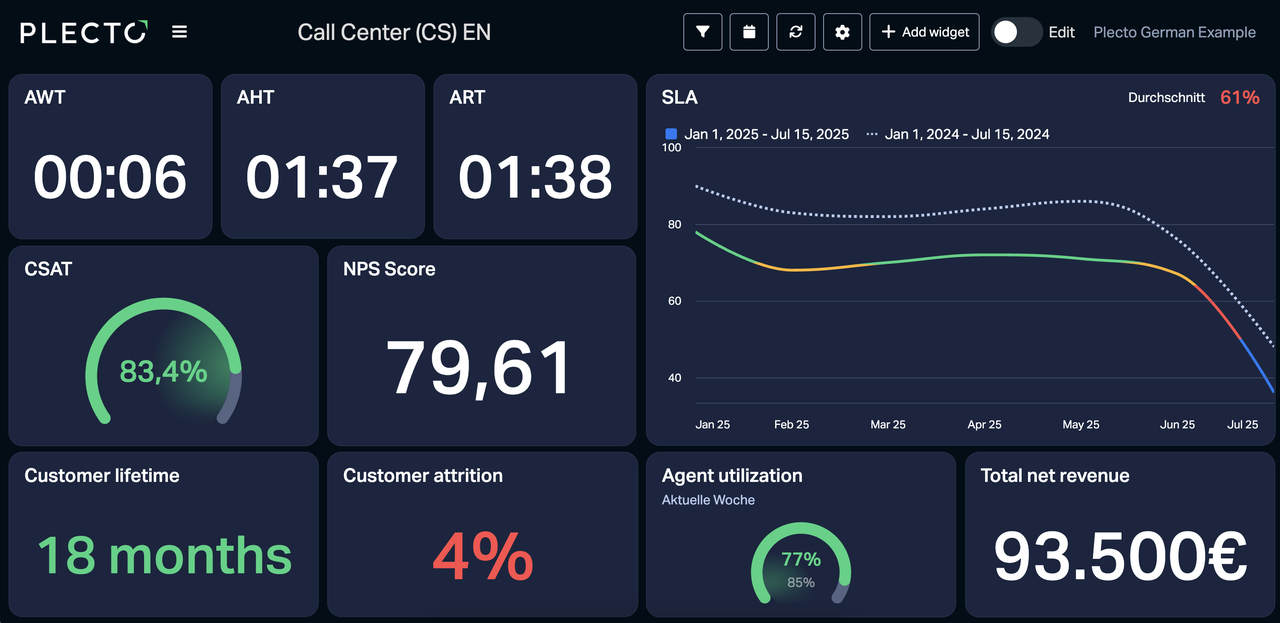
CEO call center dashboard example
Need a high-level overview you can get at a glance? This one's for the top tier to look at without having to wait until end-of-month reports. This dashboard shows the most important metrics reflecting operational efficiency, revenue goals, and customer satisfaction for you to gauge your call centers current and future health.


Lennart Thomsen
System Responsible at REMA 1000
"Our response time has improved a lot since using Plecto. We went from around 5 or 6 minutes to at times half a minute, and approximately 3 minutes now."
Read more
Sign Up