Introduction
Data visualization is Plecto’s bread and butter—after all, it is a data visualization platform! We’ve previously covered different aspects of data visualization here and here, but a big question remains: why is data viz so important anyway? What’s the big deal behind it all?
It’s a good question, and there’s a few good answers to this question. They cover three main standpoints: a scientific one, a business-focused one, and a logistics-focused one.
Data visualization is an extensive subject that’s worth a serious deep dive. So buckle up–we’ll take a closer look at the importance of data viz together.

Data viz: The science standpoint 🧠
First and foremost, data viz has scientific backing. This isn’t just a marketing gimmick or exaggeration—it’s the truth!
Studies of the human brain have shown that up to 90 percent of the information it processes is visual in nature. That’s astounding—and even crazier is the speed at which our brains process visual information: just 13 milliseconds. For all intents and purposes, that's instantaneous.
What about textual information? Based on this information, you won’t be surprised to learn (or maybe you will!) that the brain processes visual data 60,000 times faster than textual data.
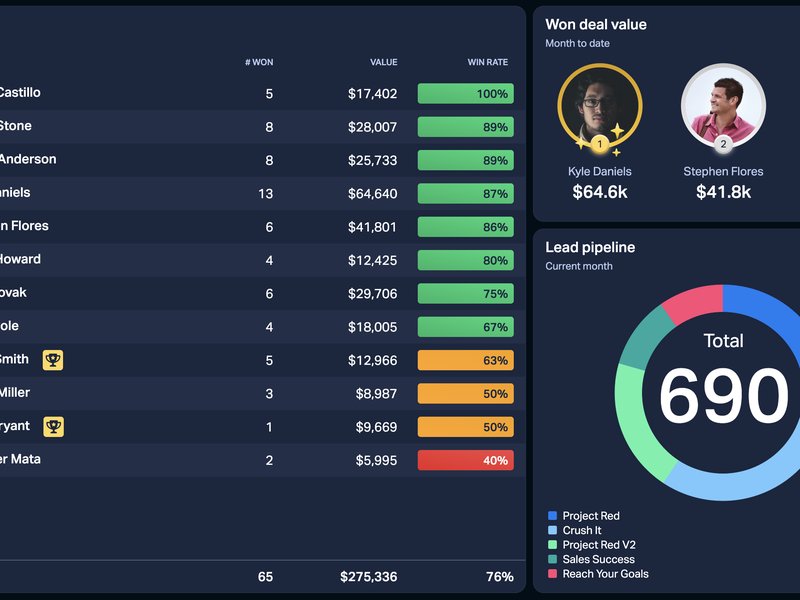
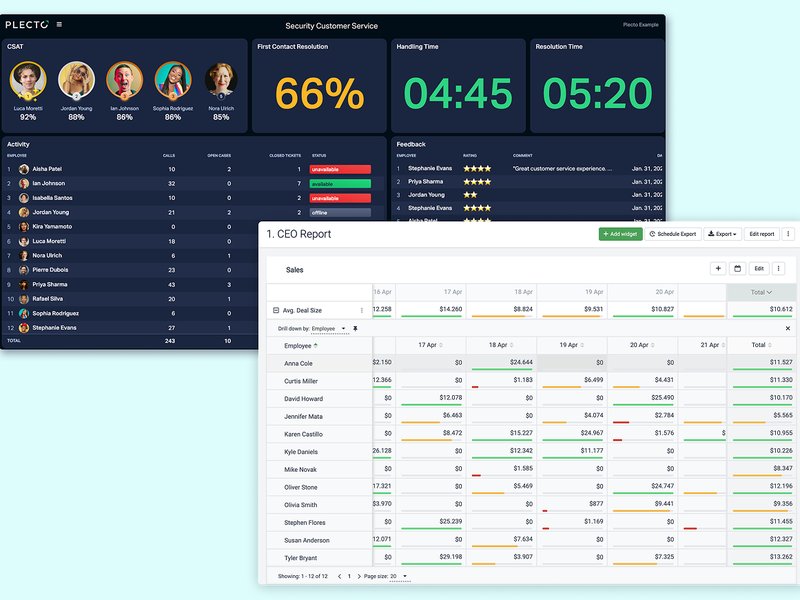
With all of this in mind (literally) it’s obvious that visualizing data has tremendous impact, far more so than relying on text alone. You can start to see how using a dynamic dashboard that incorporates different colors, shapes, and other visually engaging components is far more effective for tracking and displaying data than a simple Excel spreadsheet, for example.
Data viz: The business standpoint 💶
Data viz is big business. One estimate currently values the industry at $10.6 billion. Much of this value has been the result of rapid growth: it’s also estimated that the data viz industry has grown by $3.0 billion from 2021 to now (2025).
It’s clear that many if not most companies see tremendous value in visualizing data. Three decades into the twenty-first century, it’s also becoming clear that data viz is riding the wave of the future, and will be an essential component of every corporate toolkit for a long time to come.
So it shouldn’t be surprising to note that businesses who fail to implement a comprehensive data viz strategy will be at a severe disadvantage—unable to keep track of their data efficiently, while losing out on clear communication with their employees and stakeholders too. In short, they’ll be left behind in a rapidly evolving digital landscape.
Even beyond business efficiency, data visualization also reflects values of transparency, openness, and personal accountability—all trademarks of a modern office culture, rather than the “taskmaster” paradigm of the past.
It’s clear that prioritizing the direct communication that data visualization platforms provide is key to maintaining an effective workplace in this day and age. Utilizing data viz in the office isn’t just good for your brain—it’s an important way of staying abreast of the changes occurring in workplaces across the globe.
Build your first dashboard.
Start your 14-day free trial today
Data viz: The logistics standpoint 💡
Data visualization as good logistical practice is probably the most important point of this list. Here’s just a few ways that data viz optimizes operations across your office:
Data accessibility
When you visualize and display data, it’s typically available to all. This allows your employees to stay focused on their numbers, the “Holy Grail” of call centers, by measuring their own performance against a given benchmark, and being able to immediately observe relevant stats in real time.
In having transparent and accessible data readily available for everybody, employees can see how their individual efforts impact larger goals and company results.
Employee empowerment
Self-learning, self-motivation, and teamwork are critical skills in developing a successful team. Having performance data publicly available allows your employees to monitor their progress and take the initiative of determining where to focus their efforts. Some questions employees might ask themselves when data is publicly available are…
- “Have I been on the phone too long?”
- “Have I met my daily call quota?”
- “How many calls have I converted to meetings?”
Asking—and answering—these questions prompts your employees to take ownership of their performance.
A sales agent, for example, who sees they’re spending too much time on the phone can focus on reducing their average call duration by making or taking more calls. For this reason, it becomes increasingly likely that the agent will be able to convert more calls to conversions.
Ultimately, visualizing data on dashboards allows employees to see their performance as it happens. They can respond to the ups and downs of their current activity, rather than relying on their managers to keep them up to speed.

Coaching and course correction
Using data to coach employees and correct problems before they become too large is another key component of data visualization. Doing so means everyone in the office can stay on target and improve their numbers on a teamwide basis. Coaching can occur either via one-on-ones, or by on-the-fly feedback.
Consider this example: it’s just before lunch on a Wednesday. Looking at the office dashboard, a manager notices that a certain sales rep has made far fewer calls than at this same time one day ago. Knowing this information, the manager might want to quickly chat with the rep about the recent lack of calls. This course of action is made in a timely manner, before real challenges arise and performance turns sour.
Optimizing strategy
Finally, data visualization gives managers the ability to immediately grasp the high-level KPIs that impact your company’s growth and direction.
In a sales context, for example, you’re likely interested in overarching, team-based KPIs such as actual sales revenue, pipeline revenue, percentage of deals won, and average revenue per account (ARPA). Because these KPIs create a “big picture” of your team’s performance, they help guide strategic decisions and enable your team to hit planned goals.

Conclusion
The fundamental purpose of data viz is to easily identify and focus efforts on the metrics that matter: those that lead your team toward hitting goals.
While visualization simplifies your KPIs and keeps agents notified about their performance, employees are more likely to act on these insights if presented in a motivating, friendly, and competitive way—in other words, through gameplay, better known as gamification. (More about that here.)
At the end of the day, in our currently uneasy economic climate, data dashboards are no longer a mere “nice-to-have,” but rather an essential tool, for both sales and CS call centers to gain a competitive advantage. Data visualization is more crucial than ever, and dashboards are the tool to bring your data to life. Start your journey into data viz with Plecto’s free two-week trial today.

Want to know more about the importance of data viz in the call center?
Check out Plecto’s newest FREE ebook, The Winning Formula for Selling More in the Modern Call Center. Download here!

JAMES NIILER
Content Specialist
An in-house content writer and specialist at Plecto, James brings an academic touch and journalistic flair to his marketing copy. Having worked and studied on both sides of the Atlantic, James is a great believer in the importance of communicating across cultures and industries. Catch his work here on the Plecto blog, or as a guest contributor on other B2B websites.