Identify where the new business is coming from with a real-time dashboard for tracking sales revenue.
Who looks at it
Sales Managers, VPs the CEO, CFO as well as individual members of the sales team.
Focus area
How much new business you have closed over a set period of time.
Purpose
This dashboard is essential for keeping tabs on your sales pipeline.
What integrations are used

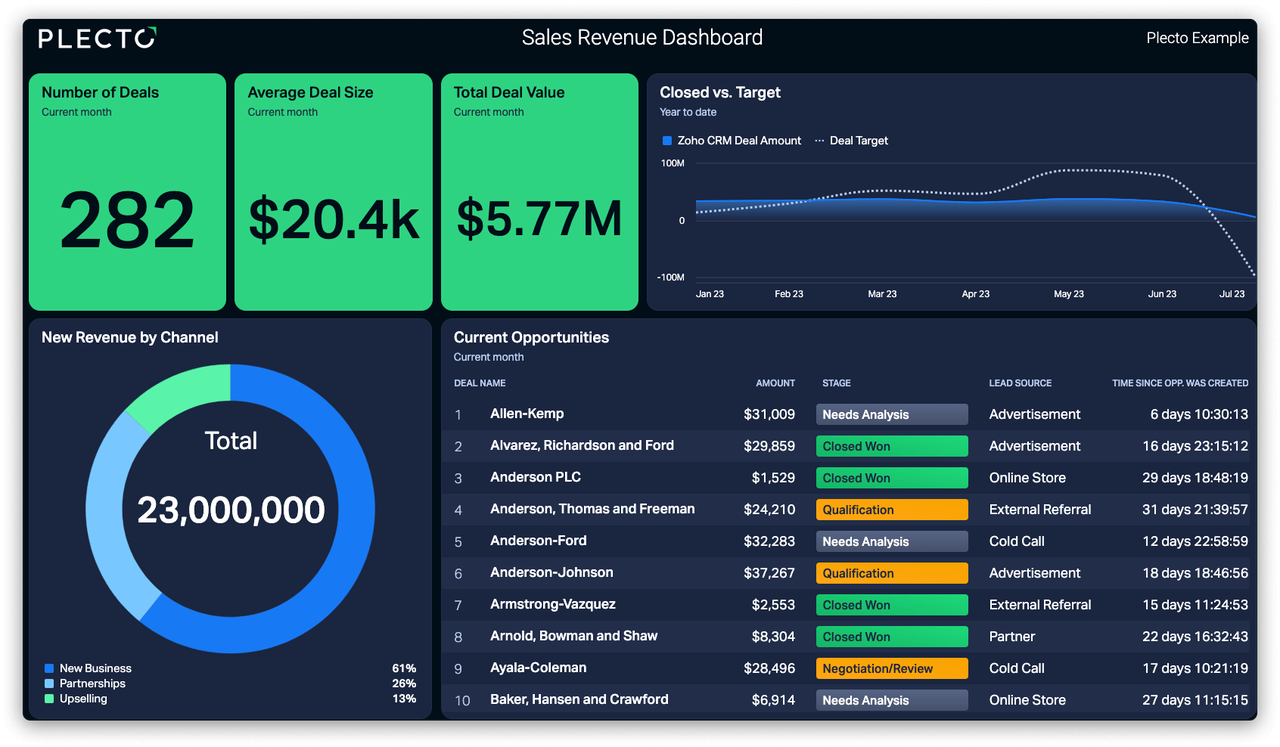
Sales is ultimately a numbers game - and that's why this dashboard is so important to your sales operations. The sales revenue dashboard focuses on your pipeline and its purpose is to give you a high-level overview of how much new business your team is generating.
Unlike some of our other sales dashboards, which focus on agent performance, this dashboard concentrates on the bottom line of sales - namely, how much money your business is making.
The raw number of deals that have closed over a specific time period.
The average value of closed-won deals.
The total amount of new business that your sales team has generated.
Also called Closed-Won vs Target, this KPI measures whether your team is hitting the budget over a period of time.
This broad KPI provides the overview of deals in the pipeline, including the value, the stage, where it has come from and how long ago the opportunity was created.
See which channels are bringing in the most revenue.
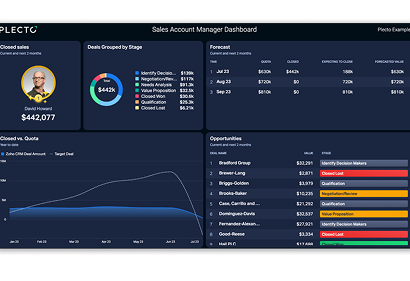
Keep on top of your prospects and customers with real-time account manager dashboards.
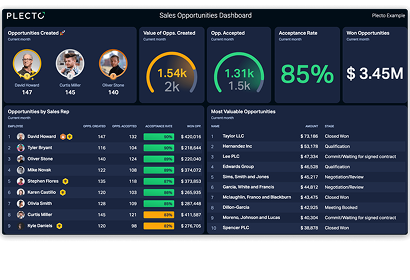
Get full insight into your sales pipeline with real-time sales opportunities dashboards.
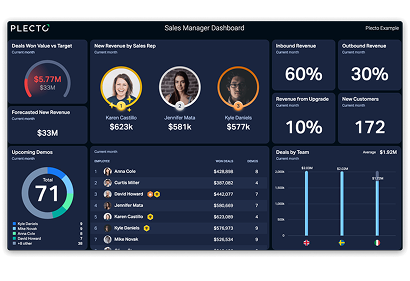
Smash your sales targets with a sales manager dashboard. Get actionable insights into your team’s performance at a glance.