Sales Opportunities Dashboard
Track your sales opportunities in real time with dynamic dashboards
Stay informed about every stage of your sales pipeline with up-to-date dashboards.
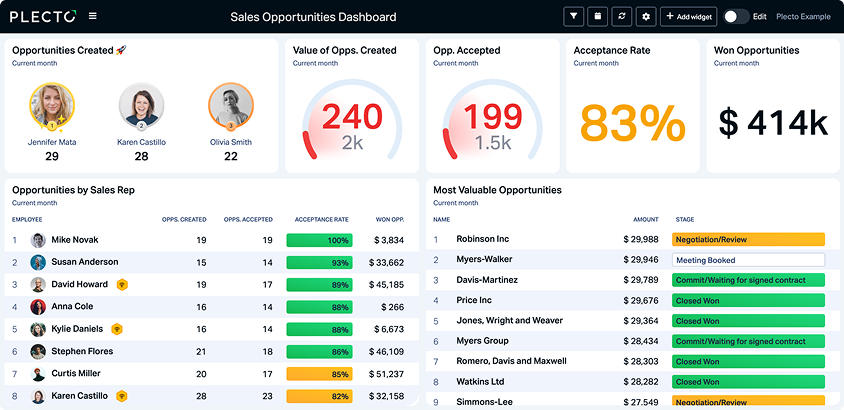
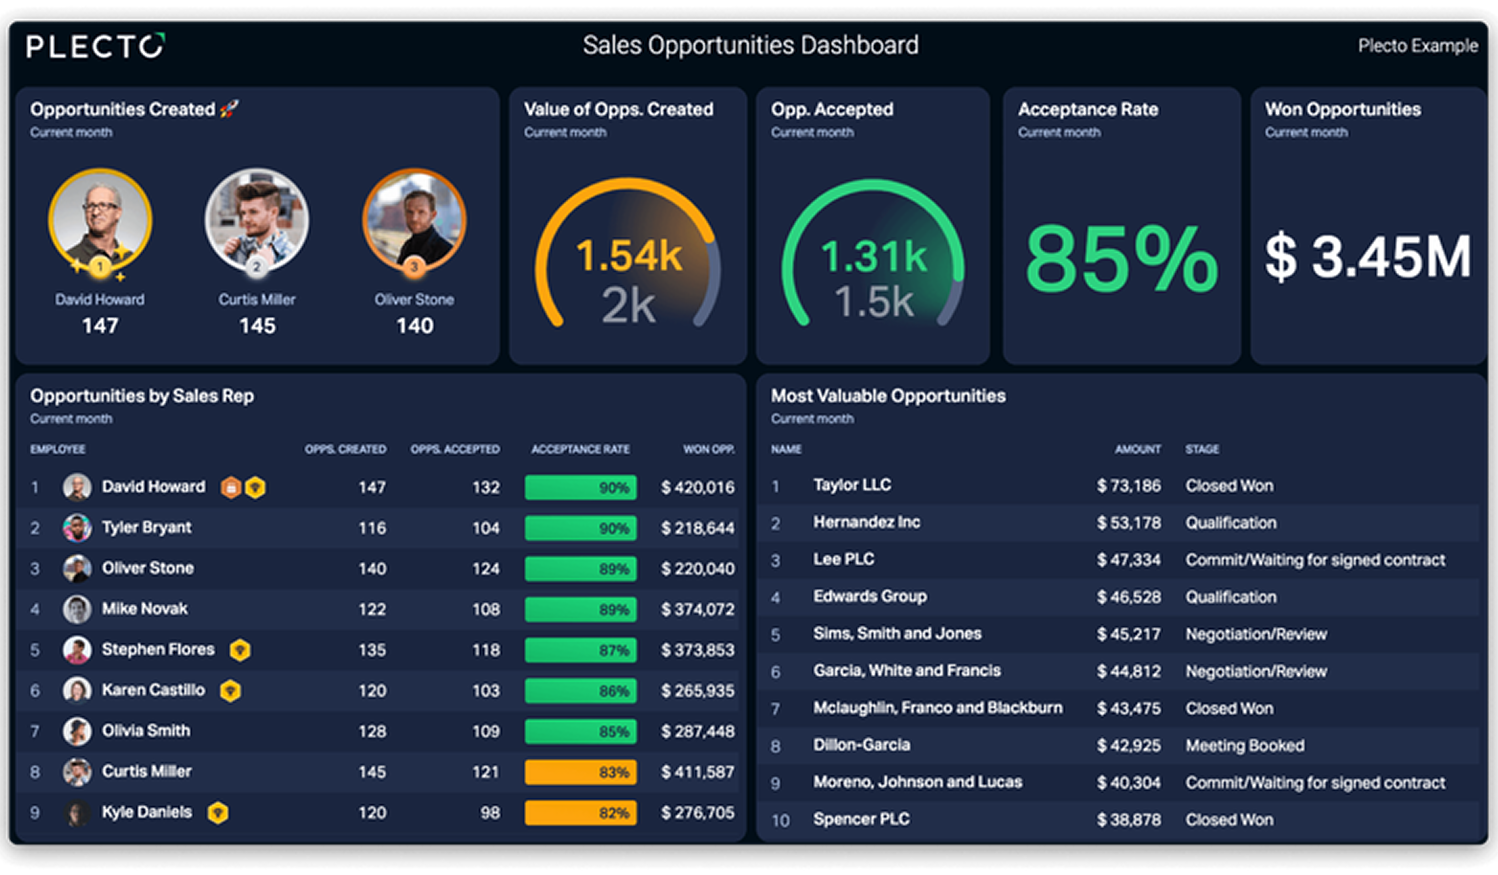
Display your sales opportunities on real-time dashboards
This is what your dashboard could look like too. Try to make one today!
Learn to show your sales opps on real-time dashboards.
Explore an interactive virtual demo on our site. Or book a personalized demo with a Plecto expert.
Boost sales performance with an opportunities dashboard
Want to know more? Here are three more benefits that this dashboard will bring to your sales team.
Motivate your team to close more deals
Visualize deal status and value in real time so reps instantly spot high-impact opportunities and focus effort where it drives the biggest wins.
Improve sales forecasting
Get a clear, prioritized view of your pipeline—see which deals are worth the push, reduce noise, and accelerate confident, revenue-driving actions.
Work more efficiently
One dashboard, total clarity: track health, size, and momentum of every opportunity to align your team and fast-track the deals that matter.
KPIs to include on a Sales Opps. dashboard
A good sales dashboard should track the entire opportunity process, from new deals to closed ones, showing both pipeline value and agent performance. Here are key metrics to include:
Value of Opportunities Created
This KPI measures the estimated value of opportunities that have been created.
Number of Opportunities Created
Tracks the raw number of opportunities created over a certain period of time. It's a good idea to split this by individual rep or team to celebrate your top achievers.
Acceptance Rate
Calculates the percentage of leads that have been qualified by the sales team.
Most Valuable Opportunities
Dig a little deeper into your opps. by measuring the estimated deal size by company and what stage they are at.
Opportunities by Sales Rep
Measures the performance of your sales team by digging into individual performance metrics.
Won Opportunities
As the name suggests, this KPI calculates the value of opportunities that have already been converted.