
Table of contents:
The Ultimate Telecom Performance Guide
Telecom is one of the most competitive industries in the world – and it also has some of the highest churn rates. With the odds stacked against them, telecom companies expecting to thrive in the future must keep a close eye on how their sales and customer service teams are performing.
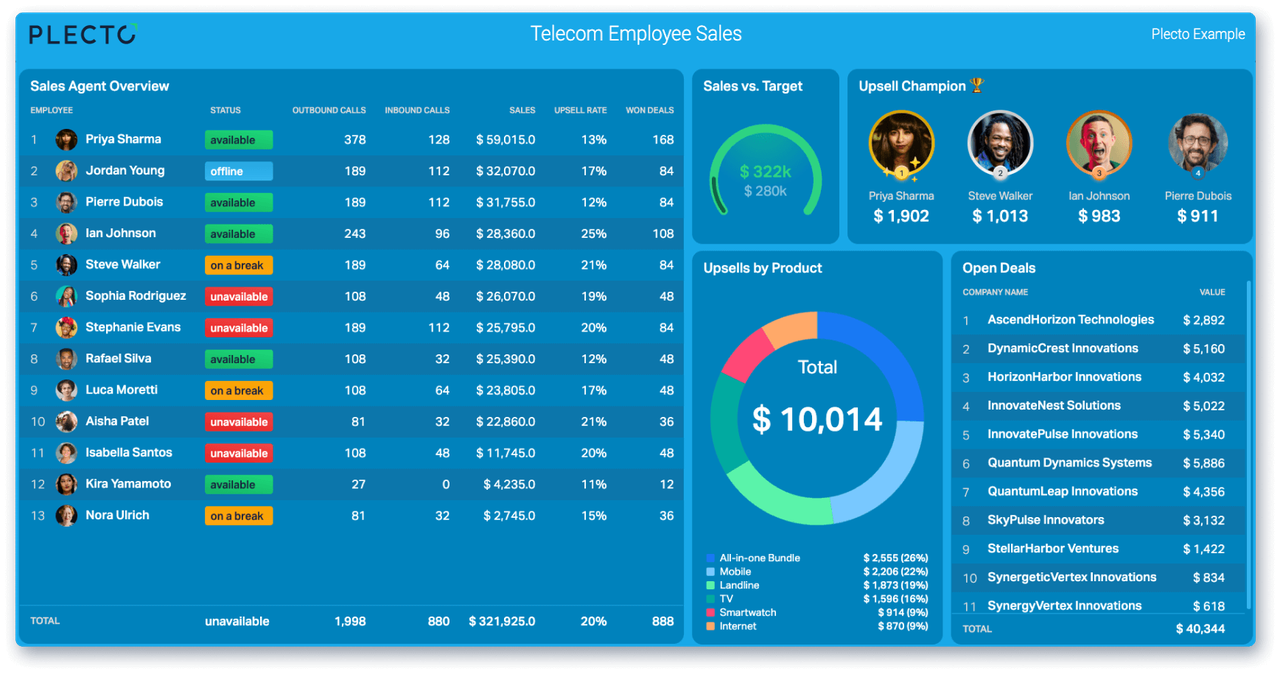
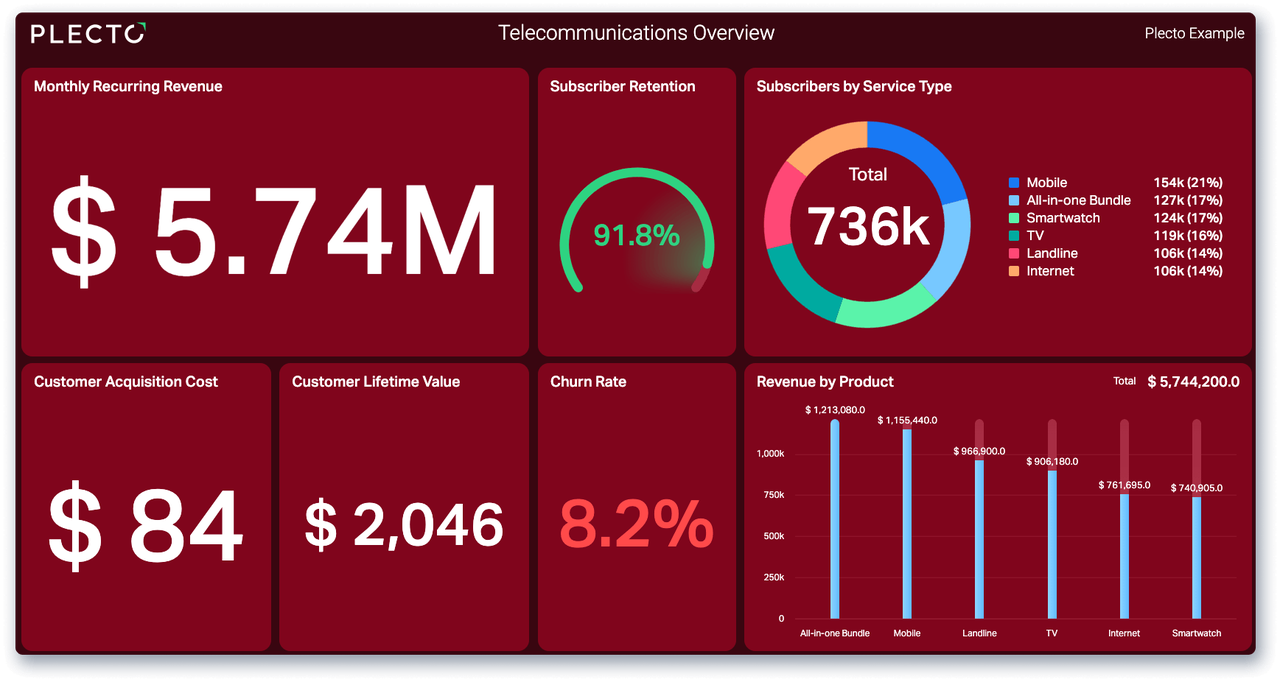
One of the most effective ways for telecom companies to drive performance is by tracking key performance indicators (KPIs) on a telecom KPI dashboard. This article goes over several of the most critical aspects in keeping track of your telecom performance data. We identify the most important telecom key performance indicators for your business, suggest five KPIs to track, and describe five ongoing telecom data trends applicable both now and in the future. Let's dive in!
How to Identify the Most Important KPIs for Your Telecom KPI Dashboard
The main objective of tracking KPIs is to become more data-driven in how you do business. This requires looking at your company from the outside in – in other words, seeing your company through your customers’ eyes.
Once you’ve identified the most relevant telecom key performance indicators for your company, you’ll be able to set up your telecom KPI dashboard.
These two questions are an excellent starting point for creating your KPI strategy:
1. What do customers like least about your company?
A deep dive into your CRM and online reviews should reveal common points of dissatisfaction among your customers. Telecom customers are often frustrated by things like service outages, billing and contract issues, long wait times for customer service or service calls, and value for money. Once you know what’s making your customers feel dissatisfied, you can set telecom key performance indicators to improve.
2. What do customers like most about your company?
While customers are more apt to contact customer service or leave a review when they’re dissatisfied, you should also be able to glean insights from online reviews and your CRM into what you’re doing well. Maybe your customer service has a high satisfaction rate, you quickly resolve service disruptions – or your service rarely goes down. Knowing what you’re doing well can help you benchmark and set KPIs to ensure you maintain these benchmarks as your minimum level of service.
5 Examples of Telecom KPIs
If you don’t have the time or resources to invest in KPI telecom definition as described above, these five telecom key performance indicators are an excellent starting point.
1. Net Promoter Score (NPS)
We’ll start our list of telecom key performance indicators with NPS, which measures your company’s customer loyalty based on one question, “On a scale of 1–10, how likely are you to recommend us to a friend?”
Customers generally fall into three groups:
- 0–6: Detractors, who are dissatisfied with your company and who are likely to share their negative experiences online and by word of mouth.
- 7–8: Passives, who are unlikely to say anything positive or negative about their experiences with your company.
- 9–10: Promoters, who are extremely satisfied with your company and who are likely to share their positive experiences online and by word of mouth.
To calculate your company’s NPS, subtract the total percentage of detractors from the total percentage of promoters.
While you may be familiar with general NPS benchmarks, it’s important to note that NPS scores tend to be lower for telecom vs. other industries.
Here are some NPS benchmarks for the telecom industry:
- -10–0: Average
- Above 10: Strong
- Above 30: Extremely Strong
Instead of an excuse to justify a low NPS, ambitious companies should see this as an opportunity to outpace their competition. Even a small boost in NPS could lead to word-of-mouth referrals that can really spur sales growth – and maybe even win back some of your company’s previous detractors!
2. Average Customer Satisfaction Score (CSAT)
Similar to NPS, CSAT is measured based on one question, “On a scale of 1–10, how satisfied were you with our service?” Average positive customer service ratings vary by channel, but here are some benchmarking guidelines. If certain channels consistently have a low score, a survey could help you get to the bottom of why that is.
Especially in the telecom industry, customer service can make or break customer retention. Across the board, 50% of customers say they’d take their business elsewhere after one bad customer service experience, pointing to poor customer service as one of the main reasons they’d switch companies. If you’re serious about providing world-class customer service to improve retention, read this article to discover the 15 customer service KPIs you need to be tracking to provide the best service at the lowest cost.
3. Churn Rate
In the hyper-competitive telecom industry, long-term success is largely based on the company’s ability to retain customers. Some experts estimate that the cost of acquiring a new customer is six to seven times more than retaining an existing customer.
Estimates also suggest that increasing customer retention by just 5% can increase profitability by up to 75% because upsells and renewals contribute 75–90% of most companies’ revenue vs. just 5–30% from the original sales. With this in mind, it’s imperative to understand your company’s churn rate.
Use this formula to calculate your company’s churn rate:
Number of customers lost during a specific timeframe ÷ Number of customers at the beginning of the same timeframe = Churn Rate
An annual churn rate of 5–7% is to be expected, but anything beyond that should trigger a closer look into why customers are leaving. Check out this article for 5 important KPIs for account managers.
4. New Business Revenue
While existing customers are the main source of revenue for telecom companies, you can’t generate recurring revenue without recruiting new customers. This telecommunications key performance indicator tracks how much income your company is generating from first-time customers. For maximum insight, track this KPI monthly against a target percentage (e.g., 35% of revenue should come from first-time customers).
5. Repeat Business Revenue
Another important telecommunications key performance indicator, this one tracks how much of your company’s revenue comes from its current client base. In telecom, this metric often includes recurring subscription revenue as well as revenue from cross-sells and upsells.
This important KPI can help you identify your highest-revenue products, so you know which offerings to upgrade or expand in the future. Like the previous KPI, this one also is best tracked monthly against a target percentage (e.g., 65% of revenue should come from existing customers).
Check out these 21 sales KPIs to add even more revenue-driving insights to your telecom KPI dashboard!
Start your 14-day
free Plecto trial today.
5 Ongoing Trends in the Telecom Industry
Even before the current economic downturn took hold, telecom was one of the most competitive industries in the world with one of the lowest customer retention rates worldwide. Experts say that the economy is expected to worsen before it improves, making it more important than ever for telecom companies to stay abreast of current trends in telecom industry.
Future telecom success will largely hinge on a company’s ability to deliver outstanding service and value for money. From nitty-gritty tech to better customer retention, these five trends are making big telecommunications news and are set to shape the industry in 2026 – and beyond!
1. Great Strides for 5G
While 5G has been around for several years, it has yet to be used to its fullest potential. Up until now, most telecom companies have used their existing infrastructures, offering 5G in tandem with 4G. One of the most noticeable 2024 trends in telecom industry will begin to see 5G offered as a standalone service.
As a result, consumers will continue to enjoy the speed of 5G and begin to see the rollout of new apps and digital services offering greater security and stability than was previously possible. For the first time, telecom companies will start monetizing 5G and begin to recoup their investments in this technology.
2. Cloud Computing Will Hit Primetime
Cloud computing isn’t new, yet most telecom companies still rely on private data centers to host most of their IT infrastructure. This will change in the future of telecommunications as companies migrate essential infrastructure to the cloud. This migration will improve scalability and help telecom companies respond more effectively to demand fluctuations.
This scalability will also enable these companies to bring new services to market more quickly, and assess demand before making huge and unrecoverable infrastructure investments in products that don’t gain traction. This will be especially important in the context of 5G as new apps and digital services enter the marketplace amid an economic downturn that can significantly impact customer demand. In addition, cloud computing stands to boost profits by drastically cutting costs related to data center staffing and on-site hardware.
3. AI-Assisted Customer Service
A staggering 50% of customers say that one bad customer service experience is enough to make them switch providers. As telecom companies struggle to differentiate themselves in a crowded and highly competitive industry, an emerging trend in telecom industry will be to provide best-in-class customer service.
This presents a huge opportunity for future telecom providers to use AI-enabled predictive behavior analysis to automate CRM, improve personalization, sharpen customer segmentation, and more accurately identify customers who are about to churn.
4. Machine Learning- and AI-Assisted Network Operations
In addition to helping telecom companies improve their customer service, AI algorithms will be used in combination with machine learning to help telecom companies provide better service and performance.
Future-looking companies will use this powerful duo to optimize their network traffic by predicting usage patterns, and adapting and reconfiguring networks to respond to fluctuating usage demands.
Some companies will also use AI to detect and self-repair network issues, and others will use it to nip fraudulent activity in the bud by detecting security breaches, such as unauthorized network access or service theft via stolen passwords and user profiles.
5. Increased Cyberattacks and Data Breaches, Leading to Better Cyber Security
Cybersecurity has been top-of-mind in the industry for years, and it will continue to be one of the dominant trends in telecom industry in 2026. Some experts predict that we’ve only seen the tip of the iceberg when it comes to cyber-attacks and data breaches, expecting that the proliferation of 5G will usher in a new era of security threats from hackers, corporate espionage, and uneducated users (e.g., poor password management, phishing links).
Telecom companies are particularly vulnerable to cyber-attacks because of the breadth of sensitive data that’s stored on their networks. In order to protect their future reputations, telecom companies will have to ramp up their cyber security efforts.
Savvy companies will amp up their threat detection along with their incident response methods and prevention measures, with many turning to Blockchain as their chosen solution. Companies using Blockchain will vastly improve the security of their operations with third parties while reducing costs and increasing revenue from new services offering state-of-the-art security.
What Is Telecom Data Analytics and Why Is It Important?
Data collection and analysis are critical components of any business success. In the telecom industry, some of the common data points include call volume, call duration, network traffic, user behavior, and much more. Telco analytics must serve as a foundation for creating and implementing new strategies that will have a long-term impact on the industry's future success and create competitive advantage for telecom companies.
In this industry, you must follow one golden business rule: innovate constantly! The market is constantly changing, and you must be faster than others if you want to shape the industry and continue growing. Making data-driven decisions by using data analytics is now critical for future telecom business success.
1. Customer Behavior Analysis
Customer behavior analysis is crucial if you want to increase sales and recommend more tailored solutions to your clients. By analyzing customer behavior in the right way, your telecom company can attract new customers and retain your existing ones.
To obtain the full benefits of telecom analytics, you must first track the appropriate telecom KPIs. However, keep in mind that each customer is unique, so it would be favorable to divide them into separate segments.
Segments can be categorized by age, gender, usage level, and other unique requirements. If you prepare telecom analytics, you will be able to make predictions about possible customer cancellations. The following reasons can vary: poor network performance, customer service, and better offers from competitors.
When you collect the right data, you can make accurate predictions about the future, which lets you know how customers’ behavior will be likely to change.
2. Sales Growth
The telecom industry is saturated, so each company must discover new strategies to stand out. Personalization is the most popular value offered by all businesses.
The telecommunications data can provide useful insights into the profiles and preferences of each client segment. This will enable you to conduct targeted marketing, which will exponentially increase your conversion rates and customer retention. Increased sales volume allows you to be more competitive in the market and change your pricing strategies.
3. Network Performance Analysis
Effectiveness, speed, and security are crucial for customers of telecom services. Telecommunication services are an integral part of customers' daily lives, and they expect telecom operators to provide quick, reliable, and high-quality service.
Telecom analytics tools provide an overview of the status of their network. You can measure critical telecom metrics that can be used to assess overall performance, such as network latency, packet loss, and MOS score.
Using telco analytics data to figure out how well the network works as a whole, your telecom company can grow and improve its network setup to better serve its customers. Rapidly responding to market demand changes will increase your telecom company market impact.
4. Fraud Detection and Prevention
Technology and communication evaluation not only make our lives easier, but they also pose new risks to the telecom business. Although fraud levels are reducing year after year, it still has a harmful impact on customers and brand image.
Even with lowering fraud levels, the telecom industry currently loses between $4 and $6.1 billion per year. It's a very important risk that could cause your company to lose a lot of money, so you should think about all the ways to protect against it.
Correctly utilizing analytics in telcom can help reduce the risk of fraud. Telco analytics can reveal anomalies that can detect unusual behavior. Even data that may seem standard, such as call records, device data, location data, and call records can all be used to identify fraudulent behavior and thereby minimizing any financial losses.

5. Cost Optimization
Operational costs for the telecom industry are high, including various daily operations such as maintaining networks, new product development, expenditure on staff and much more.
Failure to monitor cash flow can lead to poor financial management and decision-making. Maybe your telecom company's operations need to be streamlined? For example, you need to take into account that some services or goods might no longer be in demand.
With telecom analytics, you can increase your productivity and efficiency. Being able to optimize your costs can benefit the development of innovations. This might enhance your market position and expand your customer base.
Note that additional cutoffs can boost your bottom line and improve resource management, so if you make the right decisions, you may increase your net profit significantly!
Build Your Ultimate Telecom Performance Dashboard with Plecto
Start your 14-day
free Plecto trial today.
Q&As
Why is a high Churn Rate particularly dangerous in the telecommunications industry?
In telecom, customer retention is the primary driver of profitability. Experts estimate that acquiring a new customer costs six to seven times more than retaining an existing one. Furthermore, existing customers account for 75–90% of revenue through renewals and upsells. A high churn rate—anything significantly above the industry standard of 5–7%—not only represents a direct loss of recurring revenue but also forces the company into an expensive and difficult cycle of constant new customer acquisition just to maintain its current size.
How does NPS (Net Promoter Score) benchmarking differ for telecom compared to other industries?
While a "good" NPS is generally considered to be above 30 or 50 in many sectors, telecom scores are traditionally lower due to common industry frustrations like billing issues and service outages. In telecom, an NPS of -10 to 0 is considered average, while anything above 10 is strong. However, ambitious companies should view this low industry average as an opportunity; by achieving a "strong" score (10+), a telecom provider can significantly outpace competitors and drive growth through word-of-mouth referrals.
How should a telecom company use two specific revenue KPIs on their Plecto dashboard?
A balanced telecom dashboard should track both New Business Revenue and Repeat Business Revenue side-by-side.
- New Business Revenue measures income from first-time customers and is typically tracked against a target (e.g., 35% of total revenue).
- Repeat Business Revenue tracks income from the existing client base, including subscriptions and upsells (e.g., targeting 65% of revenue).
Visualizing these on a Plecto dashboard allows management to see in real-time if they are over-relying on new sales or failing to capitalize on their existing customer relationships.
SAGE CRAWFORD
Content Manager