
Table of contents:
4 Ways Your Data Quality Can Be Compromised
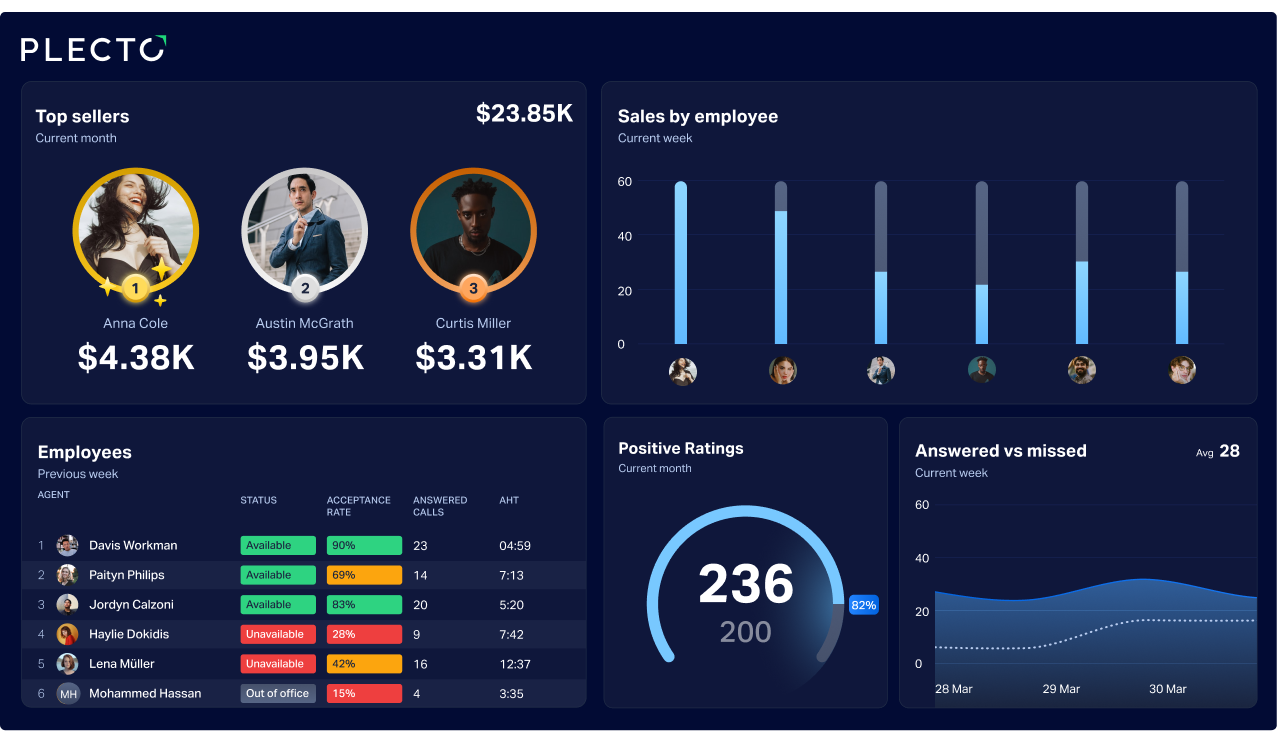
You run a campaign, and the dashboard is lighting up like a Christmas tree.
Everything seems like it’s working perfectly except… The sales. That’s not moving.
How can that be if it all 'works'?
This happens a lot, and the reason why you don’t know about it is that nobody likes to admit it. There are quite a few reasons why this can happen, but none of them is wrong data. The data is correct, it’s just not telling you what you think it’s telling you.
Take a few minutes, and let’s go over a few of the issues that might be causing this conundrum.
What’s Throwing Your Data Off Without You Noticing
The numbers on your dashboard look so neat and perfect, it’s almost heartbreaking to admit that what you’re looking at isn’t reality. What you see are measurements of reality, and the problem with measurements is that they always leave some things out.
The thing is, you have data, sure. But do you really understand it? Probably not.
Here are four of the most common reasons ‘why’ all this happens.
1. Numbers Aren’t Everything
On its own, a raw number (a data point) is just a number. It’s pretty much useless.
Just because you can see that sales have been down 15% since last Tuesday doesn’t mean you can fix that or know why it happened. Your instinct tells you to figure out what’s wrong; maybe the website glitched, maybe your ads aren’t doing that great… You don’t know, and that’s exactly the point.
That 15% won’t tell you whether your biggest competitor launched a sale that very day the loss happened. That 15% also won’t tell you that more than half your regular customer base wasn’t working that day because of a local holiday or a localized power outage that lasted 4-5 hours.
It’s things like that, on which you rely to build an effective business strategy, that won’t come out solely based on a raw number.
As useful as your dashboard is, it only shows the result, not the cause, so what do you do? You jump to conclusions because you want to fix things ASAP.
Unfortunately, all you can do is guess if you’re working with zero context around those numbers.
2. Things Outside Your Control That Still Have an Impact on Your Data
Some numbers change because of something you did or didn’t do.
Others change because of things you have absolutely no control over, like the weather. A storm comes out of nowhere, and your store sits empty because the streets are empty. If you look at only what the numbers show, this looks like your business is too slow, but that’s not the truth.
You’re dealing with something you aren’t tracking, and that’s it. In this case, a weather API could be a lifesaver because it would enable you to put accurate weather-related data into your software, which would, in turn, enable you to better prepare when necessary.
But weather isn’t the only factor outside your control; traffic, holidays, local events, changes in seasons, it all plays a part, and your internal data shows none of it.
3. Your Data Isn’t as Current as It Looks
'Live' and 'real-time' are problematic terms because they make you think you’re watching what’s happening right now. But you’re not. At best, you’re looking at what happened a few minutes ago because systems can’t sync at the speed of light.
Data goes from one tool to another in batches, and by the time you see it on your screen, it’s no longer as current as you think.
You might say that a few minutes of delay isn’t the end of the world. And, yes, it’s not. But the reason why you’d want to keep this in mind is that even small delays can make you react in the wrong way.
Gaps in timing mess up what you think is happening right now, so while you think you’re making decisions based on current factors, you’re not.
4. People Have a Bigger Impact on Data Than You Think
The uncomfortable truth is that, as soon as there are people involved, data gets changed.
Many people assume that any problems with data have to be technical, and they forget to look at their own team as the source of the mess. Teams tend to focus only on the KPIs that they’re tracking and ignore everything else.
As you can surely tell by now, that’s far from ideal.
Here’s a quick example to explain this:
Let’s say someone has entered a customer address in 5 different formats because they couldn’t find the right option from the dropdown menu. Is that a system error? Absolutely not, that’s bias and inconsistency, and the dashboard won’t warn you about it.
Remember that data reflects behavior, as well, not just systems. We all want clean data, but in order to have that, we have to look at how people interact with it.
Conclusion
It would be great if data could burst into flames or scream bloody murder when it gets messed up, but that doesn’t happen. It's kind of just… Drifts. A little bit here, a little bit there, and you’ve got yourself a number that means nothing because it’s not correct.
When you look at all this article talked about on its own, it’s all (honestly) pretty boring stuff.
It’s not dramatic. Nor is it scary or exciting. But what happens once you sum all of this up?
Then, something scary would happen – you’d be making ‘make or break’ business decisions based on numbers that make no sense.
And the scariest part?
You won’t even know it.
Book your demo with
a Plecto expert today.
LAURA GREENE
Content Outreach Specialists, Page One Power