Customer Service Dashboard Example

Why are customer service dashboards essential for supporting operations
...where you need to take action
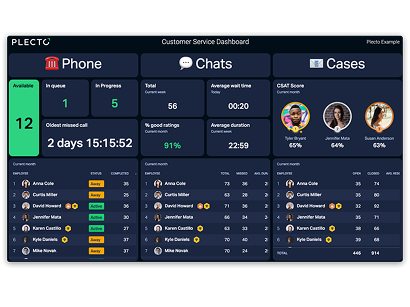
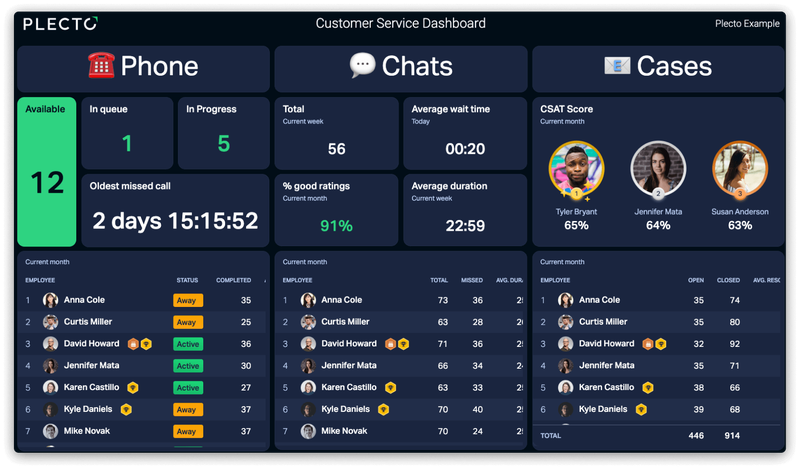
Customer support is nearly always a fast-paced environment where priorities can often change by the minute. A real-time dashboard enables you to instantly identify what the priorities are and where action needs to be taken.
...the success of your agents
Working in customer service is a demanding position, and your agents deserve praise and recognition for their hard work. You can see on our example that we have a widget for customer satisfaction. This is a great way to display great feedback received from customers. Another way is to set up instant notifications, to make sure that every milestone is celebrated across the team.
...of all your channels
With modern customer service teams, there's a good chance that agents are responding to customer queries on multiple different channels including phone, online chat, social media and more. As a result, this makes it difficult to get the full overview of your service levels. A customer service dashboard centralizes all these different channels onto one, digestible screen.
Essential KPIs for a Customer Service Dashboard
There are tons of KPIs for customer service. That’s why, in the case of a general customer service dashboard, you should only include the metrics that your team needs to monitor on a daily basis. Remember, you can always build more dashboards that dig deeper into some of the more specific metrics that you are tracking. That said, here is a brief summary of the KPIs that we believe are essential on a CS dashboard:
Available Agents
Displays the number of reps currently logged in and ready to take on a new call, chat or case.
Oldest Missed Call
Measures the time since the longest unanswered or missed customer call.
Customers in Queue
Monitors the number of customers waiting in the queue for assistance.
Calls in progress
The number of ongoing calls between agents and customers.
CSAT Score
Measure the satisfaction of your customers feed this back to your reps.
Open cases
Ensure that you never forget about unresolved or open customer support cases.
Average Wait Time
This metric tracks how long the average customer has to wait until getting through to an agent.
Average Duration/ Handling Time
The average time it takes for agents to handle a customer interaction. This can apply to phone calls, online chats and social media.
Average resolution time
The average time it takes agents to resolve a customer case.
More Service Dashboard Examples
Support Agent Dashboard
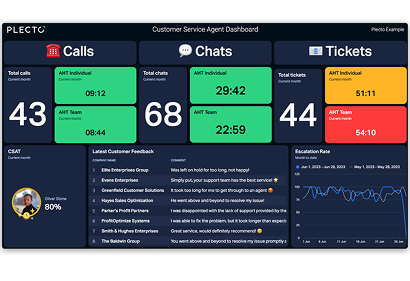
Enhance the performance of your support agents with real-time dashboards for customer service reps.
Call Center Dashboard
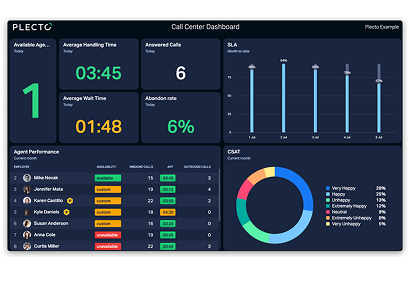
Struggling to get the full picture of your call center operations? Use real-time call center dashboards and take instant action on your call center metrics.
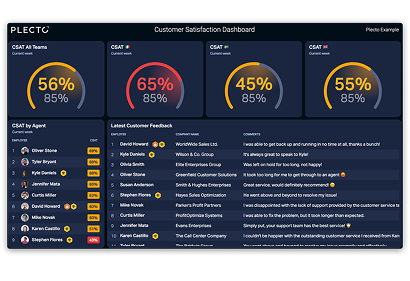
CSAT Dashboard
Keep track of customer satisfaction, agent feedback and more with real-time CSAT dashboards!
