
Introduction
Presentations are often nerve-racking events. While standing and talking while flipping through a slideshow sounds easy enough, presentations are rarely so simple, and many people don’t like doing them. Just think of your school days—and you can get a pretty accurate idea of how it is to present in a corporate setting.
But don’t worry! In this article, we’ll go over some of the tips and tricks for you to give a solid, 10/10 presentation for the benefit of your company board. From psychological boosts to data-driven visualization, we’ll explore seven of the most effective ways to make yourself the shining star of your presentation.

1. Know your audience and their priorities
First things first, you need to know who you’re presenting to. In the same way your company has an ICP (ideal customer profile) that allows them to target their sales, you can also think of the board as being a target audience, and fine-tune your presentation accordingly.
Be sure to research board members’ backgrounds—for example, in finance, culture, entrepreneurship, or innovation—and tailor your presentation to fit their interests. With that in mind, you can design your presentation to “speak their language,” using concepts, metaphors, and metrics that hold particular resonance for them.
2. Lead with clarity: present answers, not problems
It’s important to remember that you’re being called in to present as an expert: you’re expected to provide recommendations about how to address issues the company is currently facing. If anything, you should consider your expert status a major confidence boost! The board is consulting you as an equal, and you shouldn’t hesitate to be forthright in your considerations and requests.
Make sure that your presentation has a clear direction and rationale. State the issues (and any requests you have) upfront, in order to focus the board’s attention and provide a framework for the presentation.
3. Be concise: respect the board’s time
Keeping it simple is the name of the game. Your presentation should convey a sufficient amount of information—but not too much. Impact, rather than length, is key. Avoid unnecessary background or obvious information when presenting.
And a big pro tip that many people don’t know: each chart or slide should highlight only one key insight to avoid cognitive overload! Your message will be far more clear—and even if they don’t say it aloud, your audience will thank you.

4. Hook, context, close
When you give a presentation, you’re telling a story. Every story has a beginning, a middle, and an end, so use this same framework when presenting.
You can use what’s called a storytelling arc to guide your presentation:
- Hook with context (and your request to the board, if needed);
- Detail and describe the action steps and/or recommendations;
- Close with a clear call to action, or a decision.
Your presentation itself becomes more effective when told as a story, but make it even more powerful by incorporating anecdotes and smaller stories of your own. Sharing testimonials enhances the overall story arc of your presentation, and allows your data to come to life (more on that in the next section).
Unlike telling a story, however, a presentation isn’t just all talk and no response. Consider what format is better for getting your point across and receiving feedback from your audience—either intermittent pauses for discussion, or giving your presentation first, followed by Q&A.
5. Use visuals and stories
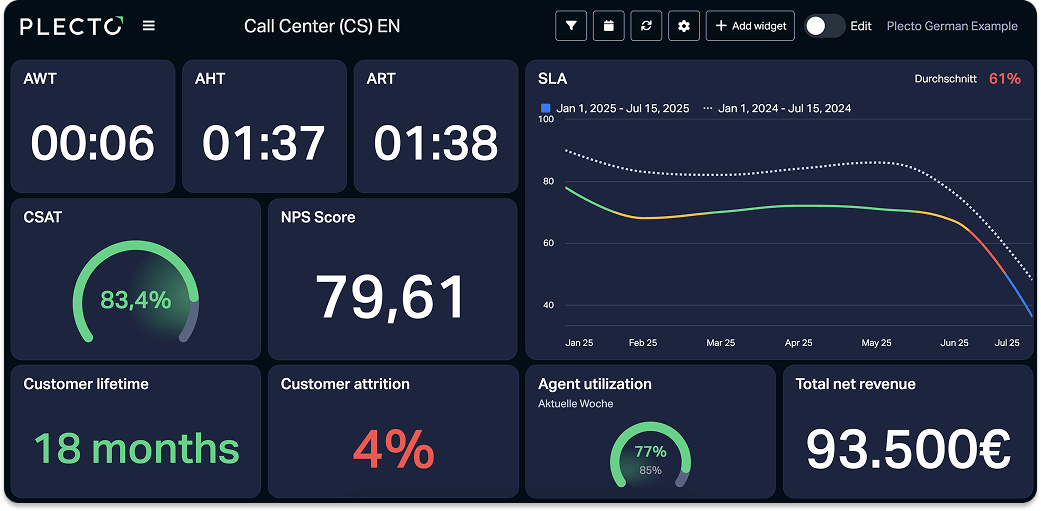
When describing the state of your company, it’s essential that you back up your diagnoses with data. Data backs up your statements with numbers: it’s the ultimate means for guaranteeing credibility. And what better way to display your data than on a dashboard interface or reports?
Platforms such as Plecto are the perfect means for visualizing and presenting your data in easily digestible information bites. Widgets and other visualizations—such speedometers, tables, and bar charts—allow your data to be seen, analyzed, and understood at a moment’s glance. Best yet, platforms such as Plecto display data in a live format, so you can access the latest versions of your data with zero difficulty.
To guarantee your dashboard or report has maximal impact, keep it clean. While it may be tempting to do otherwise, only use as many visuals and widgets as necessary. As with PowerPoint slides, the goal here is to convey information while preventing the audience’s cognitive overload.
6. Prepare your material
There’s a couple of steps you can take in preparation for your presentation that will give you a professional ethos, really letting you stand out to the board. One of these is preparing your materials early and distributing them in advance (just be sure these are actually supplementary materials, and not simply repeats of your slides).
Build your first dashboard.
Start your 14-day free trial today
Conclusion
Giving a presentation might not be everyone’s cup of tea, but it’s the ideal way to communicate essential information to your audience while bringing data to life. Use these tips as a launchpad for developing even more tips and tricks to make your future presentations all the more effective. And if you’re really interested in giving stellar presentations backed by the power of data viz, why not try Plecto for free today?

JAMES NIILER
Content Specialist
An in-house content writer and specialist at Plecto, James brings an academic touch and journalistic flair to his marketing copy. Having worked and studied on both sides of the Atlantic, James is a great believer in the importance of communicating across cultures and industries. Catch his work here on the Plecto blog, or as a guest contributor on other B2B websites.