Table of contents:
The 3 Mission-Critical Dashboard Types
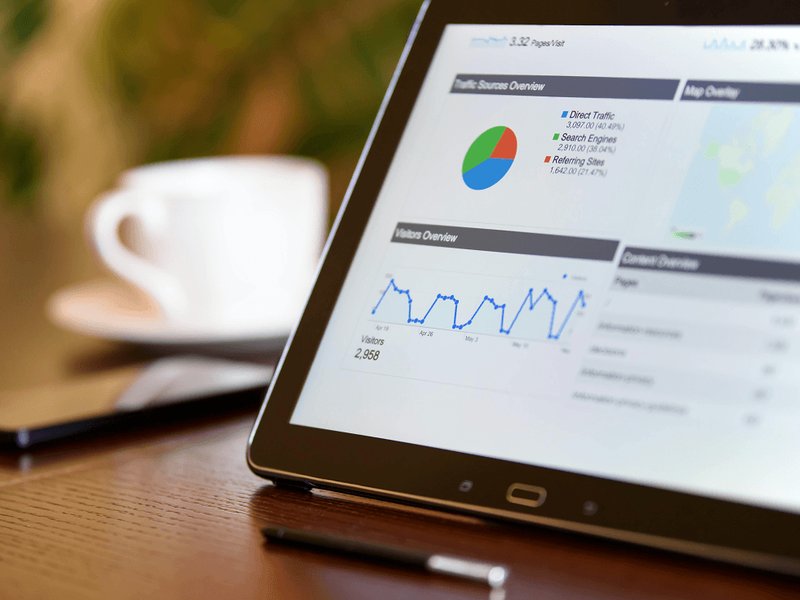
The technological advances of recent years have seen companies collect more data than ever before. This has enabled businesses to become more data-driven in how they approach every aspect of their operations. Taking it a step further, many companies are choosing to use different dashboard types to share information between employees – and departments.
Organizing, analyzing, and sharing data on different types of dashboards makes it easier to keep tabs on how the company is performing while enabling everyone to see what they’re doing well and where they must improve. Understanding the following three dashboard types is a great entry point into displaying and tracking the most important KPIs to empower everyone in your company to make decisions that will drive your business forward.
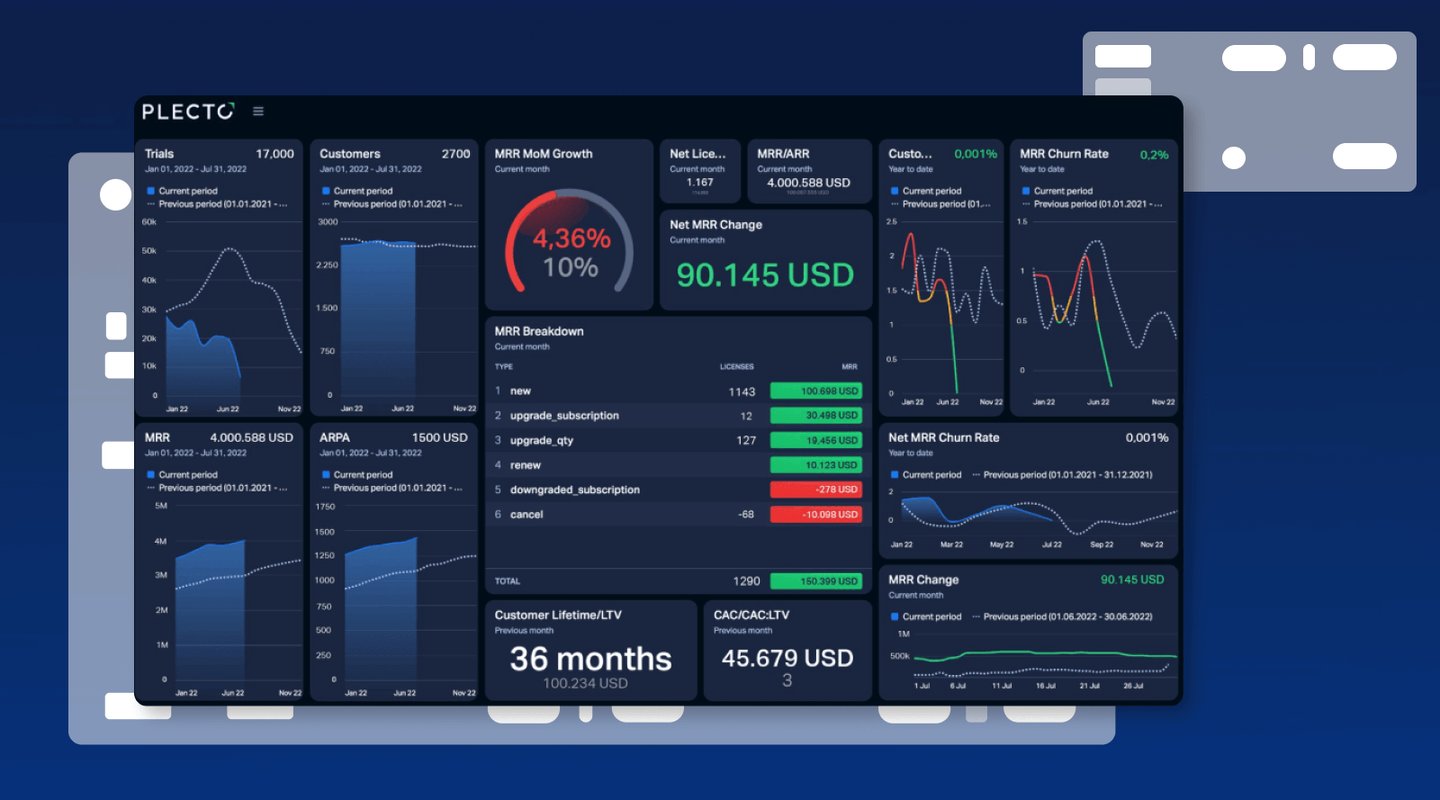
1. Strategic Dashboards
Strategic dashboards are most commonly used by top-level management. C-level executives and business owners are the most common categories of users who will benefit from these dashboard types, which focus on long-term strategy and high-level metrics.
Strategic dashboards can help reduce the time necessary to meet the company’s biggest and most important KPIs. Their main purpose is to give executives at-a-glance insights into the company’s overall performance. Unlike the other two types of dashboards, which often include up-to-the-minute data to help department leaders and individual employees track their KPIs in real time, strategic dashboards often track monthly, quarterly, or yearly performance.
These are some examples of KPIs that are commonly seen on strategic dashboards for top-level management:
- Overall fiscal performance
- Growth rates
- New and recurring revenue
- Net/gross profit
Think of strategic dashboards as “the big picture” that can help drive broad strategic decisions and help define the company’s future direction, identify potential opportunities, and understand and plan for current and future trends.

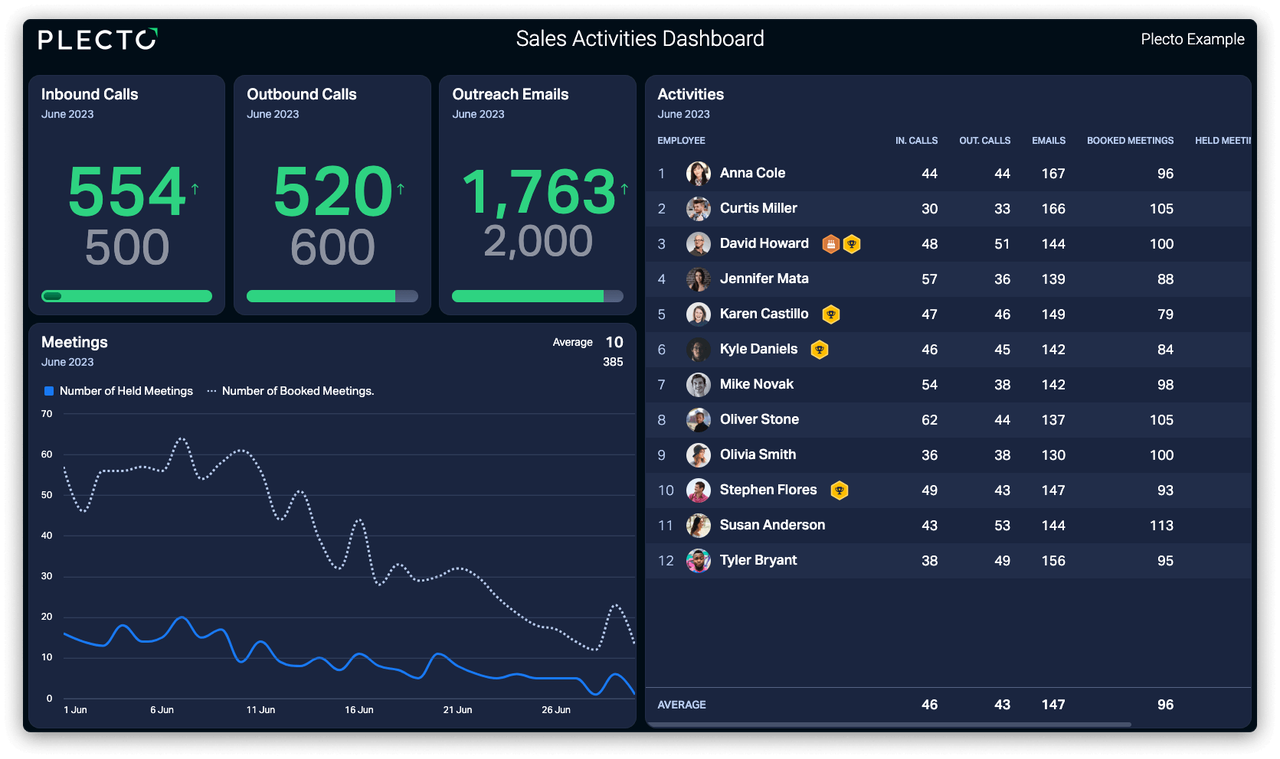
2. Operational Dashboards
Operational dashboards are often what come to mind when people think of “dashboards.” These types of dashboard track operational KPIs within a shorter timeframe than their strategic counterparts.
These are often department-level dashboards that use real-time data to track KPI progress and quickly identify issues before they become trends with long-term implications for company performance.
Operational dashboards track tactical metrics that can drive direct action, and they can be a powerful tool in day-to-day operations by showing what’s happening now. These types of dashboards are often created at the department level and are particularly popular within sales, marketing, and customer service organizations.
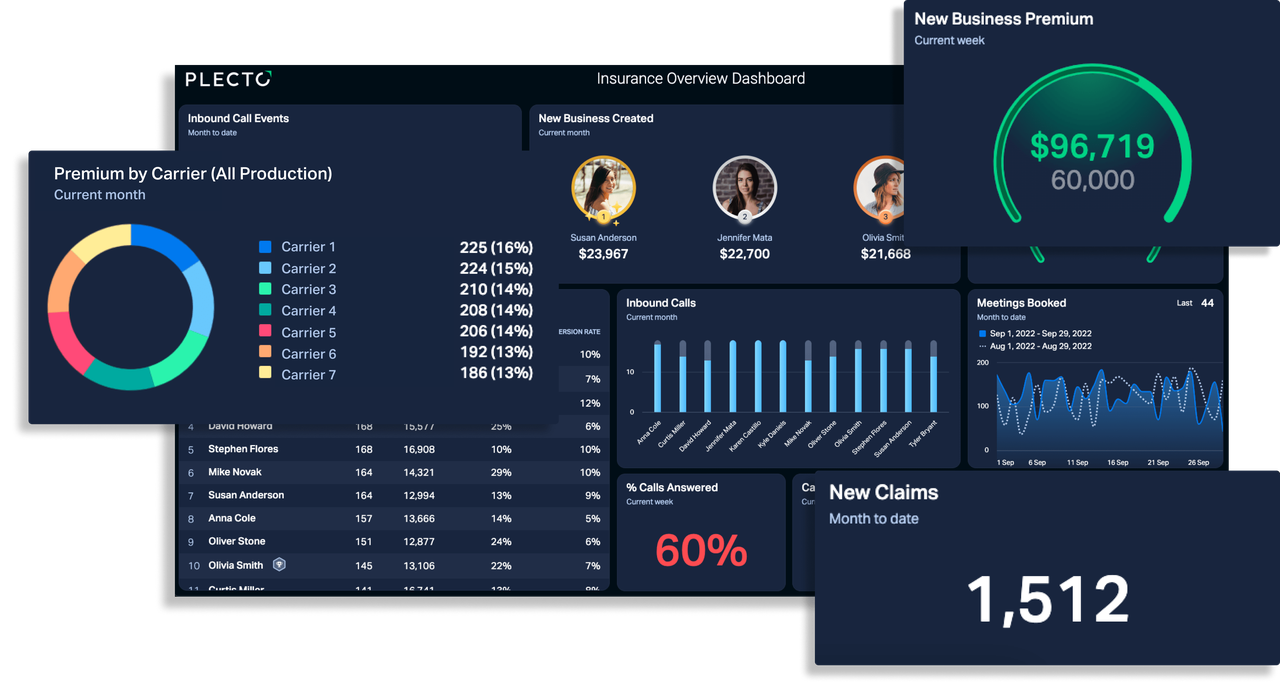
3. Analytical Dashboards
Analytical dashboards are popular among top- and middle-management alike. These dashboards generally contain more comprehensive data than the two aforementioned types.
Instead of simply tracking data, dashboards in this category also incorporate analysis of past data that can help identify trends, compare them against variables, and make predictions that can be incorporated into broader strategic decisions. If strategic and operational dashboards show the “what,” a good analytical dashboard will show the “why” by correlating the appropriate metrics and highlighting possible deficits.
The main strength of analytical dashboards is their ability to use historical data and visualize complex datasets in a way that makes it easier to clearly see and analyze collected data for the company’s future benefit. These dashboards traditionally required the expertise of data analysts, but recent advances in automated business analytics tools have made it possible for nearly any manager to create and benefit from this type of dashboard.
Choosing the Right Dashboard Software for You
When first incorporating dashboards into your operations, it’s important to gain a foundational understanding of the three main types of dashboard and their purpose. Once you understand this, you’ll be able to choose and customize dashboards like a pro!
Today’s software makes it easier than ever to build dashboards that can help propel your company toward greater success! Check out this article to learn six tricks to design the most engaging dashboards.
Want to take your customer experience to the next level? This article is a fantastic resource for learning how to create CX dashboards. Do you consider yourself a sales guru? Then make sure to build these 5 dashboards that every sales team needs in order to out-sell the competition.
Plecto will get you up and running quickly with any or all of these types of dashboards, so that you can visualize and track KPIs, making the information accessible to everyone who needs it.
Sign up for a free demo, and see how Plecto can help your company leverage the power of dashboards to become more data-driven.
Start your 14-day
free Plecto trial today.
SAGE CRAWFORD
Content Manager