Table of contents:
Getting Employee Motivation Right
The democratization of data means that data visualization tools are now available to everyone. The hard part? Knowing how to use data visualization actionably in ways that have a measurable impact on your organization. You may dream of using data to drive employee motivation, increase engagement, and conquer key performance indicators (KPIs), but you have no idea how to get there from where you are.
This article will demystify the process and give you six powerful ways to use data visualization to drive employee motivation and improve performance.
Types of Motivation
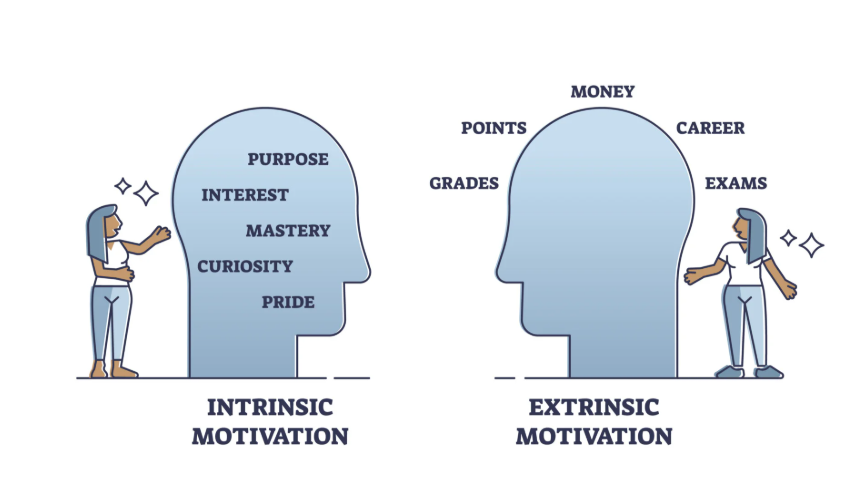
As with any endeavor, it’s crucial to understand what you need to achieve the desired results. Specifically, you need to understand what is required to motivate a team. While every human is unique, it can be helpful to categorize human motivation into two groups: intrinsic and extrinsic motivation.
Intrinsic motivation is an internal drive. It’s aligned with personal values that give work meaning and make it enjoyable for the individual.
Extrinsic motivation is externally focused and tied to rewards such as promotions, bonuses, public praise, or meeting a challenging deadline.
Both are powerful motivators, particularly when employing data visualization tactics to enhance employee engagement, motivation, and ultimately, their productivity.
Let’s take a deeper look at how to motivate your team, as well as dipping into some motivational theories that will support your endeavors.
6 Ways to Use Data Visualization to Drive Employee Motivation
The trouble with KPIs is that they’re not always seen as exciting, especially when they seem out of reach–in which case they can have the opposite effect than what performance-driven teams set out to achieve.
When seen in this light, KPIs can feel like dry, intangible metrics that your team knows they should care about, but that don’t really resonate with or inspire them.
While data visualization alone won’t magically create a motivated employee, it can help transform the sometimes tedious process of reaching company goals into an enjoyable office culture that improves job satisfaction. Teams that master turning everyday activities into opportunities to motivate are typically associated with higher job satisfaction, loyal employees, and greater achievement of targets and broader company goals.
Let’s explore how to accomplish this using the six steps listed below.
1. Make it Fun
When data becomes engaging, the mind becomes more involved.
A 2023 study published by eLife found that the part of the brain called the nucleus accumbens in mice responds strongly to even tiny changes in light in mice. This is because their brains pick up something different, something that seems attention-worthy.
This demonstrates that the brain releases dopamine (the chemical linked to motivation and pleasure) when something noticeable happens, even if it’s just a small flicker of light.
How does this relate to employee motivation? The same study shows that the dopamine system is highly sensitive to big rewards and small, noticeable environmental changes. This means that visualization cues don’t have to be huge to have a significant impact.
Small, frequent, and visible feedback triggers significant dopamine responses that enhance attention and motivation. When you present different, visually stimulating, and fun data, the human brain thinks it’s the best thing ever and wants more of it.
Even more effective than data visualization, gamification is another way to achieve a highly engaging, motivating effect in employee’s brains. This is perhaps why sales and support teams are increasingly looking to incorporate gamification tools like those offered by Plecto, whereby contests, custom avatars, and reward systems are used to motivate teams and drive organizational objectives.
Take the following space-themed contest one can easily set up and run with Plecto. Featuring personalized avatars piloting spacecraft and a dynamic leaderboard that together track employees progress in real time, a digitalized live contest like this works to make otherwise mundane everyday sales tasks more engaging.
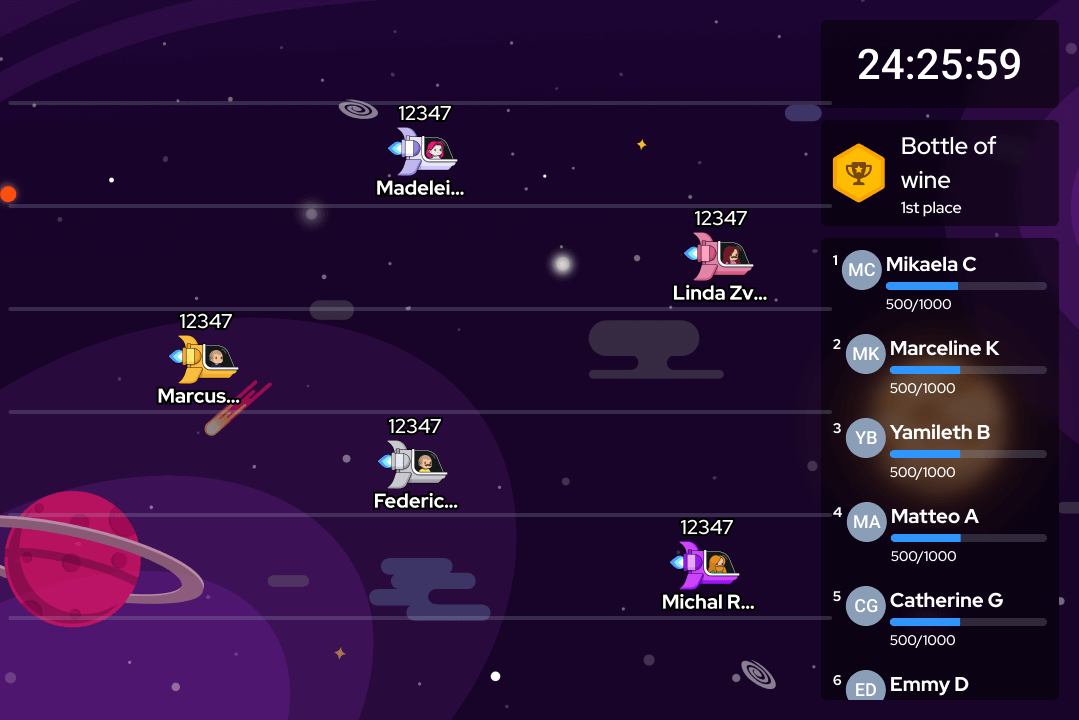
Coupled with the bottle of wine as a reward for winning, contests do wonders in increasing activity levels beyond what would otherwise be accomplished; leveraging motivation through prizes and recognition; and fostering healthy competition that drives both team bonds and performance.
2. Empowering Employees
Adding to the fun, empowering team members to take ownership of their own progress creates an intrinsic sense of achievement that makes participation even more rewarding.
One widely adopted method that ties directly into empowering employees is the 4 Disciplines of Execution (4DX), a strategic framework designed to help teams focus on achieving their most important goals. The four disciplines are:
- Focus on the wildly important,
- Act on lead measures,
- Keep a compelling scoreboard, and
- Create a cadence of accountability.
The third discipline—engagement—is where data visualization really shines. It encourages teams to use compelling scoreboards to track their lead and lag measures. Lead measures are the high-impact actions that can be influenced directly by the team (such as number of outreach calls made), while lag measures are the outcomes that follow (such as closed deals or customer satisfaction scores).
A compelling scoreboard is one that’s clear, visible, and easy to interpret at a glance—it quickly shows whether the team is winning or needs to adjust course, particularly on the tasks that they can influence. Instead of static reports, think live dashboards with real-time progress bars, leaderboards, or traffic light systems.
In essence, a well-designed dashboard functions as the ultimate scoreboard, transforming performance tracking into something visual, engaging, and actionable.
The visual component can be a progress bar, a traffic light system, or a dynamic leaderboard. What matters is that it keeps goals top of mind and encourages healthy accountability. Instead of burying team members in data, you’re showing them what matters most. Using data this way makes moving the needle on strategic goals concrete, motivating, and immediate.
3. Foster Healthy Competition
While sharing performance data provides valuable insights, displaying that data in real-time further elevates engagement. Seeing accomplishments update live helps ignite healthy competition (or collaboration) among teammates–and stimulate instant action!
Let’s take the concept of a “purple team” in cybersecurity—where red (offensive) and blue (defensive) teams collaborate in real time—has inspired new approaches in other industries as well. In this model, shared visibility and feedback loops create a culture of constant improvement and teamwork.
Sales and customer support teams can adopt a similar mindset by blending roles and responsibilities—for example, aligning prospecting and account management in sales, or pairing frontline agents with those handling escalations in support. By using shared dashboards that update in real time, teams can visualize performance metrics such as closed deals, customer satisfaction scores, or response times.
Whether it’s location vs. location contests (e.g., which office closes more this quarter), or individual rep vs. rep challenges, this transparency fosters friendly competition and encourages everyone to push harder toward shared goals. The key takeaway from the purple team in cybersecurity is the power of real-time collaboration and feedback—made possible by visualization—to boost performance across the board.
Build your first dashboard.
Start your 14-day free trial today
4. Create a Positive Feedback Loop
In workplace settings, visual feedback on progress (like filling in a graph or moving up a leaderboard) enhances a person’s belief in their ability to succeed.
For example, a 2025 study on Conversational Progress Guides found that employees who received real-time visual progress bars during tasks reported significantly higher motivation and self-confidence, without experiencing increased cognitive load. Additionally, visually seeing progress gives employees the goal-gradient effect.
This is a psychological phenomenon where efforts are accelerated as the goal is approached. In other words, the excitement of seeing your progress causes you to work more quickly toward your goal to reach the ultimate sense of accomplishment. This is a cheat code to have motivated employees.
The visual cue of progress promotes a dopamine reward that results in accelerated effort and a stronger sense of self. The cycle then repeats itself in a positive feedback loop, leaving employees with a strong sense of job enrichment (leading to more professional development opportunities) and self-trust.
5. A Culture of Less Chaos and More Organization
Disorganization leads to chaos, which leads to overwhelm, which then leads to loss of productivity and employees feeling like every day is a matter of putting out fires instead of moving the needle forward.
Many industries require juggling multiple data points per role. For example, sales teams may track call volume, conversion rates, average deal size, and pipeline stages; customer support agents balance ticket counts, response times, and customer satisfaction scores; and project managers monitor task deadlines, resource allocation, and budget variances. Without a sound organization system to benchmark or prioritize where to focus, these metrics can quickly cause chaos.
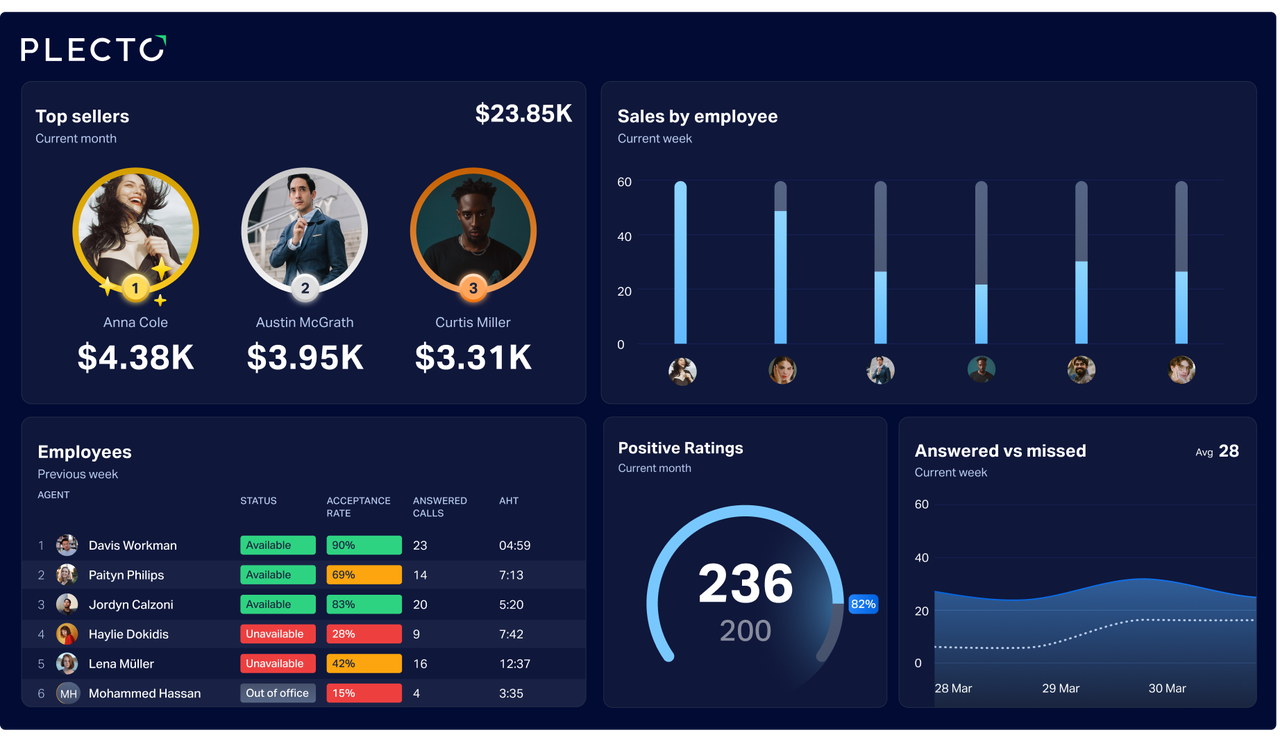
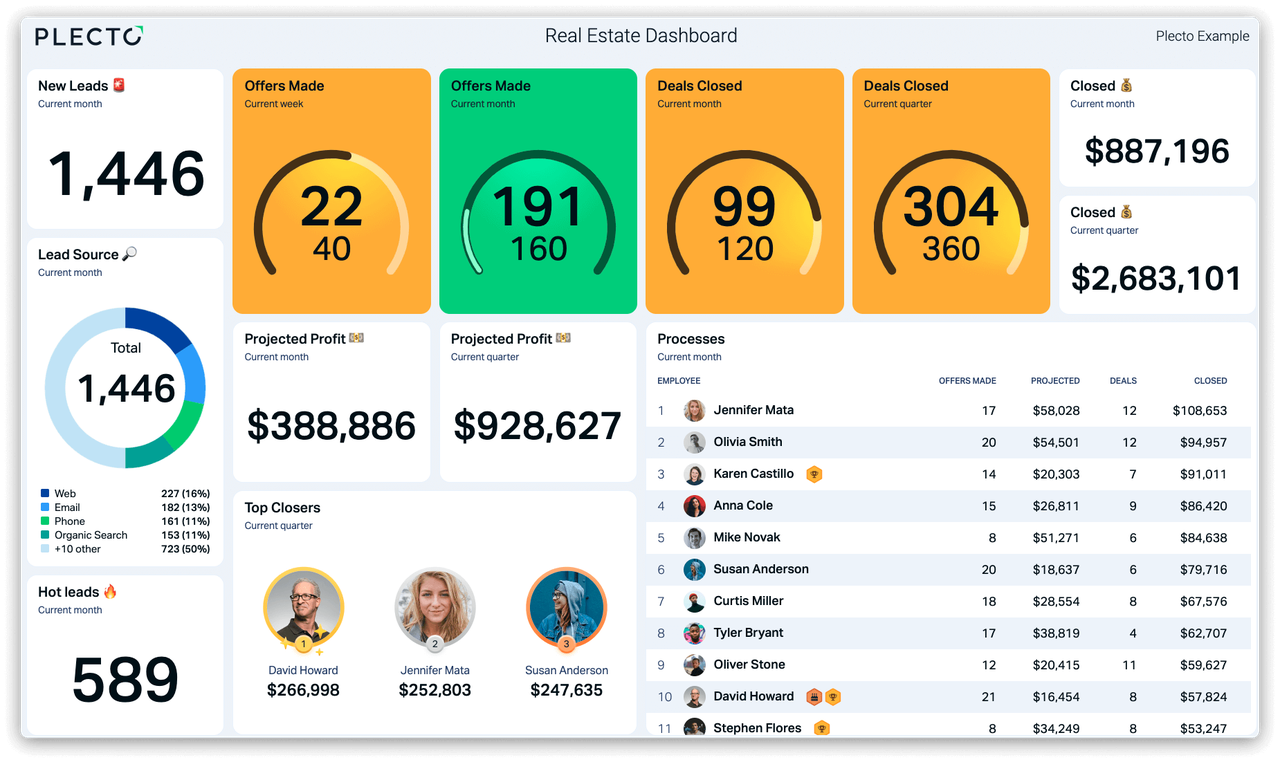
Let’s look at the real estate dashboard below as an example. This data visualization tracks relevant activities and KPIs across the entire sales cycle, streamlining the data and making it clean, helpful, and efficient for both employees and managers to use daily.
Remember, part of what makes an organizational system “good” is that everyone can understand and access it. It’s easy to rely on one or two employees with institutional knowledge to keep things running, but doing so can lead to a dumpster fire later on.
One day, your employees will retire or move on, and you need to ensure every bit of data compiled from years of day-to-day operations is preserved when that happens. Solid, visualized data doesn’t just help your employees stay motivated and organized now—it also helps ensure the stability of your company in the future.
6. Facilitate a Transparent Company Culture
Forbes reports that in 2025, a positive work environment is more important than ever, with high turnover rates, unhealthy work-life balance, and distrust in leadership soaring. Part of building and maintaining a positive work culture is transparency.
Visualization helps eliminate uncertainty and suspicion by keeping all information open and accessible to everyone. Instead of relying on vague updates or closed-door decision-making, teams see real-time data on everything from project timelines to company goals. This builds trust because employees feel included and informed, rather than kept in the dark.
Keep in mind that open communication should also be clear communication. A collection of numbers apropos of nothing or a word salad blurb thrown together daily is not transparency.
At the heart of data visualization for your team is simplicity, meaning sales and support employees should be able to take action immediately after looking at their dashboard. While for strategic management dashboards that focus on deeper business insights, using a paraphrasing AI tool can help reframe complex performance data into clear trends and strategic insights that support your board or C-suite’s decision-making. In both cases, your communication of crucial insights remains fresh, accessible, and impactful at a glance.
Get Started With Data Visualization for Motivating Employees
Although data visualization has become widespread and familiar, its impact extends far beyond pretty graphs. It’s a scientifically proven approach to human motivation that engages, supports, and positively impacts job satisfaction and performance.
When you make progress visible, you tap into the brain’s natural reward system. You’re reinforcing motivation through clear, tangible feedback that the brain understands.
And, as if that isn’t exciting enough, visualizing goals does more than improve output. It also strengthens trust and collaboration. When employees can see both their own progress and that of their teammates, it encourages ownership, reduces uncertainty, and aligns everyone toward common objectives.
At a time when employee engagement and retention are critical, data visualization tools give you an asset that has the potential to bring your entire organization a huge leap forward.
With Plecto, it’s easy to get started visualizing your sales and support KPIs. Book a demo or try Plecto for free for 14 days, no strings attached.

GUILLAUME DESCHAMPS
Digital Marketer
Guillaume is a digital marketer focused on handling the outreach strategy at uSERP and content management at Wordable. Outside of work, he enjoys his expat life in sunny Mexico, reading books, wandering around, and catching the latest shows on TV.