
Table of contents:
The Top 12 RevOps KPIs
RevOps, short for revenue operations, is a framework that aligns marketing, sales, and customer service to create a seamless customer experience. Often a team in its own right in many companies, RevOps lies at the intersection of sales, finance, workflow management, and compliance.
There’s several key KPIs that RevOps teams frequently use, and one can see that they overlap heavily with sales and finance metrics. In this article, we’ll go over 12 of the most common—and describe how you can use dashboard software to monitor them easily. Let’s dive in!
1. New MRR
What is this KPI, and how do I find it?
New MRR is a riff on the most famous KPIs—Monthly Recurring Revenue, or MRR. New MRR is the measure of how much subscription revenue you earn every month based on how many new subscribers you get.
Find your New MRR by multiplying your number of new subscribers by the MRR per each new subscriber.
Why is this KPI important?
New MRR acts as a thermometer of the state of your business health. Are you bringing in new subscribers? Is your revenue growing sustainably?...and so on. A prolonged increase or decrease in your New MRR is a strong indicator of how your marketing and sales initiatives are performing.
How can I use this KPI?
New MRR should be one of those KPIs you monitor closely every month. Evaluate it alongside other KPIs, such as Customer Acquisition Cost, to get a realistic picture of how much you’re spending to acquire and retain customers—if you’re spending more to attract customers than you’re gaining in New MRR, it’s time to re-evaluate your pricing strategy.

2. Annual Recurring Revenue (ARR)
What is this KPI, and how do I find it?
Annual Recurring Revenue has the same principle as MRR, just applied over the course of a fiscal year. It’s the measure of how much subscription revenue you can anticipate to earn in a year.
With that in mind, finding ARR is easy: simply multiply the MRR of a selected month by 12.
Why is this KPI important?
ARR is important because it gives a longer-term perspective about your company’s performance than routinely-fluctuating MRR. While New MRR is important for record-keeping and drilling down root causes of performance, ARR keeps these in perspective.
How can I use this KPI?
One of the best uses for ARR is to have it as a key metric in presentations for your board or stakeholders. It’s one of the most effective ways to display your long-term growth and give your investors an accurate picture of your business performance.

3. Gross MRR Churn Rate
What is this KPI, and how do I find it?
Gross MRR Churn Rate is the amount of MRR you’ve lost to customer cancellations. While not exactly a fun number to keep track of, it’s nonetheless essential to do so you can minimize revenue loss.
Find Gross MRR Churn Rate by adding the sum of all MRR lost from cancellations to the sum of all MRR lost from downgrades, dividing by the MRR at the start of the period, and multiplying by 100 to obtain a percentage.
Why is this KPI important?
If you want to know how much money you’re not only making but losing, then Gross MRR Churn Rate isn’t just important—it’s vital! A high Gross MRR Churn Rate indicates your customers are unhappy enough with your product or service that they’re unwilling to continue paying for it. As to why, there can be several reasons—poor value for money, a bad market fit, or low-quality CS are just a few.
How can I use this KPI?
While it might be a pain to analyze, going through your Churn MRR and exploring the reasons why customers churn is essential to reducing this negative KPI. Segmenting your customer base to identify the demographics most vulnerable to churn will allow you to target efforts to retain them in the future.

4. Revenue Growth Rate
What is this KPI, and how do I find it?
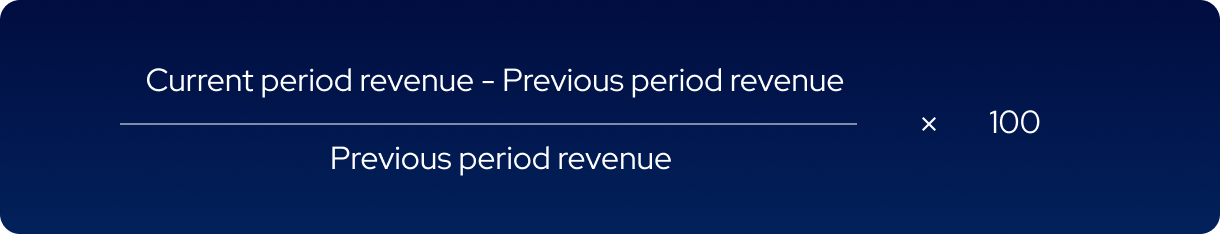
Revenue Growth Rate measures how much your company’s revenue or income has increased within a given period.
Here’s how to find your Revenue Growth Rate:
- Subtract your previous period revenue from your current period revenue.
- Divide the result by your previous period revenue.
- Multiply the answer by 100 to obtain a percentage.
Revenue Growth Rate is often calculated over a quarterly or annual basis.
Why is this KPI important?
Revenue Growth Rate is a key component of measuring your company’s growth, especially if you have a startup still in its early stage of development.
How can I use this KPI?
Revenue Growth Rate is a KPI particularly ideal for displaying to your board or investors when your startup is brand-new. It’s a prime KPI to use early on, but after a year or two you’ll want to transition to MRR and ARR as your primary revenue stream monitors.
5. Customer Acquisition Cost
What is this KPI, and how do I find it?
Customer Acquisition Cost is the average price it takes for your company to obtain a single new customer when all sales and marketing expenses are taken into account: ad spend, salaries, subscriptions for marketing tools, promotional materials, and upgrade costs.
To find CAC, add the cost of sales and cost of marketing and divide by the new customers you’ve obtained in a given timeframe.
Why is this KPI important?
CAC is an ideal KPI for determining how effectively your marketing expenses are being used. Are your customers too expensive to realistically obtain? This is the question your CAC metric will answer.
How can I use this KPI?
Use CAC as a benchmark in conjunction with Marketing ROI. If you’re spending more on obtaining customers than they’re returning to you, you’ll know it’s time to redirect your efforts to other channels and strategies.

6. Net Promoter Score
What is this KPI, and how do I find it?
Customer Acquisition Cost is the average price it takes for your company to obtain a single new customer when all sales and marketing expenses are taken into account: ad spend, salaries, subscriptions for marketing tools, promotional materials, and upgrade costs.
To find CAC, add the cost of sales and cost of marketing and divide by the new customers you’ve obtained in a given timeframe.
Why is this KPI important?
CAC is an ideal KPI for determining how effectively your marketing expenses are being used. Are your customers too expensive to realistically obtain? This is the question your CAC metric will answer.
How can I use this KPI?
Use CAC as a benchmark in conjunction with Marketing ROI. If you’re spending more on obtaining customers than they’re returning to you, you’ll know it’s time to redirect your efforts to other channels and strategies.

7. Customer Satisfaction (CSAT)
What is this KPI, and how do I find it?
CSAT is another well-known metric that indicates customer response within a specific moment, such as how they felt about the delivery process or CS help. This differs from NPS, which measures how customers feel about their experience overall.
CSAT is measured on a scale of 1-10 or 1-5, with 8-10 or 4-5 considered “satisfied.”
Determine your CSAT by dividing your number of satisfied customers by the number of survey respondents. Multiply the result by 100 to obtain a percentage.
Why is this KPI important?
CSAT tells how customers perceive specific aspects of your business, and where to improve these if necessary. While it relates to specific moments or cases, CSAT is still important for giving an indication of the overall strength of your customer service.
How can I use this KPI?
Use CSAT to evaluate how much your customers appreciate aspects of your service, and the scores to build a solid foundation of customer success. CSAT surveys are best sent in the immediate follow-up of an online purchase or delivery.

8. Customer Effort Score
What is this KPI, and how do I find it?
Customer Effort Score is the measure of how strong your customer interaction is. It’s a response to the statement, “Company X made it easy for me to handle my issue.”
CES is measured either on a 1-5 or a 1-7 scale; a score of 3 or under is considered good. (A higher score indicates more difficulty in obtaining help.)
Find CES by dividing the sum of your scores by the total number of responses received.
Why is this KPI important?
CES is important because it’s simple: can a customer agree with the statement or not? And it’s a pretty important statement! If you have a high percentage of customers that can’t agree, then it’s time to re-evaluate your CS practices.
How can I use this KPI?
Like its cousins NPS and CSAT, send CES surveys at key touchpoints of customer interactions – after a CS interaction is an ideal time. These three metrics will give you a solid grasp of how your customer service is impacting your business success.

9. Average Sales Cycle Length
What is this KPI, and how do I find it?
Average Sales Cycle Length is the mean amount of time it takes to close deals. To find your Average Sales Cycle Length, add the lengths of time it takes to close each deal, and divide this sum by the total number of deals you’ve closed.
Why is this KPI important?
There are seven commonly recognized stages of the sales cycle length. They are:
- Locating leads
- Responding to leads
- Qualifying leads
- Presenting your product
- Negotiation and closing
- Maintaining the customer relationship
The Average Sales Cycle Length helps you keep track of this lengthy, multistep process.
How can I use this KPI?
The most important use for Average Sales Cycle Length is projection. Establishing an Average Sales Cycle Length gives you a constant to use in budgeting and financial forecasting—a puzzle piece that allows you a rough estimate about what to expect when closing deals.

10. Number of Leads Created
What is this KPI, and how do I find it?
Number of Leads Created indicates the amount of leads you’ve obtained through a marketing channel or campaign, or more generally over a given time period. Simply count the number of leads you’ve generated to obtain a statistic for this KPI.
Why is this KPI important?
Like Number of Won Deals (see below), Number of Leads Created is a solid indicator of how well your marketing and sales efforts have been going. You can easily see if you’ve hit your numbers-based goals, or if you need to increase your performance in the coming month or quarter.
How can I use this KPI?
While Number of Leads Created is just one number that should be evaluated alongside others, it can still serve as a powerful “at-a-glance” indicator and motivator for your team to keep up their good work.
Build your first dashboard.
Start your 14-day free trial today
11. Number of Won Deals
What is this KPI?
Number of Won Deals indicates the opportunities you’ve converted to paying clients over a given period. There’s no magic formula for this KPI—simply count the number of deals you’ve closed!
Why is this KPI important?
Number of Won Deals indicates if your MRR is improving and if your marketing strategies are bearing fruit. It’s also simply an inspiring KPI to take note of!
How can I use this KPI?
A great way to use Number of Won Deals is to display your current number prominently on a data dashboard, and watch it update in real time as your sales team closes more deals. It’s a great motivator for your teams—and a great starting point to begin diving into your sales performance.
12. Sales Conversion Rate
What is this KPI, and how do I find it?
Sales Conversion Rate is the indicator for how well your team converts your leads to sales. Find your Sales Conversion Rate by dividing your Number of Won Deals by your number of opportunities. Multiply by 100 to obtain a percentage.
Why is this KPI important?
Keeping track of your Sales Conversion Rate lets you easily evaluate the strength of your customer acquisition strategy. A high Sales Conversion Rate means you’ve locked down your ICP and know how to successfully market to it.
How can I use this KPI?
Using your Sales Conversion Rate goes hand-in-hand with knowing, understanding, and targeting your ICP. Because it’s an indicator of how well your ICP aligns with marketing and sales efforts, actively monitor it to see if and how your ICP changes.

Understand RevOps KPIs with Plecto
Any RevOps team needs a solid solution to track these KPIs on a daily basis, and make on-the-fly decisions about how to respond when the numbers change.
That’s where Plecto comes in—a dashboard solution that lets you stay on top of your data (and gives you the opportunity to boost motivation through gamification too!).
Plecto’s real-time and dynamic dashboards update by the minute, allowing both RevOp teams and management to easily access data when you need it most. Try Plecto today with a free two-week trial—and watch your RevOps team efficiency grow alongside your numbers!

JAMES NIILER
Content Specialist
An in-house content writer and specialist at Plecto, James brings an academic touch and journalistic flair to his marketing copy. Having worked and studied on both sides of the Atlantic, James is a great believer in the importance of communicating across cultures and industries. Catch his work here on the Plecto blog, or as a guest contributor on other B2B websites.