How to use Plecto alongside Excel

Homepage sales widgets.png

Bring your data to life

Don’t rely just on cells and tables to communicate your data. Bring your data to life with Plecto’s creative, easy-to-read, and visually appealing KPI widgets.

Gamification general sales.png

Make your data more visible

Visualizing your data on dashboards boosts your teams' motivation to accomplish big things. Dashboards can also display Plecto's gamification features to help bring some fun to the daily grind!

Pipedrive dashboard 2.png

Reduce time on manual processes

Save hours of time by switching to Plecto, and say goodbye to manual data entry on spreadsheets forever. Plecto’s dashboards display your data updated to the minute, giving you a solid foundation on which to make accurate decisions.

Plecto vs Excel at a glance

Discover how Plecto and Excel's data analytics features differ.

Plecto vs Excel.png

Real-time dashboards for Excel

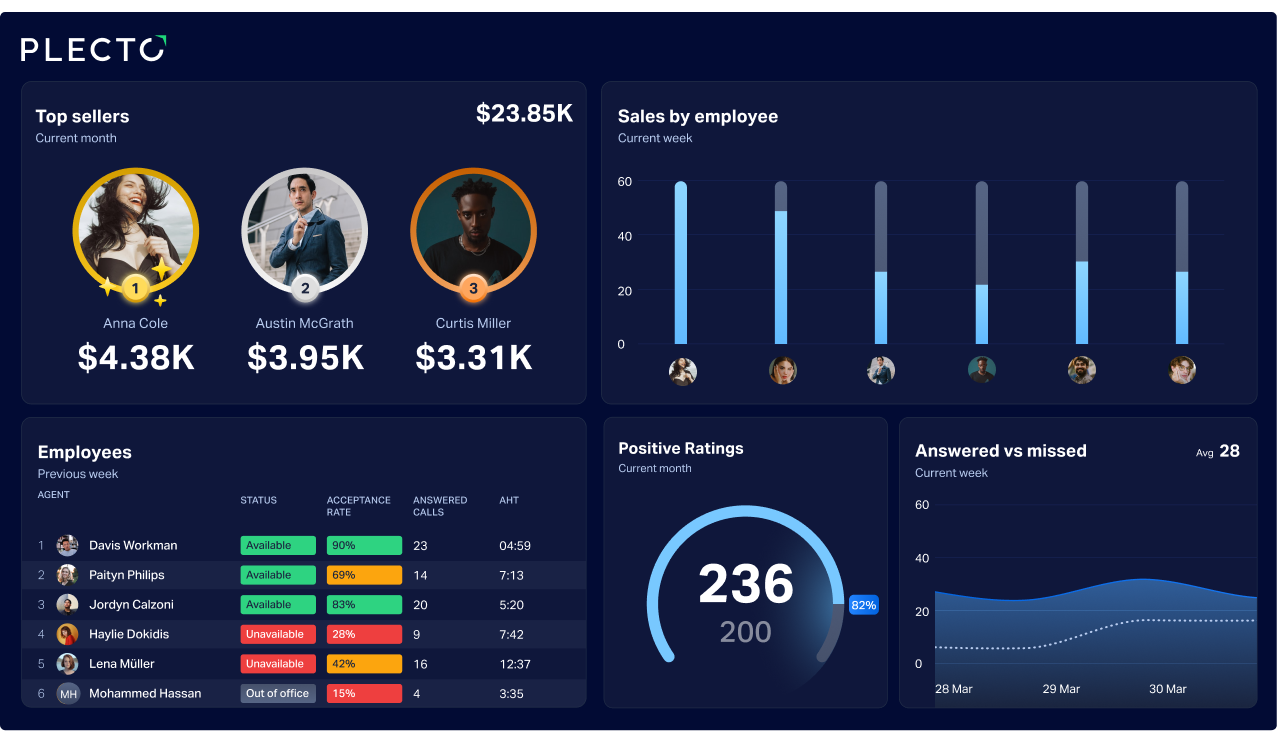
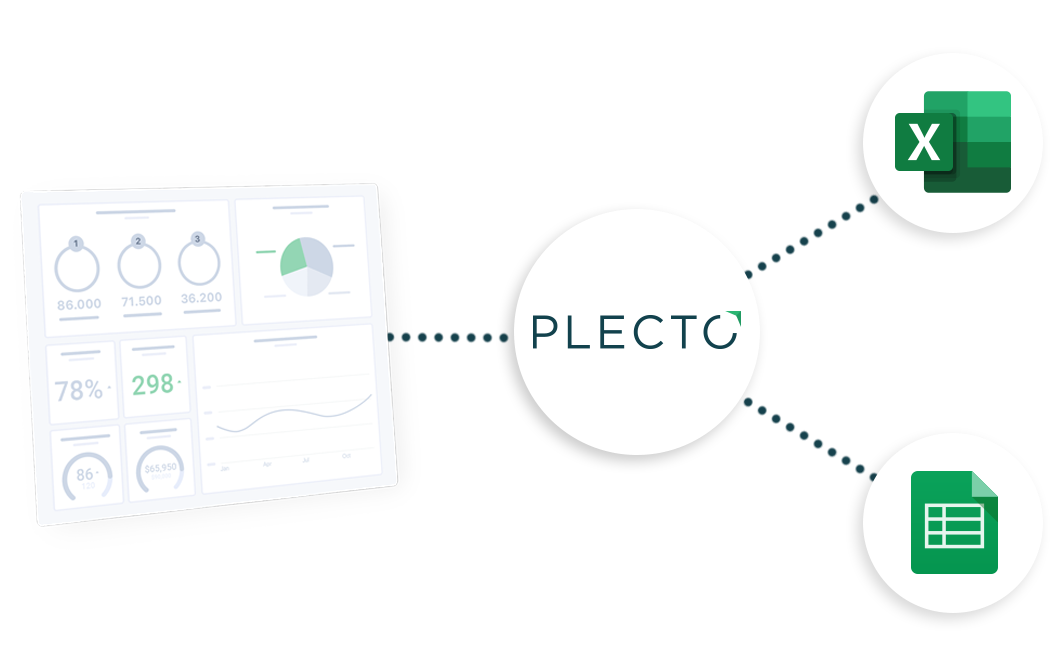
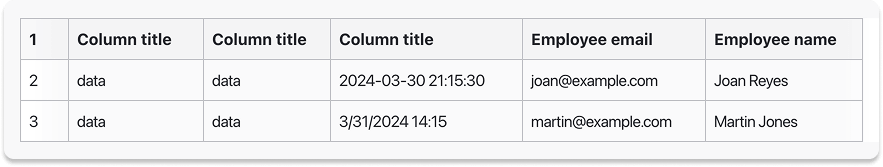
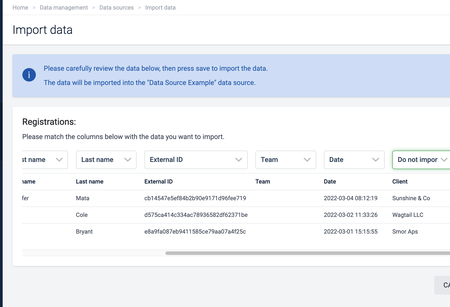
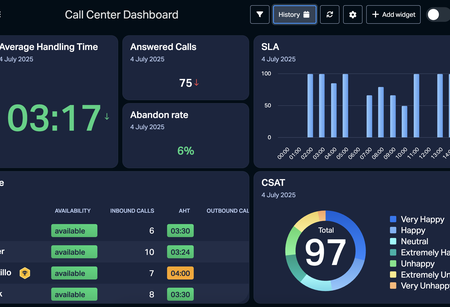
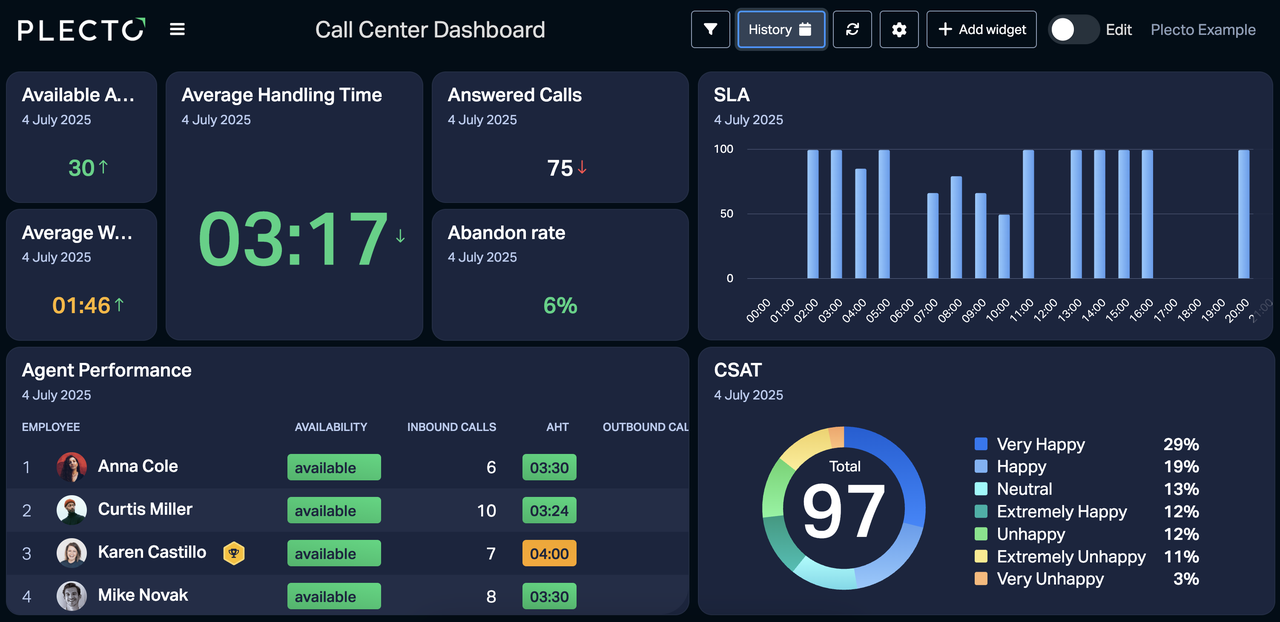
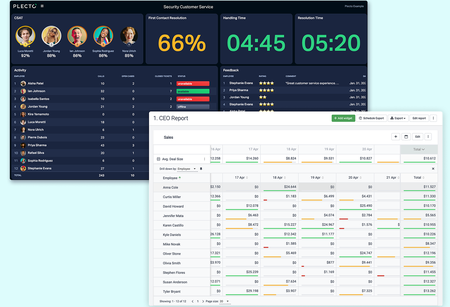
Build dashboards and visualize data from your Google and Excel spreadsheets. With Plecto, you can easily synchronize your data, and build custom Excel dashboards with real-time metrics.

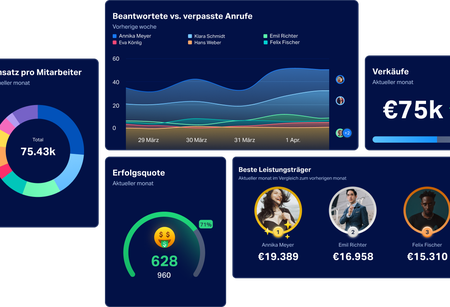
Excel is great for gathering data, but spreadsheets are a poor communication tool. Visualize your relevant numbers on a Excel dashboard and trigger data-driven conversations.

Real-time dashboards General.png

Upload your Excel spreadsheets

Easily import your Excel spreadsheets into Plecto to start visualizing your data. Combine your data with metrics from web services, SQL databases, or custom data sources to visualize KPIs.

You can upload the files directly, or use file-sharing services like Zapier or Google Drive to automate data source upload.

excel_imac copy.png

Build Excel dashboards for free

Get started in minutes. Boost your performance today!

Display your Excel dashboards on TVs

Start promoting data-driven conversations around the office by displaying your dashboards on TVs around the office or from home.

Spreadsheets are outdated: visualize your data with Plecto instead!

TV dashboards

Why combine Plecto and Excel?

Plecto dashboards are the perfect match to Excel's analysis and reporting functions.

But why is Plecto the best solution to visualize your Excel data on a dashboard? Here are just a few reasons:

  • Real-time data updates
  • Engaging visualizations
  • Deep-dive report analysis
  • Broad customization options
  • Custom formulas and KPIs
  • Can combine Excel data with 100+ other services
Excel_Sheet-Plecto

Visualize your Excel data wherever you are

With the Plecto App, you can view your dashboards at any time. Easily access the app via your laptop, tablet, smartphone, or Apple Watch, and keep track of your metrics wherever you are. Make data-driven decisions – every time, everywhere.

Download iOS app Download Android app
Plecto App New 2.png

How to integrate Plecto with Excel

This integration lets your Excel data and Plecto dashboard update in sync.

Setting up your Excel integration

You can integrate your Excel spreadsheets into Plecto with OneDrive and SharePoint.

To set up your integration, first organize your sheets as shown in the image below.

excel setup example 1.png
  • Continue by locating Microsoft Excel in your data sources.
  • Select the drive your spreadsheet is stored in.
  • Allow Plecto access to your workbooks. Select a workbook and relevant sheets. Each sheet equals one data source.
  • Match the column names from your sheet to configure your data sources. And you're done!
Find out more here

More about the Excel integration

  • The default time for updating your Excel spreadsheets in Plecto is every 15 minutes.
  • However, you can adjust this time higher or lower as needed, even down to every minute.
  • You can also manually update data in Excel. Doing so will create a corresponding change in Plecto.
Find out more here

How to build Excel dashboards

Visualize and share your Excel dashboards on TVs around the office or at home, and follow your progress in real time!

Excel - Import Preview

1. Connect your Excel spreadsheets

Upload your Excel spreadsheets directly into Plecto, or synchronize them with Zapier.

Call center team activity dashboard example.png

2. Build a dashboard

Use Plecto's prebuilt dashboards, or customize your own by using formulas to calculate more advanced metrics.

Employee celebrating an achievement

3. Celebrate relevant data

Create notifications, slideshows, and achievements to get notified whenever your data changes!

Plecto vs Excel FAQ

Both Plecto and Excel are data display systems, but they have different use cases.

Excel is a platform for organizing, tracking, sorting, and storing datasets on spreadsheets. It's not really intended for displaying data.

Meanwhile, Plecto is primarily a data visualization platform. Plecto integrates with various data sources, including Excel, to creatively display data in visually appealing ways, motivating teams to boost their internal cohesion and acheive their goals.

The default updating time is 15 minutes. However, this can be adjusted higher or lower, even down to one minute.

Answer: yes and yes! You can connect as many Excel files and data sources as you like to a single dashboard.

Absolutely. Plecto is designed to be as easy to use as possible. But we also provide onboarding, three hours of free Expert Service consultation, a free resource library, and a dedicated Customer Success Manager for every customer to help make setup as easy as possible. All of these benefits apply to all customers, regardless of the plan they use. So if you’re not technical, never fear.

Plecto’s pricing is pretty straightforward: we charge by the number of tracked users, not by the number of data sources. Our Medium and Large plans both have 10 user licenses included in their base prices. For every extra user, you’ll pay an additional fee.

Sign Up

Build your first dashboard.
Start your 14-day free trial today