 Sign in

What Is a Sales Pipeline + How Do You Build One?
What is a sales pipeline? Learn how it works, the stages, metrics and formulas, with a worked example and tips to manage and clean up your pipeline.

What is a sales pipeline, and how do you turn it into a forecast you can trust? This guide covers how a pipeline works, the typical stages, the metrics and formulas to track, a worked example with fictional numbers, and how to manage and clean your pipeline week to week. If you want the metrics first, jump to our guides to sales targets, KPIs for sales managers and sales velocity.
What is a sales pipeline?
A sales pipeline is a visual, stage-by-stage view of every open deal your sales team is working, from first qualified lead to closed-won or closed-lost. It shows how many deals sit in each stage, what they are worth and what the rep needs to do next, so managers can forecast revenue and spot stalled deals early.
Reps work many prospects at once, and each deal moves at its own pace. The pipeline puts all of them in one place, so everyone can see the status of every opportunity and the next step. Most teams keep it in a CRM and show it as a board or a horizontal bar divided into stages.
A well-kept pipeline helps you to:
- Forecast revenue: open deals multiplied by their stage probabilities give a realistic number for the period.
- Spot bottlenecks: you can see where deals pile up or drop out.
- Coach reps: managers can see which deals need help and which reps struggle at which stage.
- Stay accountable: if every deal has an owner, a stage and a next step, there is little room for guesswork.
How a sales pipeline works
A sales pipeline works by moving each deal through a fixed series of stages. Each stage has three things attached to it:
- An exit criterion: the specific event that lets a deal move forward, for example "budget confirmed" or "proposal sent". This keeps reps from advancing deals on a hunch.
- A probability: the share of deals at that stage that historically end up won. Early stages have low probabilities and late stages high ones.
- An owner and a next step: one rep is responsible, and every open deal has a dated next action.
Add up the value of the deals in each stage, multiply by that stage's probability, and you get the weighted pipeline: a revenue forecast for the period. Deals also leave the pipeline, either as closed-won revenue or as closed-lost, and the reason for losing is worth recording. Over time, your own conversion data replaces the starting guesses, and the forecast gets more accurate.
Because the number of deals shrinks at every stage, a healthy pipeline is top-loaded: more deals at the start than at the end. If the early stages are thin, you will see a revenue gap a few weeks or months later.
The 6 sales pipeline stages
Stage names vary by business, and a long enterprise sale will need more steps than a short transactional one. This is a good starting set for a B2B sales pipeline, with example probabilities you should replace with your own conversion data:
| Stage | What happens | Exit criterion | Example probability |
|---|---|---|---|
| 1. Prospecting | Leads come in (inbound) or reps go after them (outbound). | The lead replies or shows interest. | Not forecast |
| 2. Qualification | The rep checks need, budget, timeline and decision-maker. | The lead meets your qualification criteria. | 10% |
| 3. Discovery and demo | The rep learns the prospect's requirements and shows the product. | The prospect confirms the problem and wants a proposal. | 25% |
| 4. Proposal | A tailored proposal or quote is sent. | The prospect is reviewing pricing with the decision-maker. | 50% |
| 5. Negotiation | Terms, scope and pricing are agreed. | Verbal yes and contract sent. | 75% |
| 6. Closed won or lost | The deal is signed, or the prospect says no or goes quiet. | Signed contract, or an agreed close-lost reason. | 100% or 0% |
After closed-won, hand the customer over to onboarding and customer success. Cross-sells and upsells then feed new deals into the pipeline, and our guide on how sales and customer success work together covers that handover.
If you are unsure what counts as a lead, a prospect or an opportunity, see lead vs. prospect vs. opportunity before you define your stages.
Sales pipeline vs sales funnel
People often use "sales pipeline" and "sales funnel" interchangeably, but they answer different questions. The pipeline tracks your sales process: the steps a rep takes to win a specific deal. The funnel tracks the buyer's journey and how a large audience narrows down to customers.
| Sales pipeline | Sales funnel | |
|---|---|---|
| Viewpoint | The seller: what the rep does | The buyer: where the prospect is in their decision |
| Typical stages | Qualification, demo, proposal, negotiation, closed | Awareness, consideration, decision |
| Unit counted | Individual deals with a value | Leads and conversion volumes |
| Main use | Forecasting, deal management, coaching | Marketing and conversion analysis |
| Owner | Sales | Marketing and sales together |
In practice you use both: the funnel tells you how well you turn attention into leads, and the pipeline tells you how well you turn leads into revenue. For the funnel side, see our guide to analyzing your sales funnel.
How to build a sales pipeline
A well-built pipeline turns your sales process into a repeatable system that can be improved over time. These six steps get you there.
1. Define your sales cycle and pipeline parameters
Start with the numbers. How long does it take to close a typical deal, and how many stakeholders are involved? Your cycle depends on product complexity, deal size, lead source and whether the product needs customization.
Then work backward from your target. If you need $150,000 in new revenue this quarter and your average deal is $10,000, you need 15 closed deals. At a 30% win rate, that means roughly 50 qualified opportunities. This is the starting point for your pipeline coverage target, which we come back to below. Our guide to sales targets shows how to set the revenue number in the first place.
2. Define pipeline stages and exit criteria
Pick four to seven stages, name each one after what the buyer has done (not what the rep has done), and write down the exit criterion for each. A stage with no clear exit criterion becomes a parking lot. Also decide when to disqualify a lead, and who follows up with cold ones.
3. Load your leads and qualify them early
Get every existing prospect into the system and put each in its stage. Then qualify quickly. A short checklist covering a verified need, budget, timeline and decision authority saves reps from investing time in deals that will never close. A lead scoring system helps if you have more leads than reps can call. For tracking what reps do at the top of the pipeline, see sales activity tracking.
4. Keep the top of the pipeline full
Pipelines dry up quietly, because a full pipeline today can hide an empty one in six weeks. Reps should prospect every week, not only when the pipeline looks thin, and managers should watch the number of new opportunities created per week as a leading indicator.
5. Nurture deals with a defined next step
Every open deal should have a next action with a date. Early on that may be a personalized email addressing a pain point; later it may be a demo, a case study or a call with the buyer's decision-maker. Speed matters at the start, because a lead that waits days for a reply is likely to talk to a competitor first.
6. Review, measure and refine
Once deals are flowing, look at how long deals stay in each stage, where they drop out and what the closed-lost reasons say. Then set targets for the numbers below, such as pipeline coverage, win rate and sales cycle length. Adjust stage probabilities as your own data replaces the starting estimates.

Sales pipeline metrics to track
Sales pipeline metrics tell you whether the pipeline is big enough, moving fast enough and converting well enough to hit your target. These are the seven most useful ones.
| Metric | Formula | What it tells you |
|---|---|---|
| Pipeline coverage | Open pipeline value for the period ÷ quota for the period (shown as, e.g., 3x) | Whether there is enough pipeline to hit target |
| Weighted pipeline | Σ (deal value × stage probability) | A realistic revenue forecast for the period |
| Stage conversion rate | Deals that moved to the next stage ÷ deals that entered the stage × 100 | Where deals drop out of the pipeline |
| Win rate | Won deals ÷ (won + lost deals) × 100 | How good the team is at closing qualified deals |
| Average deal size | Total value of won deals ÷ number of won deals | How much each win is worth |
| Sales cycle length | Average days from opportunity created to closed-won | How quickly deals turn into revenue |
| Pipeline velocity | (Qualified opportunities × average deal size × win rate) ÷ sales cycle length in days | Revenue the pipeline generates per day |
A few notes on using them:
- Coverage depends on your win rate. The right coverage ratio is roughly 1 ÷ your win rate. With a 30% win rate you need about 3.3x coverage; with a 50% win rate, 2x. Use your own history rather than a generic rule of thumb.
- Weighted pipeline is only as good as your probabilities. Revisit them quarterly. See the weighted pipeline value KPI for the full method.
- Velocity shows which lever to pull. It has four inputs, and improving any one of them raises revenue per day. Our guide to sales velocity goes deeper.
Each metric has its own KPI page with calculation details: win rate of deals, average deal size, average sales cycle length, sales conversion rate and number of opportunities. For the wider set, see sales KPIs to track.
Sales pipeline example with numbers
Here is a worked sales pipeline example for a fictional team. All numbers are made up to show the math, so replace them with your own.
The team needs $150,000 more in closed-won revenue this quarter. Their open pipeline looks like this:
| Stage | Deals | Value | Probability | Weighted value |
|---|---|---|---|---|
| Qualification | 21 | $210,000 | 10% | $21,000 |
| Discovery and demo | 12 | $120,000 | 25% | $30,000 |
| Proposal | 8 | $80,000 | 50% | $40,000 |
| Negotiation | 4 | $40,000 | 75% | $30,000 |
| Total | 45 | $450,000 | $121,000 |
What the numbers say:
- Coverage: $450,000 ÷ $150,000 = 3.0x. With a historical win rate of 30%, the team needs about 3.3x (1 ÷ 0.30), so coverage is slightly thin.
- Forecast: the weighted pipeline is $121,000, about $29,000 short of the $150,000 target. The team should add new qualified deals or move late-stage deals faster.
- Velocity: with 45 qualified opportunities, a $10,000 average deal size, a 30% win rate and a 60-day sales cycle, pipeline velocity is (45 × $10,000 × 0.30) ÷ 60 = $2,250 per day, or about $67,500 per 30 days.
Now the manager has something to act on. Raising the win rate from 30% to 35% lifts velocity to $2,625 per day; shortening the cycle from 60 to 54 days lifts it to $2,500 per day. Both are easier to chase when the numbers are in front of everyone.
How to manage and clean your sales pipeline
Sales pipeline management is mostly routine. A pipeline full of old, optimistic deals produces a forecast nobody trusts, so schedule regular clean-ups.
- Review weekly. Hold a short pipeline review each week. Go through deals by stage, check each deal has a next step and a close date, and move or close anything that has stalled.
- Set stale-deal rules. For example, flag any deal with no logged activity in 14 days and any deal that has sat in one stage for more than twice your average. Pick thresholds based on your own sales cycle, then enforce them.
- Keep close dates honest. Push out any close date that has passed. Deals past their date inflate the forecast.
- Enforce exit criteria. A deal should only move forward when its exit criterion is met, not when the rep feels optimistic.
- Require key fields. Deal value, close date, owner, stage and next step should be mandatory. A deal missing them cannot be forecast.
- Practice closed-lost hygiene. Close dead deals promptly and record the reason (price, timing, competitor, no decision). The pattern across lost deals often tells you more than the wins.
- Review each quarter. Recalculate stage conversion rates and update your stage probabilities.
Good pipeline hygiene does not need to be heavy: most of it comes down to a few mandatory CRM fields and a weekly meeting that happens on time.
Track your sales pipeline on a dashboard
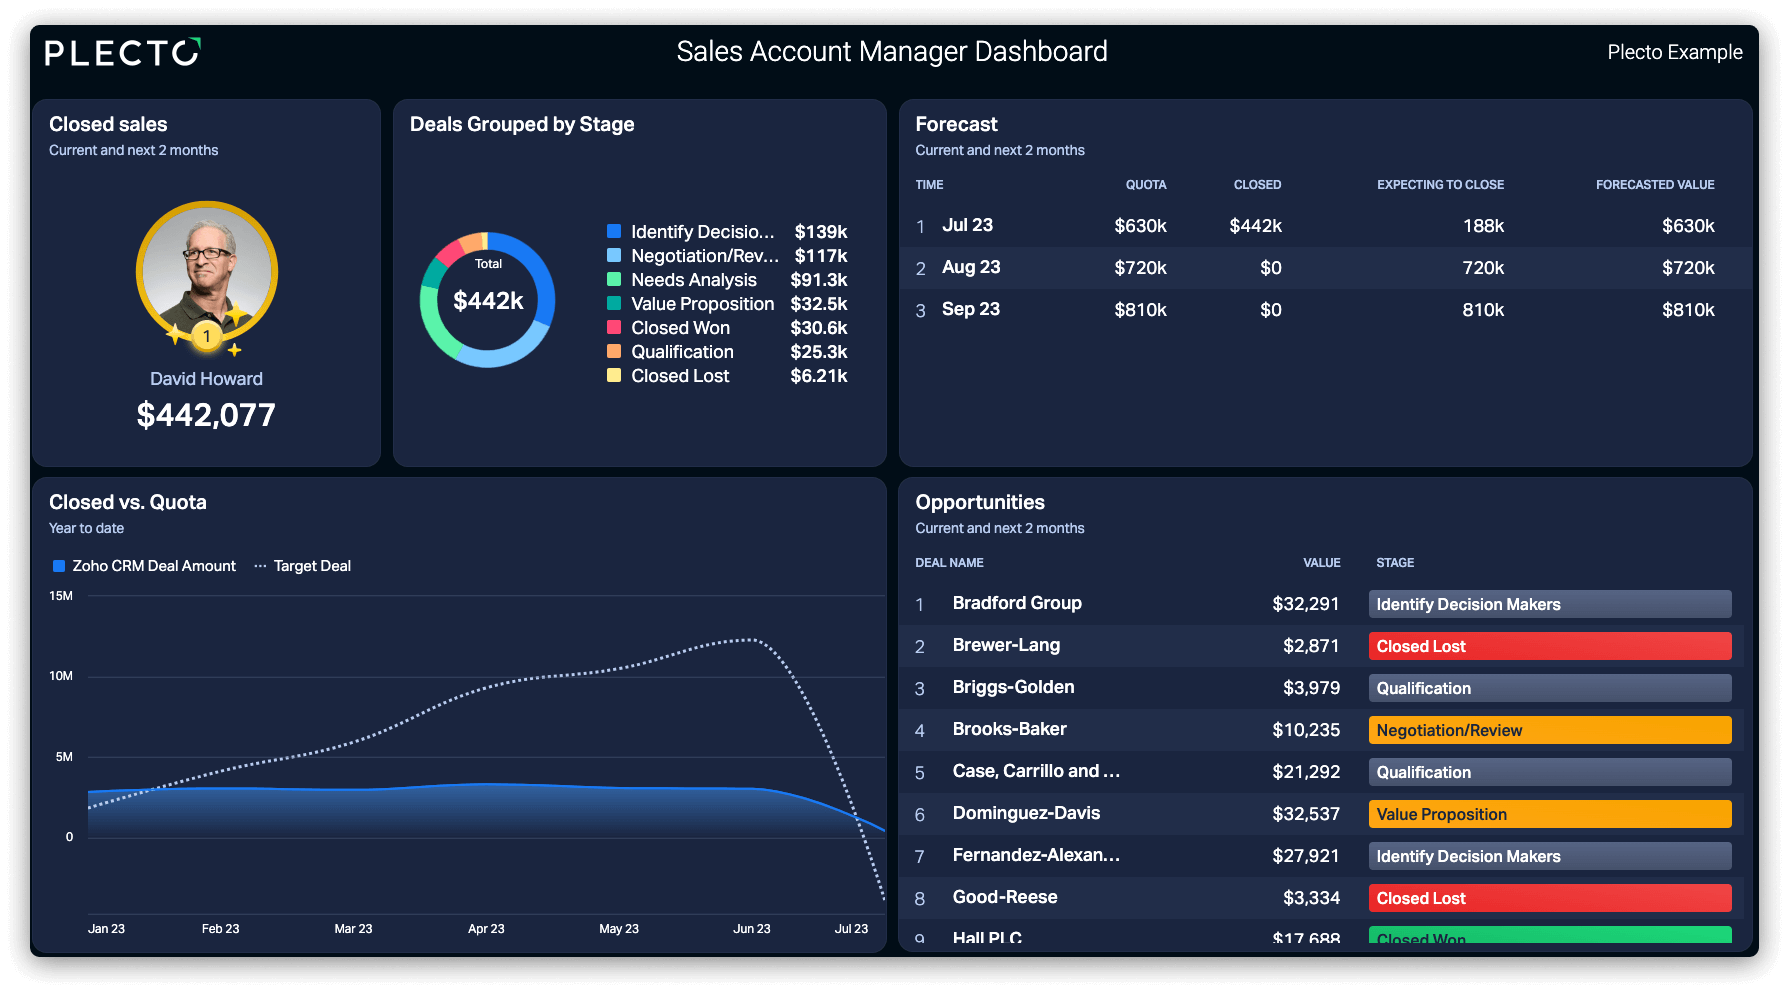
A sales pipeline lives in your CRM, but the numbers that matter are easy to miss when they are buried in reports. Plecto pulls deal data from CRMs such as HubSpot, Salesforce and Pipedrive and turns it into real-time sales dashboards that show pipeline value by stage, win rate, deal size and progress to quota, per rep and per team. Plecto connects to 150+ tools, and data typically refreshes about every two minutes.
A good sales pipeline dashboard keeps it simple: our sales opportunities dashboard and other sales dashboard examples show what to include. Keep it to three to five KPIs per person, such as pipeline coverage, weighted pipeline, win rate and deals closed this week, and put the screen where the team sees it, including on an office TV. Pair it with automated reports for your weekly pipeline review.
Plecto also adds contests and instant notifications on top of the same data, so reps get a reason to keep their pipeline current. Sign up for a free 14-day trial, no credit card needed, and see your own pipeline on a dashboard.
Questions
Sales pipeline FAQs
A sales pipeline is a visual representation of all the open deals a sales team is working, organized by stage from qualified lead to closed-won or closed-lost. It shows how many deals are at each stage, what they are worth and what happens next, so managers can forecast revenue and find bottlenecks.
A typical sales pipeline has six stages: prospecting, qualification, discovery and demo, proposal, negotiation, and closed won or lost. Stage names and numbers vary by business. What matters is that each stage has a clear exit criterion, so deals only move forward when the buyer has taken a defined step.
A sales pipeline tracks the seller's process: the steps a rep takes to win each deal, with deal values attached. A sales funnel tracks the buyer's journey, from awareness to decision, and focuses on conversion volumes. Teams use the funnel for marketing analysis and the pipeline for forecasting and deal management.
The most useful sales pipeline metrics are pipeline coverage, weighted pipeline, stage conversion rate, win rate, average deal size, sales cycle length and pipeline velocity. Together they show whether the pipeline is big enough, how fast it moves and where deals drop out. Start with coverage and win rate if you only track two.
Pipeline velocity is the revenue your pipeline generates per day. The formula is (number of qualified opportunities × average deal size × win rate) ÷ sales cycle length in days. For example, 45 opportunities, a $10,000 average deal, a 30% win rate and a 60-day cycle give $2,250 per day.
The right pipeline coverage depends on your win rate. A rough guide is 1 ÷ win rate: at a 25% win rate you need about 4x your quota in open pipeline, and at 50% about 2x. Use your own historical win rate instead of a generic benchmark, and revisit it every quarter.
Review the pipeline weekly, check that every deal has an owner, stage, value, close date and a dated next step, and flag deals with no recent activity. Push out expired close dates, close dead deals with a recorded reason, and update stage probabilities each quarter so the forecast stays realistic.
Connect your CRM to a dashboard tool that shows pipeline value by stage, win rate and progress to quota, and refreshes automatically. Plecto connects to CRMs like HubSpot, Salesforce and Pipedrive and displays these numbers on dashboards for desktop, mobile and office TVs, typically refreshing about every two minutes.
Start your 14-day free Plecto trial today.
Enjoyed the article? Share it:


SAGE CRAWFORD