When it comes to business reporting, one size does not fit all. Plecto's new report charts allow you to present your data in any way you will ever need.
Reports support the following charts and graphs:
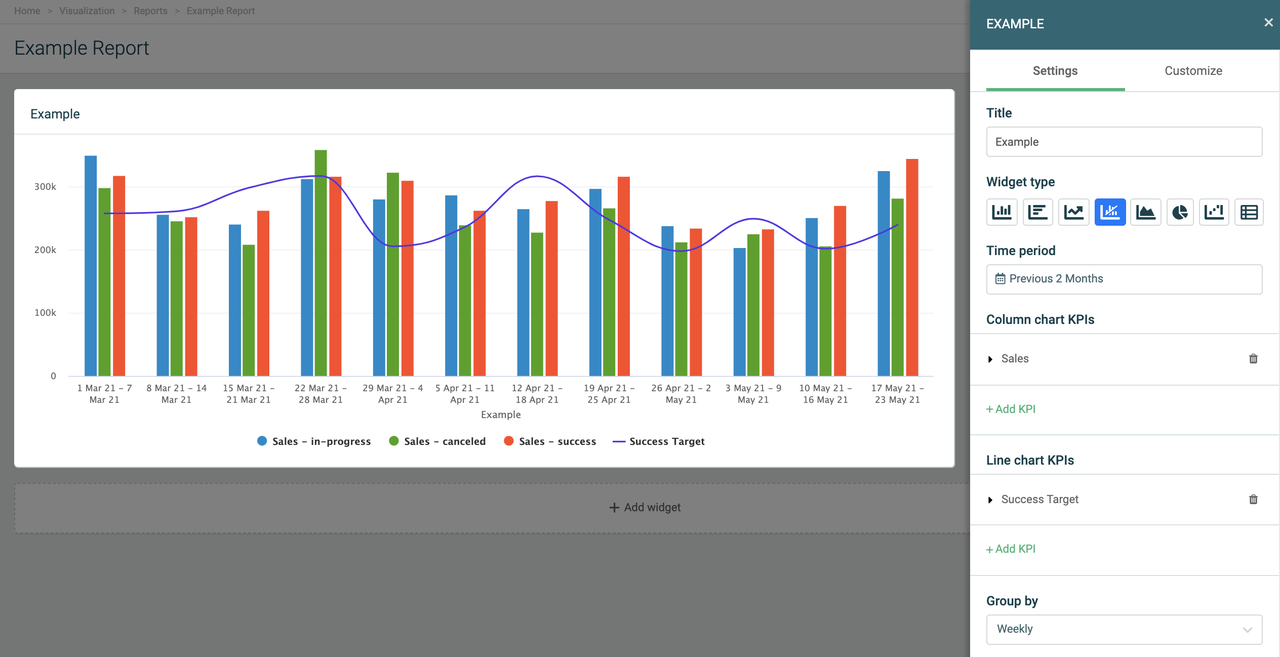
- Column charts
- Bar charts
- Line graphs
- Combo graphs
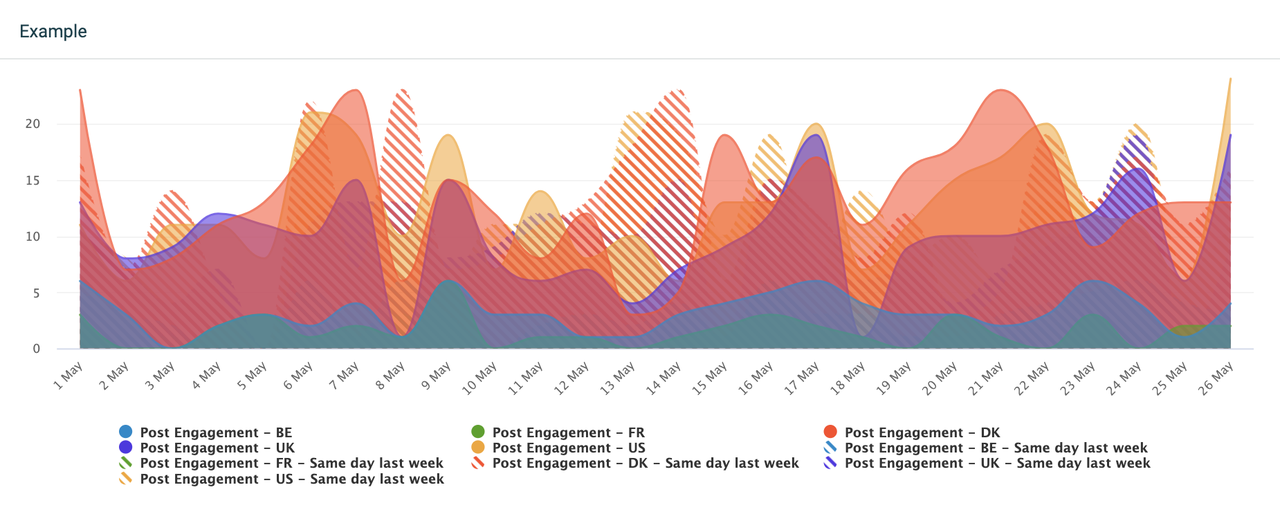
- Area charts
- Pie/Donut charts
- Waterfall graphs
- Tables