Optimize retention, reduce churn and improve customer health - all with customer retention dashboards.
Who looks at it
Essential for Customer Service and Success Managers, Chief Revenue Officers, the CEO and CFO.
Focus area
This dashboard is the go-to visual for all things related to churn.
Purpose
Perfect for identifying - and taking immediate action on - areas of concern regarding your customer retention.
What integrations are used

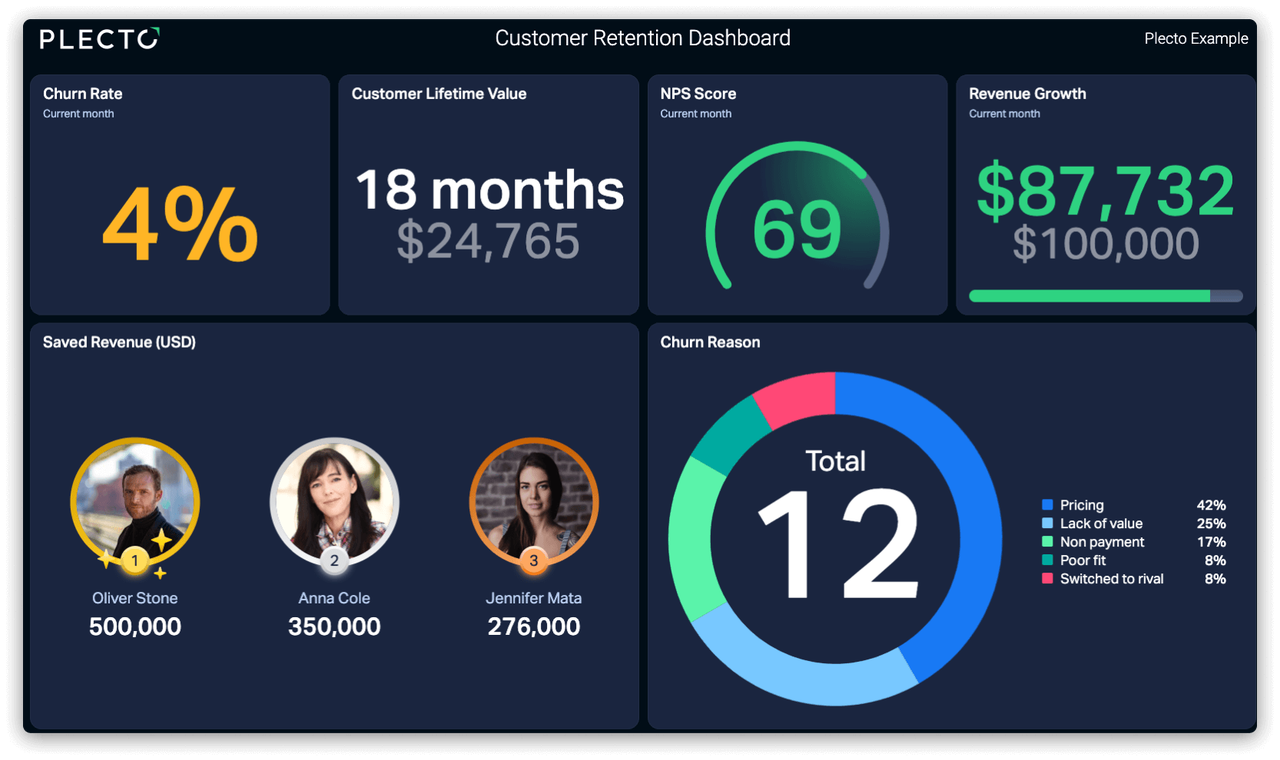
Customer retention dashboards measure the key metrics related to maintaining your customers. This dashboard is essential for all customer service teams, especially for any company with a subscription-based business model. Monitoring your customer retention data helps drive data-driven decisions as well as identify churn concerns before they escalate.
Customer retention dashboards give you a cohesive, digestible view of KPIs related to churn, all on one screen – making it easy to quantify churn that's happened and prevent future churn.
Bring together core metrics from customer service, sales, and finance. By centralizing your metrics, ensure that everyone is working toward the common goal of reducing churn.
Show underlying KPIs on your dashboard to identify indications that churn is imminent. So you can stay proactive and focus on where and what's needed to prevent and even reverse churn.
The percentage of your customers who have churned over a specific period.
The average value a customer will generate for your business throughout their business relationship.
How much churn you have prevented by showcasing your agents' success.
Measures customer satisfaction and loyalty based on survey responses.
Enables you to identify trends into why your customers have churned.
Measures how much your company is growing by
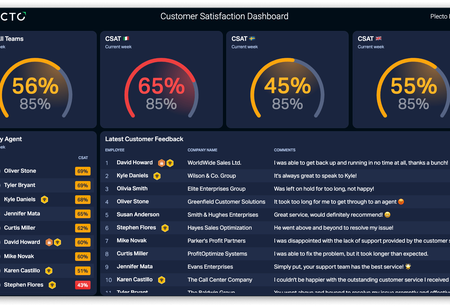
Keep track of customer satisfaction, agent feedback and more with real-time CSAT dashboards!

Get actionable, real-time insights into the performance of your customer service team with customizable dashboards for support teams.
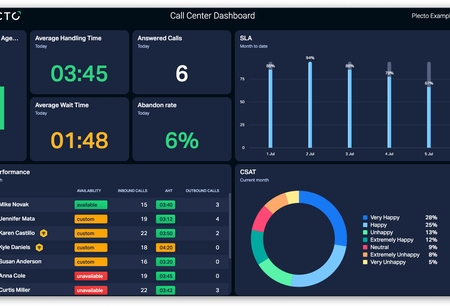
Struggling to get the full picture of your call center operations? Use real-time call center dashboards and take instant action on your call center metrics.
No credit card required.