
Project Management Dashboards
Monitor your progress across teams on real-time project management dashboards
Scale up your Project Management by visualizing all the relevant KPIs across teams in real-time. Import data automatically from your PM systems and get the best overview of your projects.
Visualize and share the progress with your team
Choose the KPIs that you want to monitor
Get the best overview of your project’s progress by displaying relevant KPIs on shared dashboards such as project statuses, current tasks the team is working on, budgets, time spent, and much more.
Customize your dashboard with visual widgets
Visualize your projects’ KPIs in the most engaging way with our selection of widgets, and give your team the best insight into their progress. Take your projects to the next level!
Choose the best KPIs for your teams' projects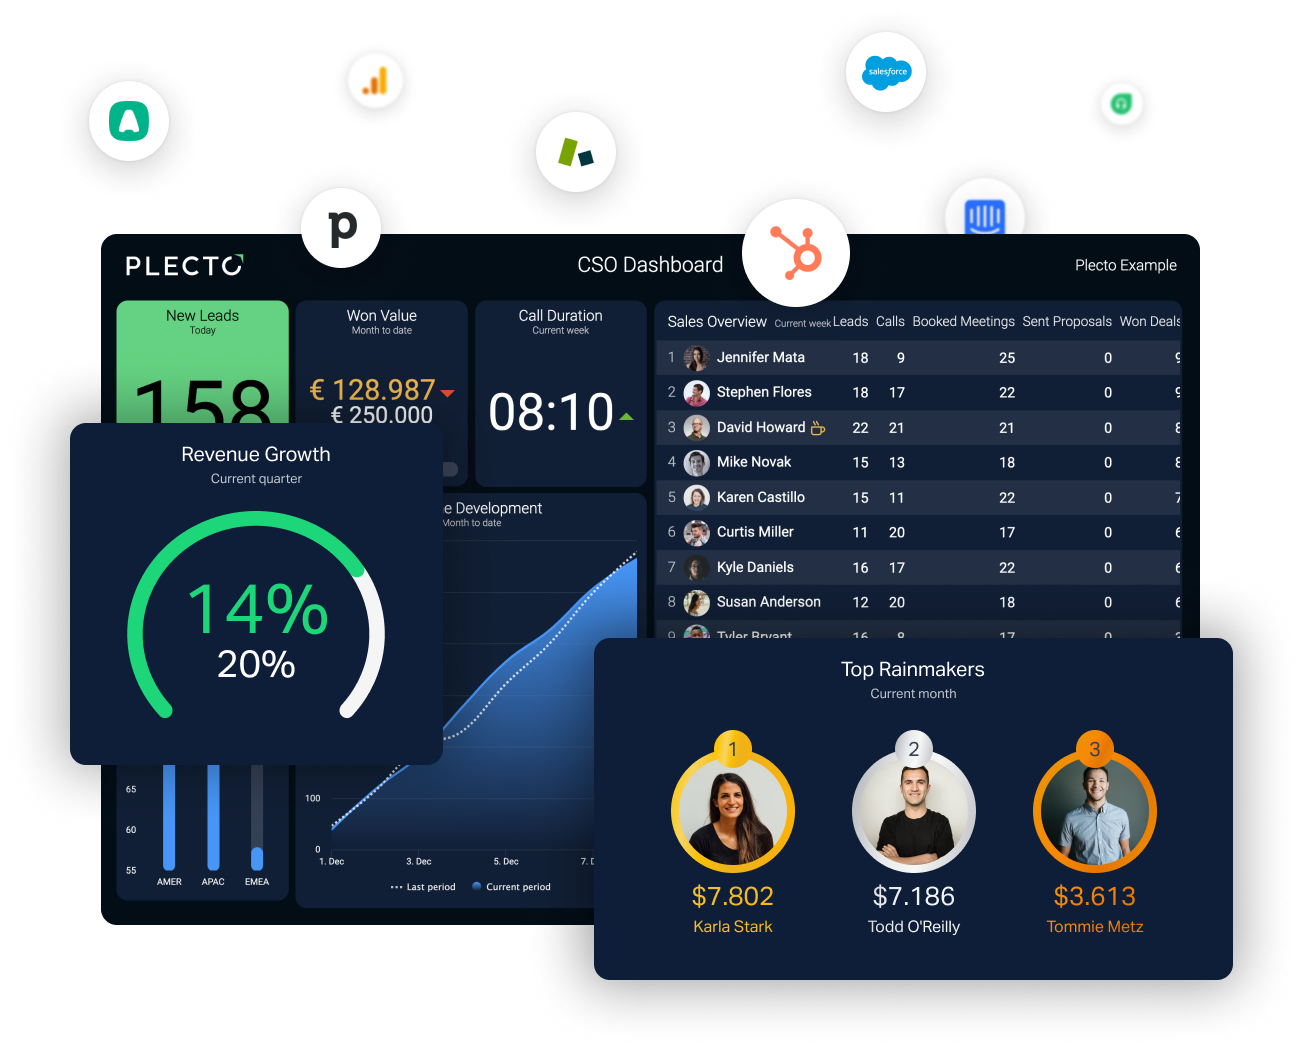
Stay on top of projects with real-time updates
Keep an eye on your budgets
Set alerts to trigger whenever your project exceeds a budget, so you can manage your funds effectively.
Stay updated on the progress
Visualize the status of your different projects in real-time, and get notified whenever activities are completed.
Set personalised notifications to trigger automatically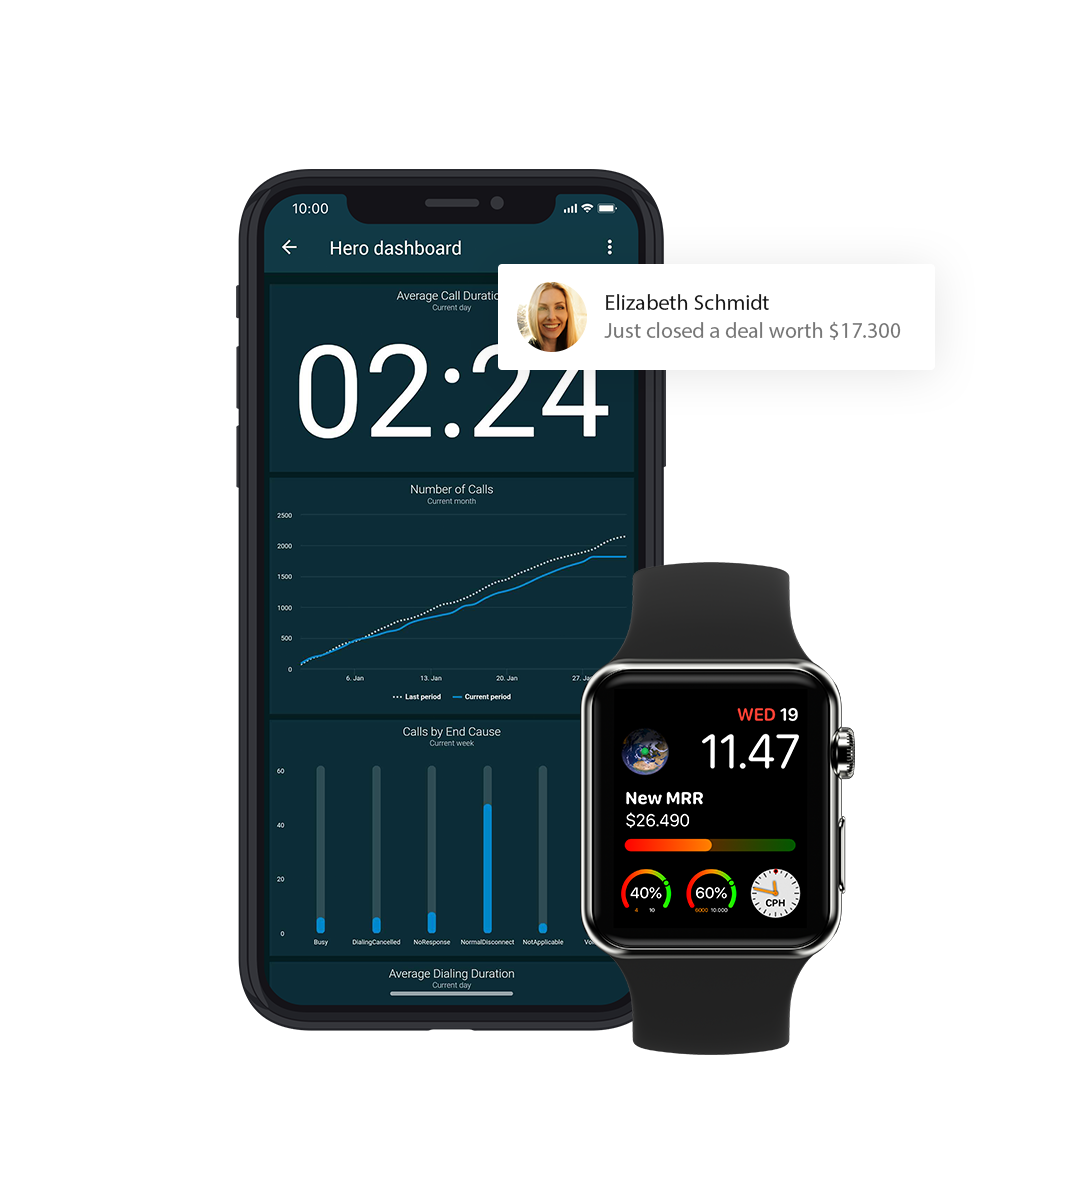
Make data-driven decisions with the project management dashboards
Keep your projects on track
Use your dashboard and real-time insights to monitor the costs of projects and time spent on each task, to ensure your team stays on track with budgets and deadlines.
Create a data-driven culture for your business“Plecto gives a clear insight and one single point of truth. We share the dashboards with the whole team to make it visible and tangible for everyone.”
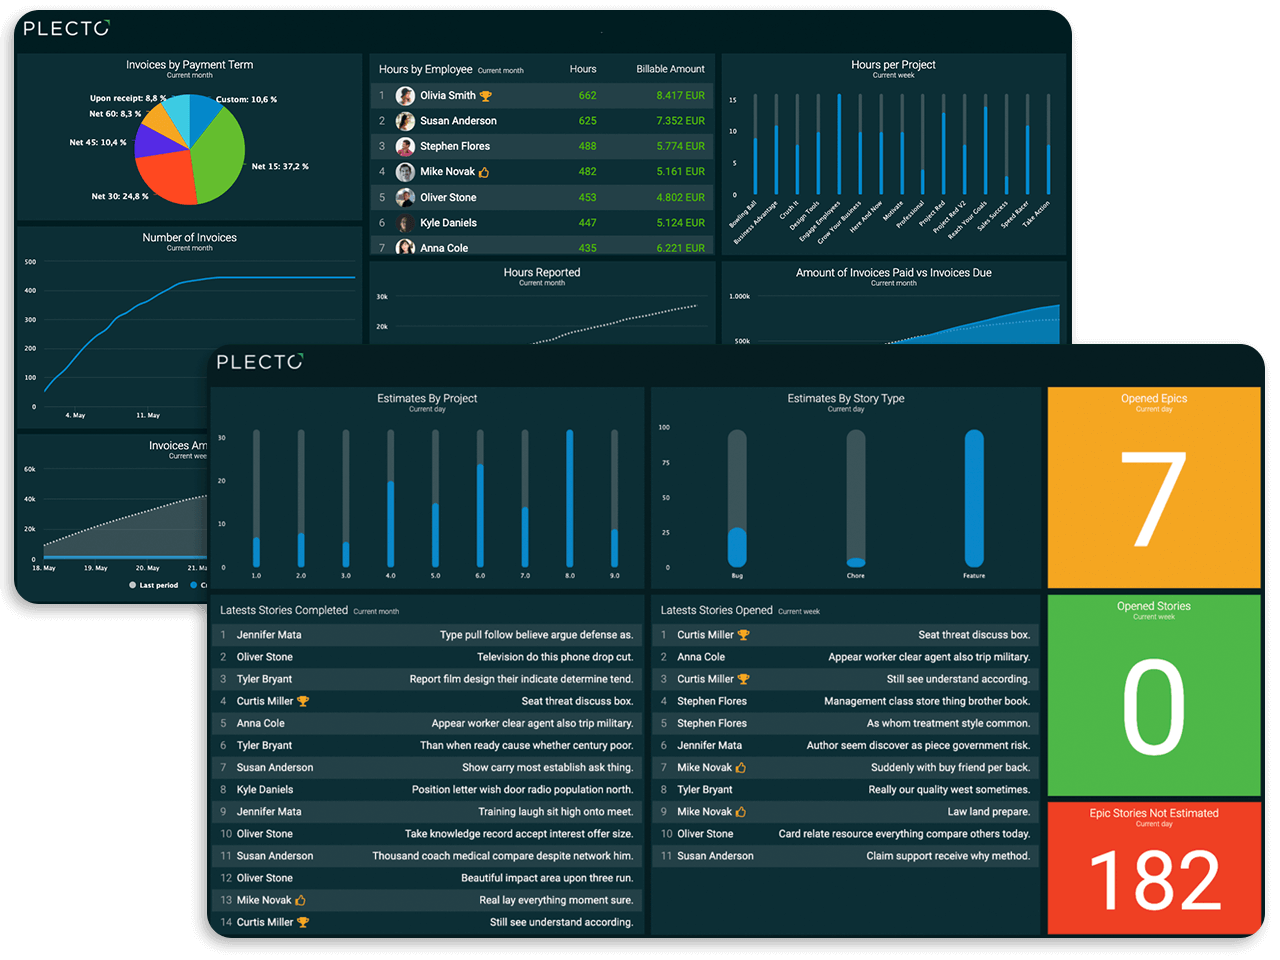
Create cross-functional dashboards
Share valuable insights across departments
Give your team across departments the best overview of their progress and join forces for a successful project. Adapt the learnings from your projects to the different teams, and update your business with the most relevant data.
Combine data for cross-functional performance
Gather data from different integrations and share the learnings with your various teams. Give your employees the latest insights and promote data-driven decision-making, where all your departments can contribute to the project.
Want to know more benefits of using Plecto?
Import your data automatically into Plecto
Integrate with your usual systems
Plecto has 150+ integrations with the most-used systems from every department, so you can easily import your data into the dashboard and monitor the progress of your projects.
Display your data in real-time, automatically
Choose the type of data that you want to display on your dashboard through our integrations or, if you prefer, enter the data manually or connect to your Excel sheets.
Find the integrations you need!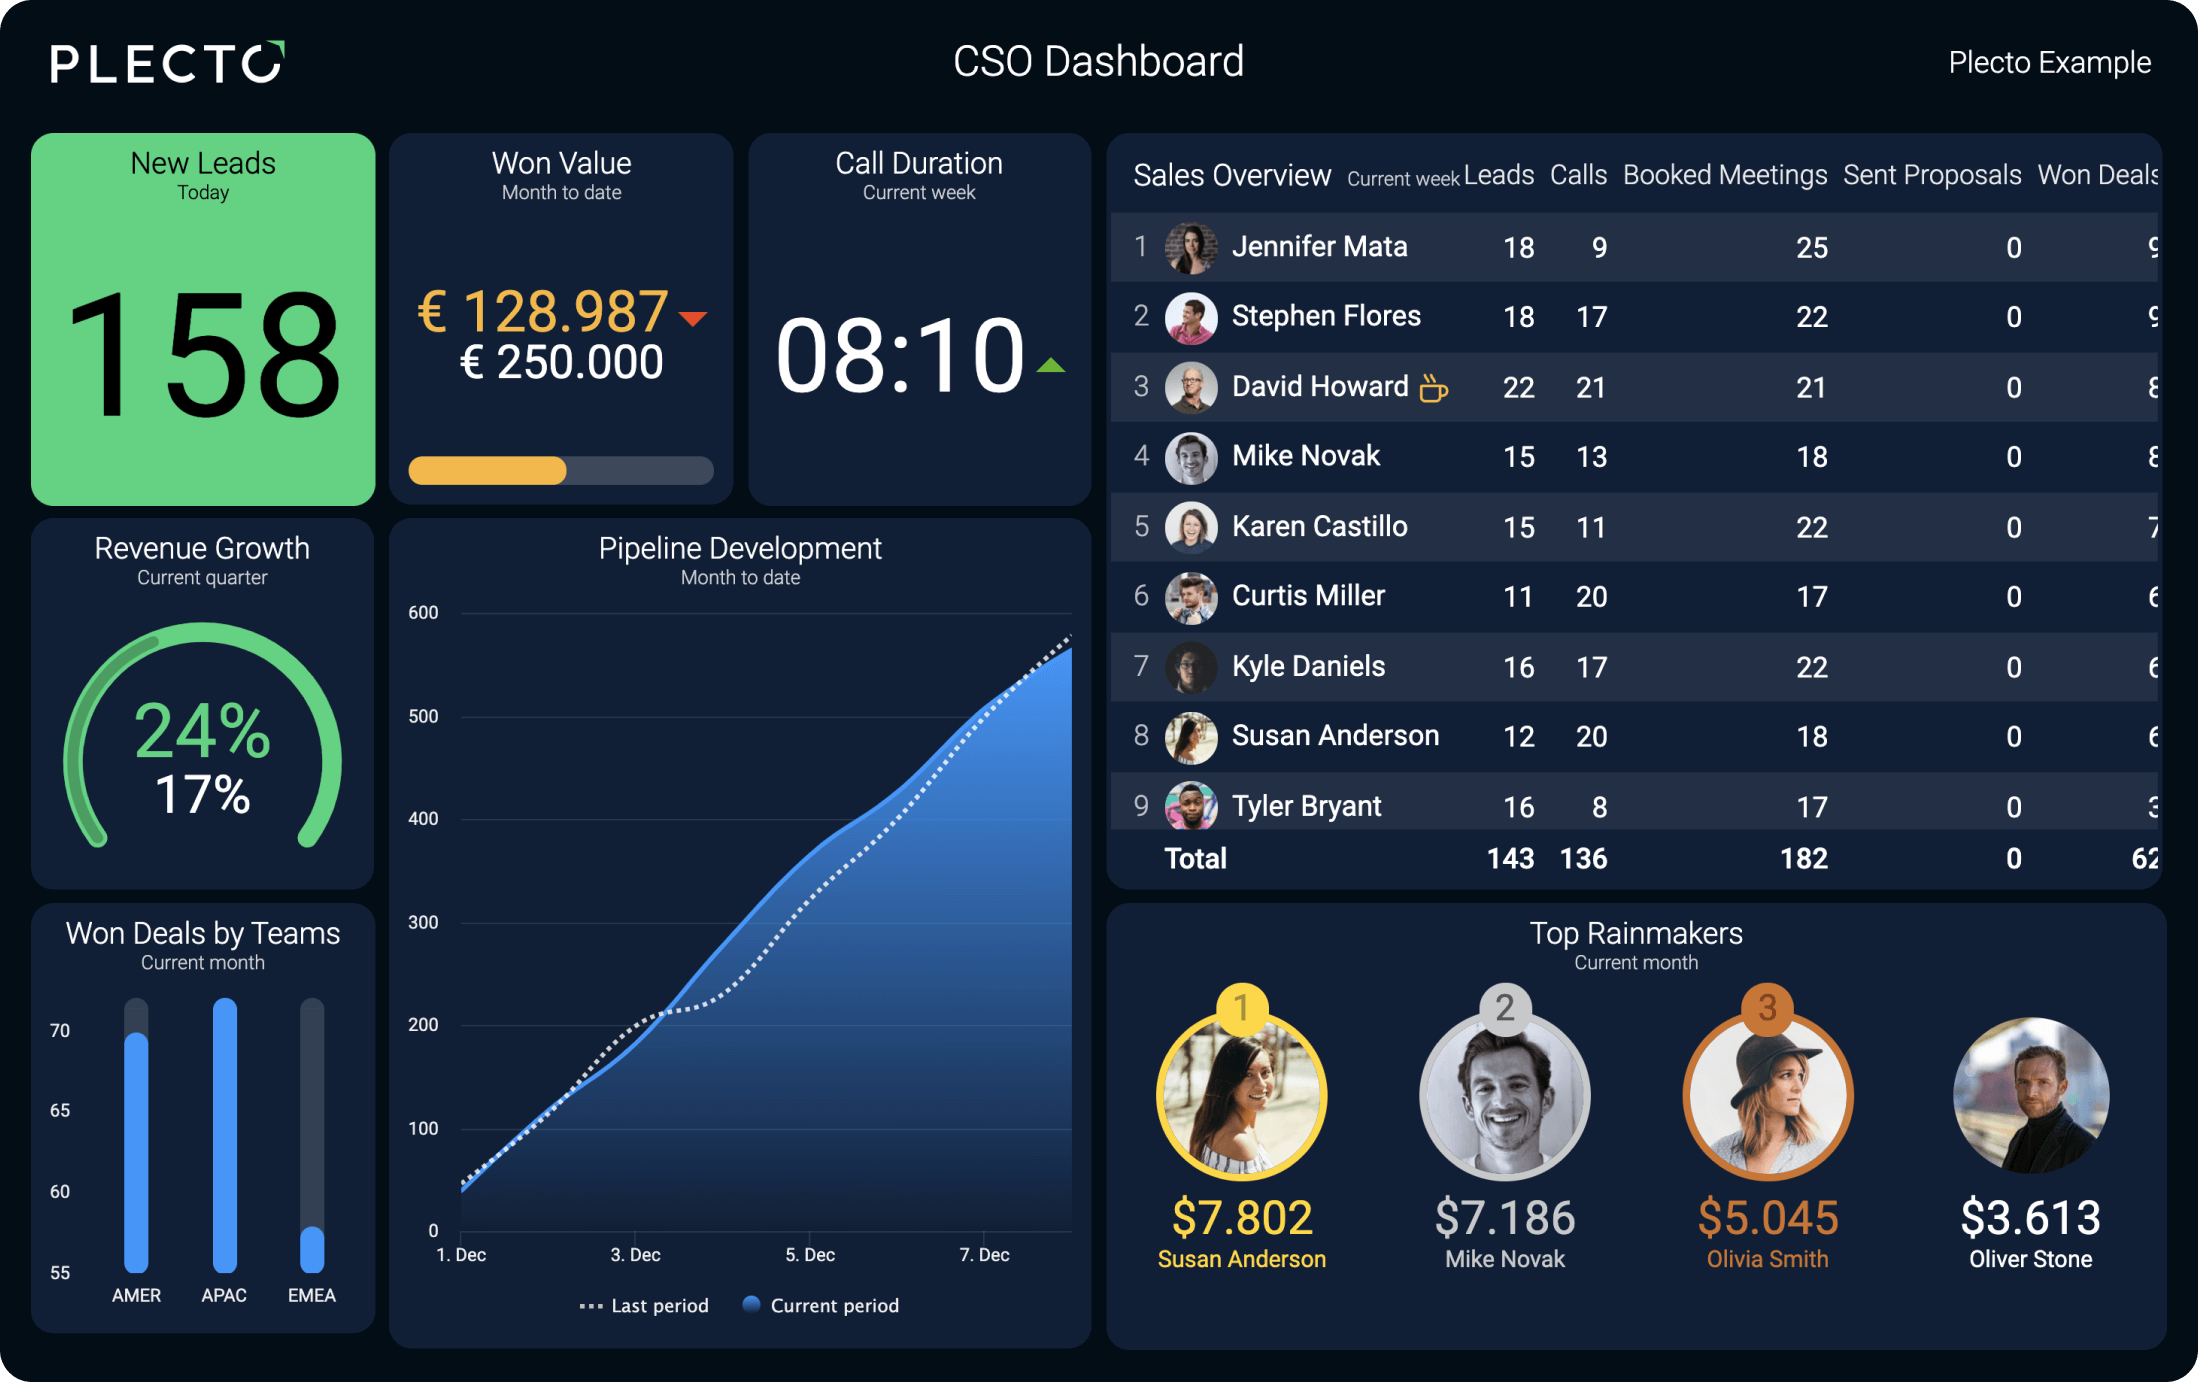
Create automatic reports in just one click
Stop wasting time reporting
Stop spending your time creating reports about every project. With Plecto, you can create your reports automatically, and receive them done in PowerPoint or Excel format.
Personalize your reports for each project
Every project is different, and so are your reports! You can choose to create reports per team, employee or location, and create the best overview for each project in no time.
Read more about automatic reports here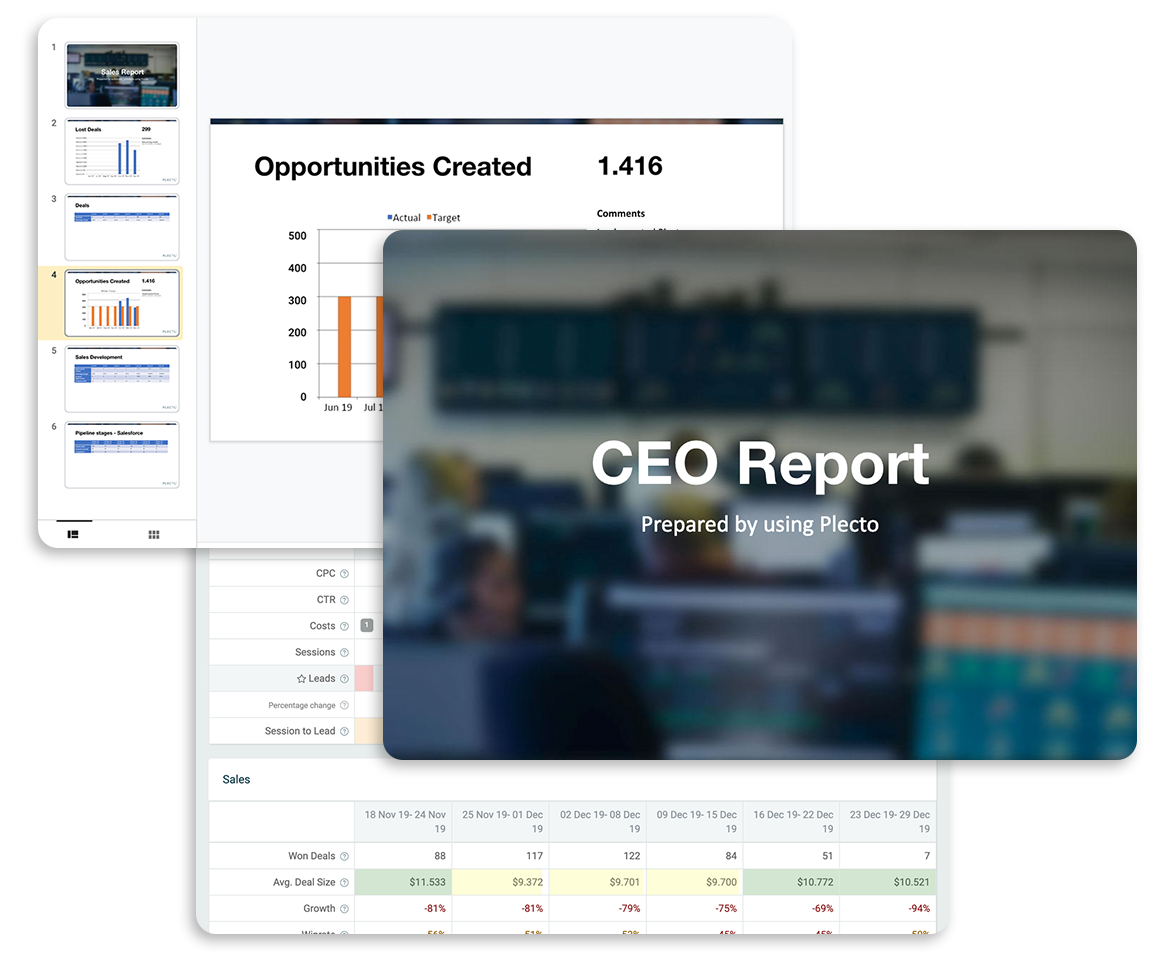
Say goodbye to endless Excel sheets
Automate your calculations
You no longer need to spend all your time entering your data in Excel. With Plecto, you just select the formulas once, and forget about it!
Display real-time data, 24/7
In a couple of minutes, you can have your dashboard up and running, displaying your most relevant data in real-time. Get the best overview of your projects at any time!
Learn more about real-time dashboards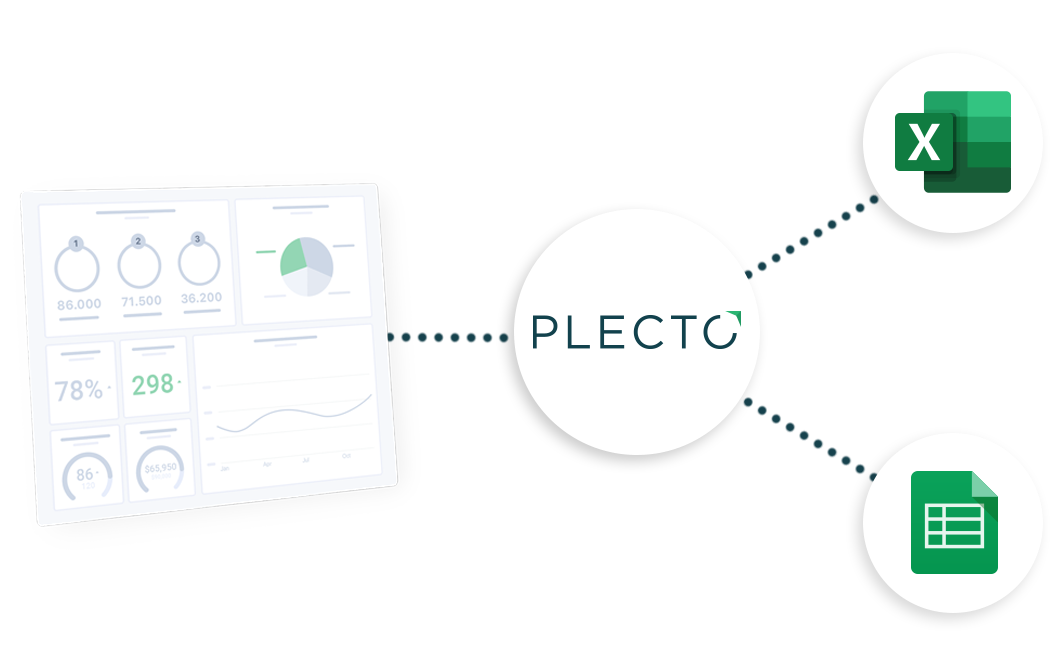
How it works
1. Connect your data sources
One-click real-time integration with our dashboards to the most popular CRM, support and other business systems.
2. Build dashboards
Use our prebuilt KPI dashboards or customize your own by using formulas to calculate more advanced metrics.
3. Boost team performance
Share real-time insights with your team and boost performance by 20% with visualizing data on dashboards.