
Combine Facebook Ads with your other key systems
Integrate your Facebook data with platforms like Google Analytics and your CRM to see exactly how much you're spending and how it impacts your business. Build dashboards that provide a complete picture of your marketing efforts.
Access Your Data Anytime, Anywhere
Keep your ad performance visible across the office with TV displays, track metrics on your computer, or check in from anywhere with our iOS and Android apps. Your key insights are always within reach.
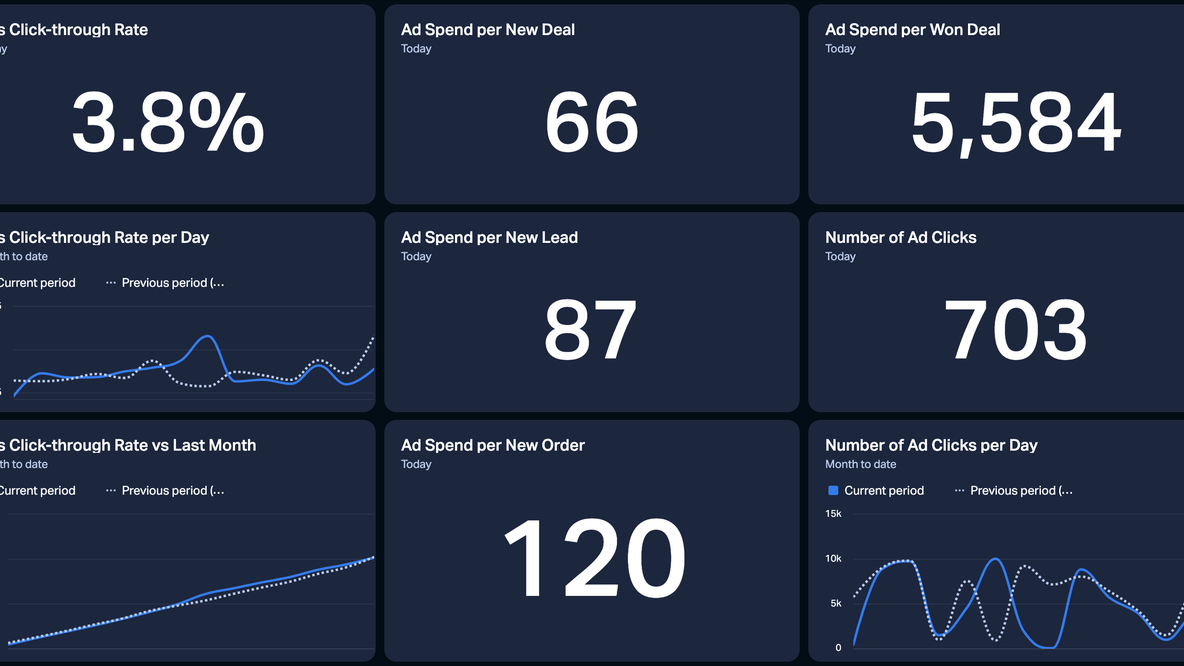
Stay on Top of Your Facebook Ads Performance
Monitor your campaigns, ad groups, and individual ads with live dashboards that give you a full overview of your performance. Get clear, actionable insights to optimize your budget and maximize results.