
Table of contents:
10 Energy Company KPIs for Better Customer Service
While inflation is starting to subside in many sectors, the U.S. Energy Information Administration expects most American households to spend more on energy this winter than in previous years. According to the Consumer Price Index, energy costs for the average American were up 13 percent in November 2023 vs. November 2022 due to higher energy costs and colder temperatures.
With higher costs come higher customer expectations – and in a commodity industry like energy, there’s little room for companies to differentiate themselves. While green energy has an edge with today’s consumers, energy companies don’t have much pricing flexibility if they want to maintain their profit margins – leaving customer service as the main differentiator.
Tracking these ten energy KPIs is critical for companies that want to maintain or grow their market share based largely on the quality of their customer service.
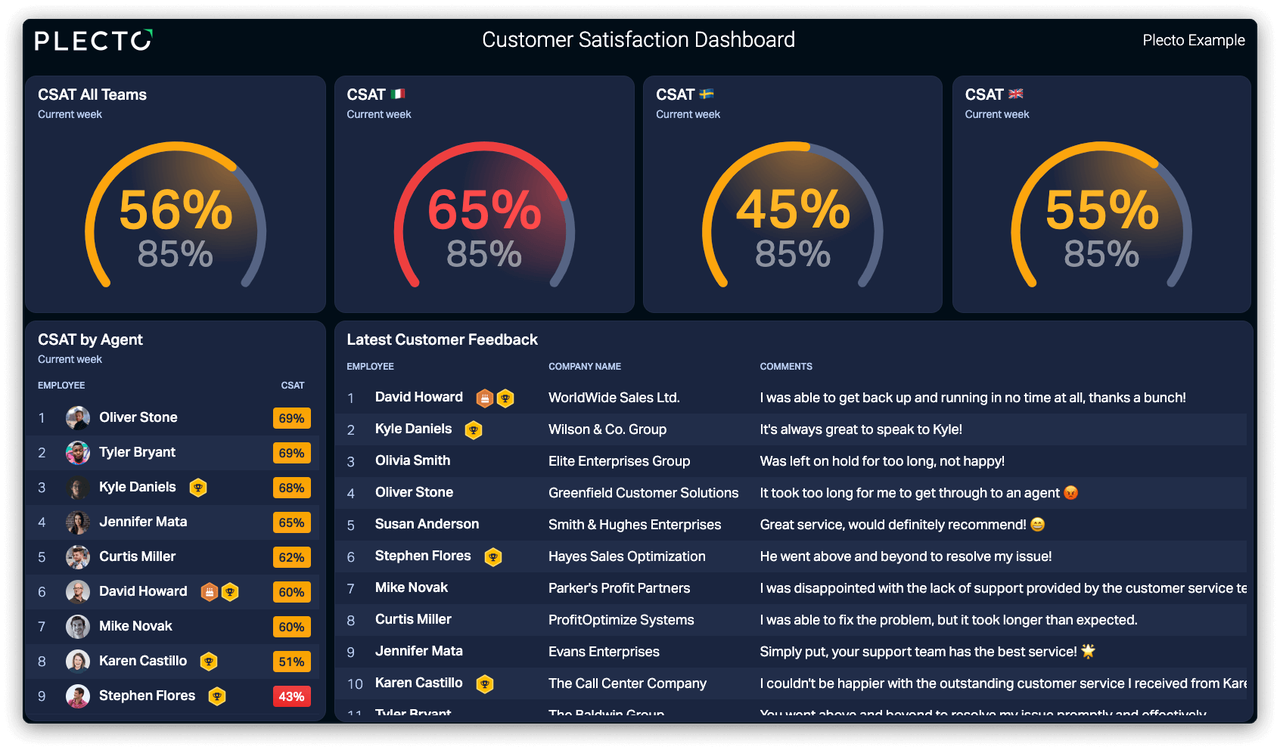
1. Average Customer Satisfaction Score (CSAT)
If you track only one of our utility companies KPIs, choose this “big picture” KPI. CSAT is the most important of all our energy KPIs to track if you want a straightforward answer to whether your customers are satisfied with your company’s customer service. It measures how well the service provided aligned with the customer’s expectations based on a one-question survey: On a scale of 1–5, how satisfied were you with today’s service?
Use this formula to calculate your company’s CSAT:Number of Positive Ratings (i.e., 4 or 5) / Total Number of Responses x 100
While benchmarks vary by industry and channel, here are some average CSAT benchmarks for the three most common support channels:
- Phone: 76%
- Email: 61%
- Chat: 75%
2. First Contact Resolution (FCR)
After CSAT, FCR is one of the most important energy KPIs to track for a bird’s-eye view of your company’s service quality. This KPI measures the percentage of calls your reps successfully resolve in a single contact without having to follow up or the customer having to call back because their issue wasn’t resolved.
In other words, FCR measures the percentage of incoming calls that receive ideal outcomes. Customer satisfaction has two main drivers: how quickly the issue was resolved and how well the solution met the customer’s expectations. If your team is solving 70–75 percent of issues in a single contact, your company is leading the pack when it comes to delivering great service!
3. Average Time to Resolution
While your team should strive to resolve every inquiry the first time, some issues can’t be resolved in a single contact. Average time to resolution is one of the most important energy KPIs for understanding how efficiently your team is resolving all inquiries – including the complicated ones.
This KPI tracks the average time it takes from the customer’s first call about an issue until the issue is satisfactorily resolved. Twelve hours or less is broadly considered the standard of excellent service.
4. Average Wait Time/First Response Time
This is another one of our time-related energy company KPIs. This KPI measures the average length of time a customer spends on hold before speaking with someone. Consistently long wait times are often a sign that the contact center is understaffed, doesn’t have the right processes in place, or the team is underperforming. This KPI can be a key driver of our next KPI – average abandonment rate.
5. Average Abandonment Rate
HubSpot research found that 90 percent of customers rate an ”immediate” response as “important” or “very important” when they have a customer service question. As a service-minded company, you’ll want to track the average abandonment rate as one of your energy company KPIs.
The average abandonment rate tracks how many callers hang up before speaking with someone. It’s one of the most important energy KPIs because a high abandonment rate could point to various issues including complicated phone menus and understaffing, which lead to frustrated customers and long queues.
Time-pressed customers expect efficient service, and they’re likely to hang up if they’re frustrated by the phone menu or feel that they’ve been waiting too long to speak with a rep. This is one of the utility KPIs that should be as close to “zero” as possible.
6. Churn Rate
Despite your company’s best efforts, some customers will switch to one of your competitors. While you can’t stop them from defecting, tracking churn rate can help you keep tabs on how many customers you’re losing.
According to experts, an annual churn rate of 5–7% isn’t anything to worry about. However, a higher churn rate could indicate a trend – and it’s imperative to identify the cause and take action before irreversible damage is done via lost revenue and negative word of mouth.

7. Trustpilot Score
Speaking of negative word of mouth, 79 percent of consumers surveyed said that they trust online business reviews as much as recommendations from their friends and family. Therefore, especially for companies in highly competitive sectors like energy, it’s crucial to keep tabs on online chatter.
Trustpilot’s business product includes an analytics tool that enables companies to compare their ratings side by side with their competitors. This is a great starting point for establishing your KPI target while getting first-hand insight into what your customers think about your company – and what your competitors are doing right, and wrong.
8. Customer Lifetime Value (CLV)
One of most companies’ main goals is to retain customers and keep them spending money. CLV measures the total amount of revenue a customer generates during their business relationship with a company.
According to HubSpot research, 93 percent of customers are likely to keep buying from companies that provide excellent customer service. A high CLV is a good indication that your company’s customer service, pricing, and reliability all meet your customers’ expectations, which is causing them to continue to choose your company as their energy provider.

9. New Business Revenue
Companies must acquire new customers if they want to increase market share, and this KPI tracks how much income your company is generating from new customers. SalesForce research found that 82 percent of customers say that they’ve recommended a company based on excellent customer service.
This is proof positive that your existing customers can be a valuable resource for growing your business – so keep providing stellar service, and secure that positive word of mouth! To get the most insight out of this KPI, track it monthly or quarterly against a target percentage (e.g., 25% of revenue should come from new customers).
10. Employee Turnover Rate (ETR)
ETR measures the percentage of employees who voluntarily resign within a specified timeframe. Your company’s customer service reps are its greatest allies when it comes to customer retention.
Customer service is a notoriously high-turnover business – the average turnover rate for contact center employees was 58 percent in 2021. High turnover leads to higher costs related to recruiting, training, and onboarding new employees.
But even worse, it can negatively affect service quality due to veteran reps being spread thin while recent hires get up to speed. This KPI can help managers identify negative trends and look into what’s driving them.
On the other hand, above-average retention or rising retention rates are good indications that you have the right training, coaching, and incentive programs in place.
Use Plecto Dashboards to Get the Most from These Energy KPIs
These ten utility companies KPIs are an excellent first step toward collecting data-driven insights that can help your company stay competitive in an increasingly difficult market.
To get the most out of these energy company KPIs, display them where everyone can see them – on dashboards! Plecto’s integrations with Salesforce and popular telephony systems make it easy to visualize and track important contact center metrics in real time. Visualizing and sharing your most important KPIs on dashboards will help keep them at the top of everyone’s minds.
Sign up for a free demo, and see how Plecto can help your company provide the best-in-class customer service that will set you apart from your competitors!
Start your 14-day
free Plecto trial today.
Q&As
Why is customer service the main differentiator for energy companies today?
In the current economy, energy costs have risen significantly (up 13% as of late 2023), leading to much higher customer expectations. Because energy is a commodity industry with very little pricing flexibility, companies cannot easily compete on cost without hurting profit margins. This leaves customer service as the primary way to differentiate from competitors. Tracking specific KPIs is essential for energy providers that want to maintain or grow their market share based on the quality of their support.
What are the "Big Two" KPIs for a bird's-eye view of an energy company’s service quality?
The two most critical metrics are:
- CSAT (Customer Satisfaction Score): This is the "big picture" KPI. It measures how well the service aligned with expectations using a simple 1–5 scale. A strong benchmark for phone support in this industry is around 76%.
- FCR (First Contact Resolution): This measures the percentage of issues resolved in a single interaction. High FCR is a major driver of satisfaction because it hits the two main things customers care about: speed and effectiveness. If a team resolves 70–75% of issues on the first try, they are considered industry leaders.
How does tracking Average Time to Resolution on a dashboard help manage complex inquiries?
While FCR is the goal, some energy-related issues (like billing disputes or service outages) are too complex for one call. Average Time to Resolution tracks the journey from the first contact until the issue is fully closed. By visualizing this on a Plecto dashboard, managers can see if the team is meeting the "gold standard" of 12 hours or less. Real-time visibility allows managers to identify bottlenecks in these longer cases and intervene before a delayed resolution negatively impacts the company's CSAT or Trustpilot scores.
SAGE CRAWFORD
Content Manager