TV dashboards are essential to a data-driven workplace

Data is king in today’s business world, and the most successful companies know that the data they collect is a powerful resource for driving continuous improvement and ever-increasing success. Many of these companies have a proven track record of using dashboards to help them visualize their most important data and share it across teams and departments. Now, they’re turning to the next iteration of this tool – the TV dashboard.

Whereas traditional dashboards were mostly relegated to employees’ individual screens, TV dashboards empower companies to visualize and display their most important real-time business metrics on screens throughout their offices – where everyone can see them, talk about them, and act on them.

While some companies display the same metrics on multiple screens in different locations to showcase their overall performance, others choose to create a separate TV dashboard for each department, displaying department-specific metrics – and some even combine these department-specific dashboards into slideshows that are shown on TV screens company-wide to keep everyone up to date on progress across all departments.

Video: Why Real-Time Dashboards

6 Benefits of Using TV Dashboards

The improved data visibility provided by these dashboards gives employees immediate access to the information they need to make the best decisions in their daily work. With TV dashboards, there are more eyes on the data more often, increasing the chances of identifying issues as they happen and making it possible to react immediately and quickly assess the results.

So, while the most obvious benefit of these dashboards is that they give employees immediate access to information that can help them make better decisions in their day-to-day work – that’s just the tip of the iceberg. Here are six major benefits of implementing this cutting-edge tool.

1. Improved Transparency

TV dashboards improve transparency, and a transparent work culture in which management freely shares information with employees has been shown to improve employee commitment, engagement, and performance.

Visualizing real-time performance data where everyone can see it sends a clear message that management has nothing to hide, fostering feelings of inclusion and trust – and a collaborative environment where employees feel accountable, empowered to find solutions, and motivated to deliver their best work.

Blog - 3 Steps to Boost Your Team's Sales Performance & How to Implement Them - Sales Dashboard

2. Visualized, Real-Time Performance Insights

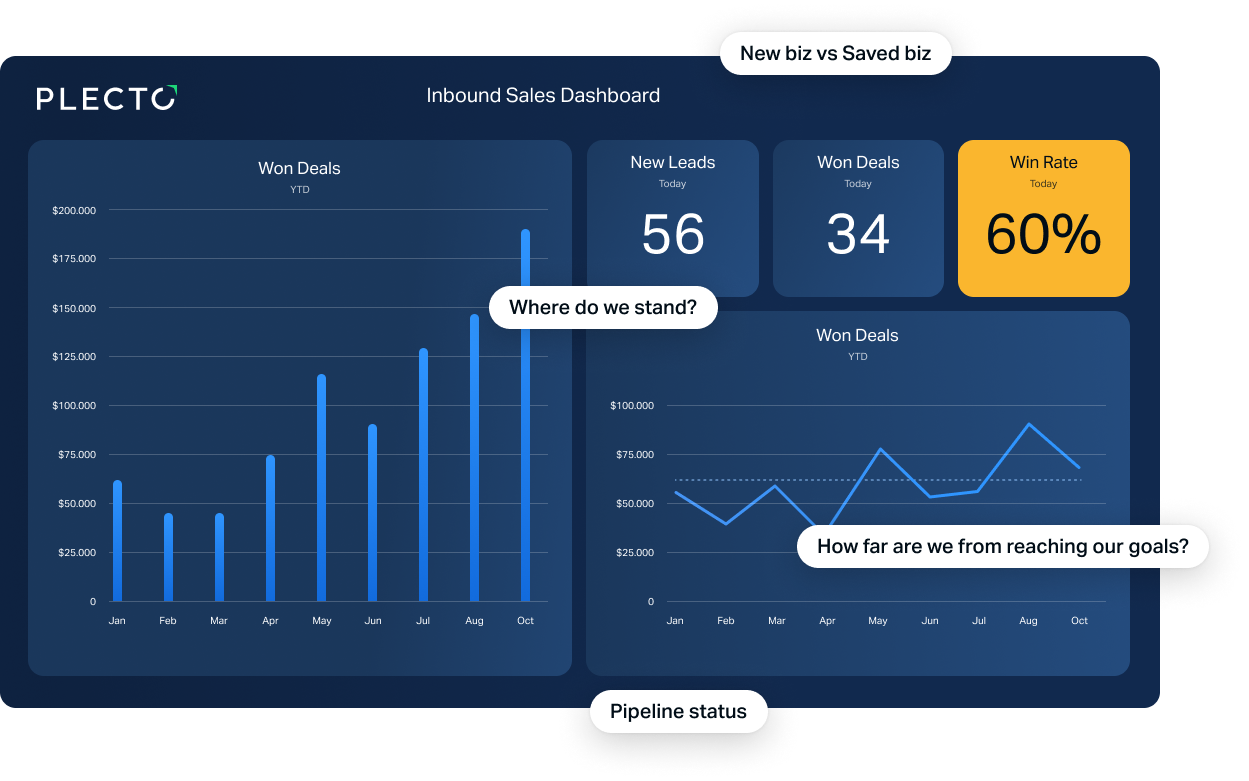
A TV dashboard gives employees and their managers real-time visibility into their most important KPIs in a conspicuous format that’s easily understood – and difficult to ignore. Real-time performance dashboards eliminate the need for manual reporting while providing up-to-the-minute data in visual formats that distill complex information into more accessible and easy-to-understand formats. This clear, instant, and actionable performance data helps keep employees focused on the right metrics, so they’re more likely to identify issues early on and make quick, agile decisions when they’re needed.

3. Better Collaboration

Putting important data where everyone can see it promotes open communication, alignment toward goals, a chance to discuss challenges, and the opportunity to share in one another’s successes. Well-placed TV dashboards, particularly in common areas, can be an effective cross-departmental conversation starter. Placed within individual departments, they can be an effective catalyst for strategic collaboration around goals and new initiatives.

TV dashboards mock office

4. Improved Motivation

Displaying key metrics out in the open where everyone can see them sends a clear message about which goals are the most important. Showing employees how they’re contributing to the company’s real-time success helps to build camaraderie as everyone works together to inch toward those important targets while watching their progress.

This also creates accountability because nobody wants to be on a team that didn’t hit its goals – in fact, people are more likely to try and outperform their targets when they know their peers are watching.

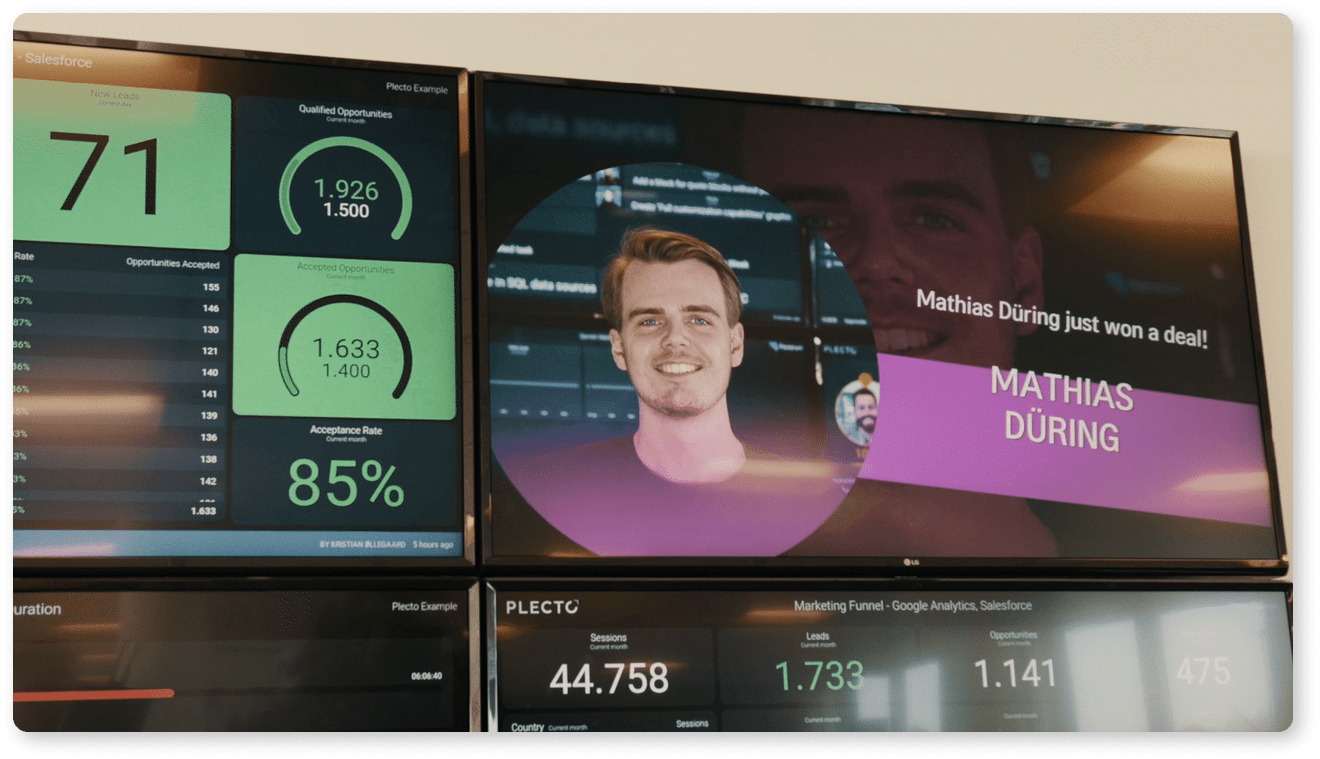
A TV dashboard can also provide the perfect platform for introducing gamification features, like leaderboards and instant notifications. People love recognition, and these tools are scientifically proven to improve engagement and boost individual as well as team motivation

Won a deal

5. Better Focus and Alignment on KPIs

With a TV dashboard, there’s no gray area around the most important KPIs because everyone is looking at them all day, every day – and they know exactly how they’re performing. With this information front and center, KPIs become a central part of the workplace culture – and working toward them becomes second nature.

6. A Data-Driven Culture

With up-to-the-minute data, a TV dashboard empowers employees to make informed decisions quickly based on the current situation. Instead of waiting for month-end reports, employees can instantly see how today’s efforts are impacting progress toward goals. This creates a more dynamic workplace by empowering people to take action now and get instant feedback on its impact.

TV dashboards meeting

What should a TV dashboard include?

Keeping in mind that a TV dashboard’s main purpose is to provide a visual overview of important data, its content should be tailored based on its audience and what the company is hoping to achieve with the dashboard. To get the most out of their dashboards, most companies include real-time KPI data for the whole company, a department, or as a slideshow of multiple departments’ KPIs.

When deciding what to include on a TV dashboard, start by defining its business objective and audience. What data does the audience need in order to meet the stated objective? What don’t they need? Designing an effective dashboard means limiting the amount of data presented – it should never be confusing or feel overwhelming. Think of logical ways to group or categorize the dashboard data – and make sure to choose clean, data-appropriate visuals (e.g., bar charts, pie charts, line graphs).

These 15 golden rules of dashboard design are chock-full of tips to help you build an effective dashboard on your first try! Strategic, operational, or analytical? Learn the ins and outs of these three mission-critical dashboard types, their business functions, and how and when to use them to reap their full potential. If you’re still feeling a bit unsure, check out these dashboard examples for some concrete inspiration.

Video: How to Build a Dashboard in Plecto

Why Plecto is the perfect visualization tool

Easily connect to 120+ systems 🔌

Plecto offers native integrations to over 120 of the world's most popular systems. Cross-combine your CRM, support and telephony tools all together into one single source of truth.

Fastest refresh speed in the business⚡️

Say goodbye to waiting for hours for your data to refresh! Plecto's integrations typically refresh every two minutes, and often even faster - perfect for high-activity teams!

Visualization that engages & motivates 💪

By putting your KPIs up on TVs for all the team to see, your employees will be more motivated than ever to hit their targets and achieve record results.

Display your dashboards on slideshows

Although Plecto looks great on a computer as well as our best-in-class apps for mobile and Apple Watch, Plecto works best on large TV displays. To display your dashboards on TVs, Plecto uses slideshows.

It only takes a few simple steps to get your Plecto dashboards on your TV. Here are the steps you need to take:

  1. Create your slideshow on your computer.
  2. Open https://tv.plecto.com on your TV's browser or the Plecto app if you have a LG or Samsung TV.
  3. Log in to the Plecto app on your phone and scan the QR code with your phone's camera.
  4. Choose a slideshow and click Activate!

And that's it! If you want to learn more about the ins and outs of installing then you can read the full guide to setting up your TV.

Video: How to Connect Plecto to your TV

But wait... what TVs do I need?

Plecto has dedicated apps for both Samsung and LG TVs and other smart TVs that run on Android. If our app isn't available on your device, don't worry! You can still get Plecto on your TV - you'll just need to access Plecto via your TV browser. For the best performance, we recommend an LG TV.

Frequently Asked Questions

No. Plecto's dashboards can be visualized on an unlimited number of TVs at no extra cost.

Yes! By creating a slideshow, you simply select the dashboards that you want to display on your TV. These will automatically rotate throughout the day.

Data on slideshows refreshes as fast as it does on a desktop - typically every two minutes!

Yes! It's not just dashboards that you can visualize on a TV. Easily visualize your contests on TVs around the office for a motivated team.

Explore more features

Real-time Dashboards

Visualize KPIs on TVs around the office.

Real-time Reports

Save time with live, automated reports.

Performance Agreements

Set targets for each employee and follow progress in real-time.

Build Custom KPI's

Choose the KPIs that suit your custom needs.

Gamification

Spark motivation and a healthy culture of competition.

Instant Notifications

Recognize and celebrate success as it happens.

Dynamic Dashboards

Personalize performance with Dynamic Dashboards

Gamification+

Get access to both the Reward Store and Contests with Gamification+

Coaching and Training

Elevate employee development with One-on-ones and Quizzes