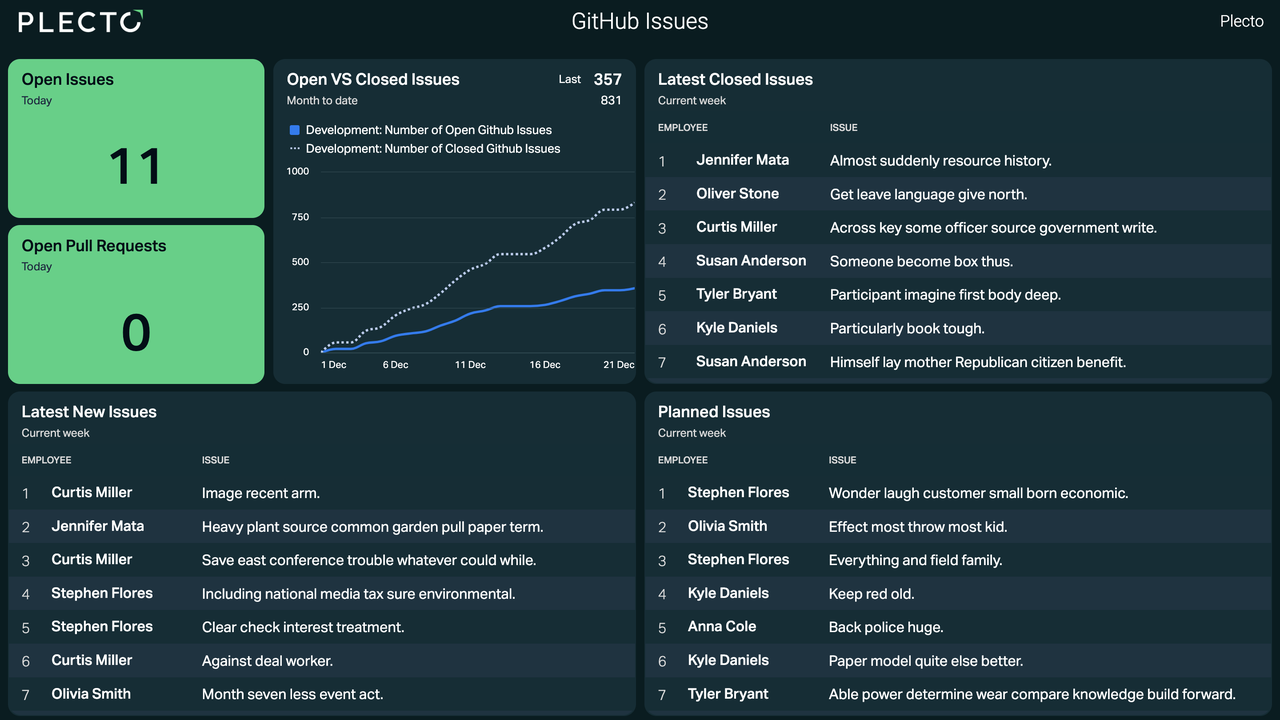
Custom GitHub dashboards
Build customized GitHub dashboards that visualize your business metrics and KPIs in real-time. Import your data directly from GitHub and create your own dashboards.


Development
Partner website
About GitHub
GitHub is a global company that provides hosting for software development version control using Git.
Additional help
Create real-time GitHub dashboard with Plecto
Build a custom GitHub dashboard with Plecto to track and show your latest releases, stats, commits, and repository status on TV monitors.
Create an easy and simple GitHub dashboard that can help you manage and measure the efficiency of your DevOps team in real-time. With Plecto, you no longer need to log into your GitHub account repeatedly to see your team's performance, generate individual reports, or check up on goals. You can do this and much more with Plecto.
With Plecto's integration to GitHub, you are able to create, edit, iterate, and display focused GitHub dashboards. Get full visibility on crucial processes like open pull requests, activities, number of forks, watchers, issues, and a list of recent actions.
What types of data can you import from GitHub?
Milestones
Update frequency
Every 5m
Default member field
creator
Default date field
created_at
Supports custom fields?
No
Supports automatic registration deletion?
No
Pull Requests
Update frequency
Every 5m
Default member field
user
Default date field
created_at
Supports custom fields?
No
Supports automatic registration deletion?
No
Commits
Update frequency
Every 5m
Default member field
author
Default date field
commit.author.date
Supports custom fields?
No
Supports automatic registration deletion?
No
Issues
Update frequency
Every 5m
Default member field
assignee
Default date field
created_at
Supports custom fields?
No
Supports automatic registration deletion?
No
Pre-built GitHub KPIs
Browse our extensive library of pre-built GitHub KPIs or customize and create your own.
Changes proposed by the developer that have been seen by the project manager.
The last development’s request that has been approved to be done.
Amount of new tickets aimed for the development team over the last period.
Amount of times your company has reached a planned stage in its progress.
Last new tickets created during the last period.
The latest requests made during the last period.
Changes in a code that have been captured over the last period.
Amount of new changes in the code captured over the last period.
Amount of tickets that have been solved by the development team over the last period.
Name of the last issue that was solved by the development team over the last period.
Name of the latest goal reached by an employee or team in the office.
Number of Merged Pull Requests
Total amount of developers’ requests that have been approved to be carried out.
Total amount of issues aimed for the development team that has been opened but not completed yet.
Last change proposed by a developer that hasn’t been checked yet.

Don't see the KPI you are looking for?
Build your own KPIs to use for custom widgets with our easy-to-use formula editor.
How it works
1. Connect your data sources
One-click real-time integration with our dashboards to the most popular CRM, support and other business systems.
2. Build dashboards
Use our prebuilt KPI dashboards or customize your own by using formulas to calculate more advanced metrics.
3. Boost team performance
Share real-time insights with your team and boost performance by 20% with visualizing data on dashboards.
Boost performance with real-time insights
Plecto is a data visualization software that helps you motivate your employees to reach new limits and stay on top of your business.