Table of contents:
10 Important Retail KPIs to Track
Today’s retailers have more access to data than ever before. Tracking the right retail key performance indicators (i.e., retail KPIs) is an excellent starting point for becoming more data-driven in your retail business.
But how do you know that you’re tracking the right KPIs in retail? This guide will give you ten retail KPI examples that you can track to glean actionable insights into your store’s growth and performance.
What Are KPIs in Retail?
Before we dive into the examples, let’s first answer the most important question: What are KPIs in retail?
Retail KPIs are carefully selected metrics that retailers regularly monitor to help drive business decisions that can increase profits. Tracking these KPIs can give retailers insights that can help them influence the cost of doing business, inventory management, customers’ buying habits—and more!
While retailers track dozens of retail sales performance indicators industry-wide, we’ve chosen these ten as an excellent starting point to get a handle on where your business excels, where it’s falling short, and what changes you could make to help ensure that your business survives and thrives for years to come.
1. Monthly Sales Target
We’re leading with this one because if a retailer isn’t hitting this number, the rest of the retail KPI examples on this list won’t matter very much. The monthly sales target KPI is a quick “pulse check” that will tell you whether your business is surviving, thriving, or headed for trouble.
Sales targets can also be measured weekly, monthly, or quarterly–but monthly tracking is the most effective for understanding overall sales and marketing performance. Shorter intervals tend to be anecdotal while quarterly measurement gives a nice overview but could lead to too little too late.
2. Return Rate
Return rate is an excellent barometer of customer satisfaction and it’s an important KPI in retail because satisfied customers are often repeat customers. A return rate of over 10% could be a clue that your product quality isn’t up to scratch or that it lacks value for money—it could also indicate issues in your sales process or marketing and advertising.
3. Sales Per Square Foot/Meter
One of the most important retail KPIs for brick-and-mortar retailers, this one measures the store’s productivity by comparing its revenue to its floorspace. Retail space is expensive, so a strong bottom line hinges on the retailer’s ability to make the most of it.
Use this formula to calculate how much your store is selling per square foot:
Net sales ÷ Space = Sales per Square Foot
For added insight, some retailers compare this metric to online sales and discover that downsizing their physical location(s) or shifting focus to online sales makes good business sense.
4. Foot Traffic
Foot traffic is an excellent complement to the sales per square foot KPI. This one tracks how many people walk into your store.
Comparing it to sales-related figures can help you gauge whether you have the right location for your business—and even provide insights into the effectiveness of certain window displays or marketing campaigns.
Analyzing foot traffic trends over time can also help with staffing decisions by identifying hours and seasons where foot traffic is heavier or lighter than average.
5. Sales by Department
Sales by department measures comparative sales volume. Small retailers that don’t have multiple departments can instead measure sales by category, which will give similar insights. This is an important KPI because it can help inform product strategy, placement, and promotion. It can also help you weed out products that aren’t resonating with your customers, so you can focus on ones that do.
6. Average Purchase Value
How much your customers are buying is as important as what they’re buying. Average purchase value tells you how much your customers spend on average per visit. Drilling down into the nitty-gritty of this metric can help you identify merchandising opportunities by showing you popular cross-sales and which promotions were the most effective.
Use this formula to calculate your store’s average purchase value:
Total sales revenue ÷ Number of transactions = Average Purchase Value

7. Inventory Turnover
Retailers are in business to sell inventory and it’s often a delicate balance between overstocking and understocking. The inventory turnover KPI can help you understand how much stock you go through in a given period (e.g., weekly, monthly, quarterly).
If the number is too low, you might be stocking too much or stocking the wrong products. If it’s too high, chronically out-of-stock items might be frustrating potential customers—or even driving them to your competitors. Either way, it’s lost revenue.
Use this formula to calculate your store’s turnover:
Cost of products sold ÷ Average amount of inventory on hand = Inventory Turnover Rate
Watching this metric over time can also help you identify seasonal trends as well as what sells and what doesn’t.
8. Gross Margin Return on Investment (GMROI)
A small counterpart to the inventory turnover KPI, GMROI is an important retail KPI that tells you how much money you’ve made off what you’ve invested in inventory. In other words, it evaluates your inventory’s profitability—and it can help you identify the most (and least) profitable products and types of products for your business.
Use this formula to calculate GMROI overall or per product:
Total gross profit ÷ Average inventory cost = GMROI
The higher the ratio, the higher your profit margin. However, a high GMROI product doesn’t always translate into high revenue. If you’re only selling a few units of your highest-GMROI products, it might make better business sense to focus on selling lower-GMROI products in greater volumes. Getting this metric right is one of the keys to growing your profitability.
9. Gross and Net Profits
This one might seem like a no-brainer, but what you do with this information can make all the difference between an OK revenue year and a fantastic one. Chances are you already know whether you’re in the black or in the red, but have you looked into where you can tighten your margins?
A low gross profit might be your cue to start looking into other suppliers, while a low net profit might indicate that it’s time to look into cutting operational costs like staffing and overhead.
Use these formulas to calculate your store’s gross and net profits:
Retail cost of products sold – Wholesale cost of products sold = Gross Profit
Total revenue – All business-related expenses = Net Profit
10. Shrinkage
Shrinkage is an unfortunate reality in retail. Whether it’s caused by shoplifting, employee theft, supplier fraud, or something else, every business loses inventory and can’t account for how it went missing. Missing inventory can add up to big losses, so it’s important to keep an eye on shrinkage to identify trends and procedural opportunities for reducing it.
Use this formula to calculate your store’s shrinkage:
Ending inventory value – Actual inventory value = Shrinkage
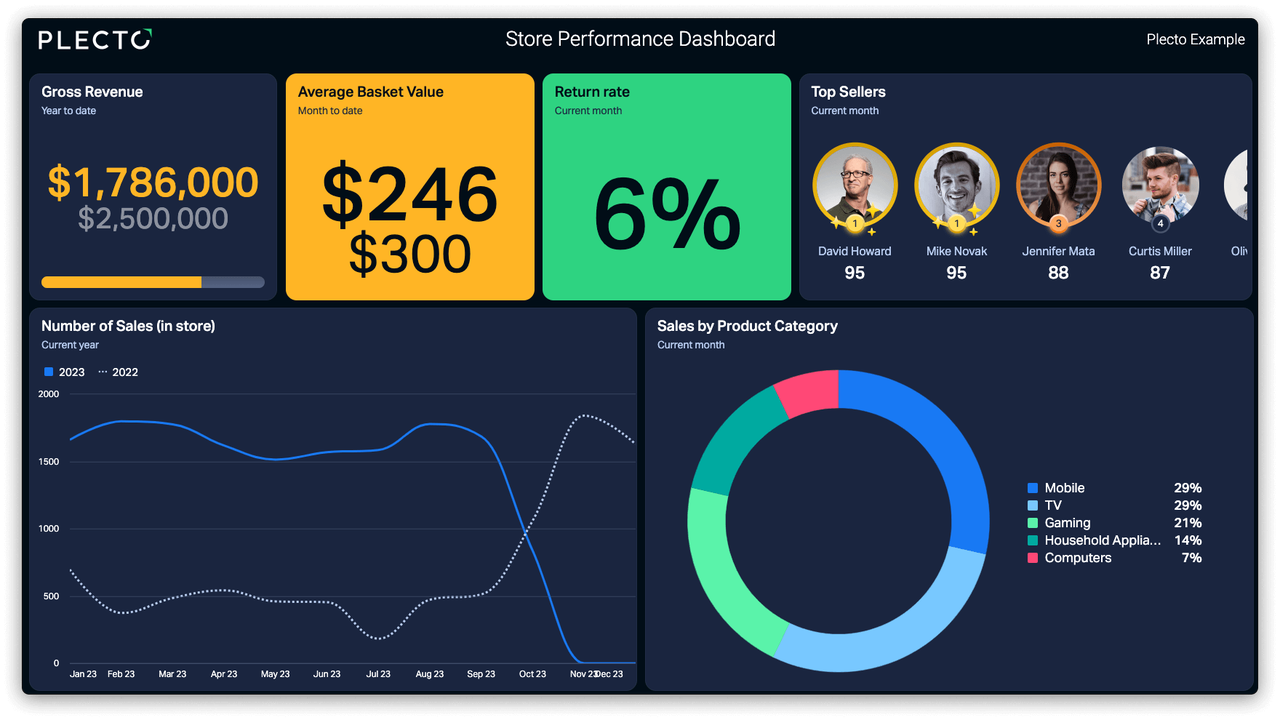
Track Retail KPIs with Automated Reporting
Monitoring and acting on these ten retail KPI examples will set you on the path to a more data-informed approach to business. With Plecto, you can schedule and generate automatic reports with custom KPIs and real-time data to help you stay on top of what’s happening in your store.
Take your retail business to the next level. Sign up below for a free Plecto demo!
Start your 14-day
free Plecto trial today.
SAGE CRAWFORD
Content Manager