 Sign in

CRM dashboard examples: sales, leads and renewals in real time
Plecto turns data from your CRM into live dashboards, leaderboards and contests that your sales team sees on TVs and phones.
What is a CRM dashboard?
A CRM dashboard is a live visual summary of the numbers your team is measured on, built from the records in your customer relationship management system, such as leads, deals, activities and accounts. Plecto is a performance management platform that turns CRM data into real-time dashboards with targets, leaderboards and contests for TVs and phones.
Most CRMs include their own reports and dashboards. A dedicated CRM dashboard goes one step further: it shows the numbers where the team can see them and ties each one to a person and a target. The three examples below are demo dashboards built with Plecto's dashboard widgets and example data, with fictional reps. The rest of the page covers which KPIs to use, how built-in CRM reports compare, and how to set one up.
Sales CRM dashboard example: leads, won deals and pipeline
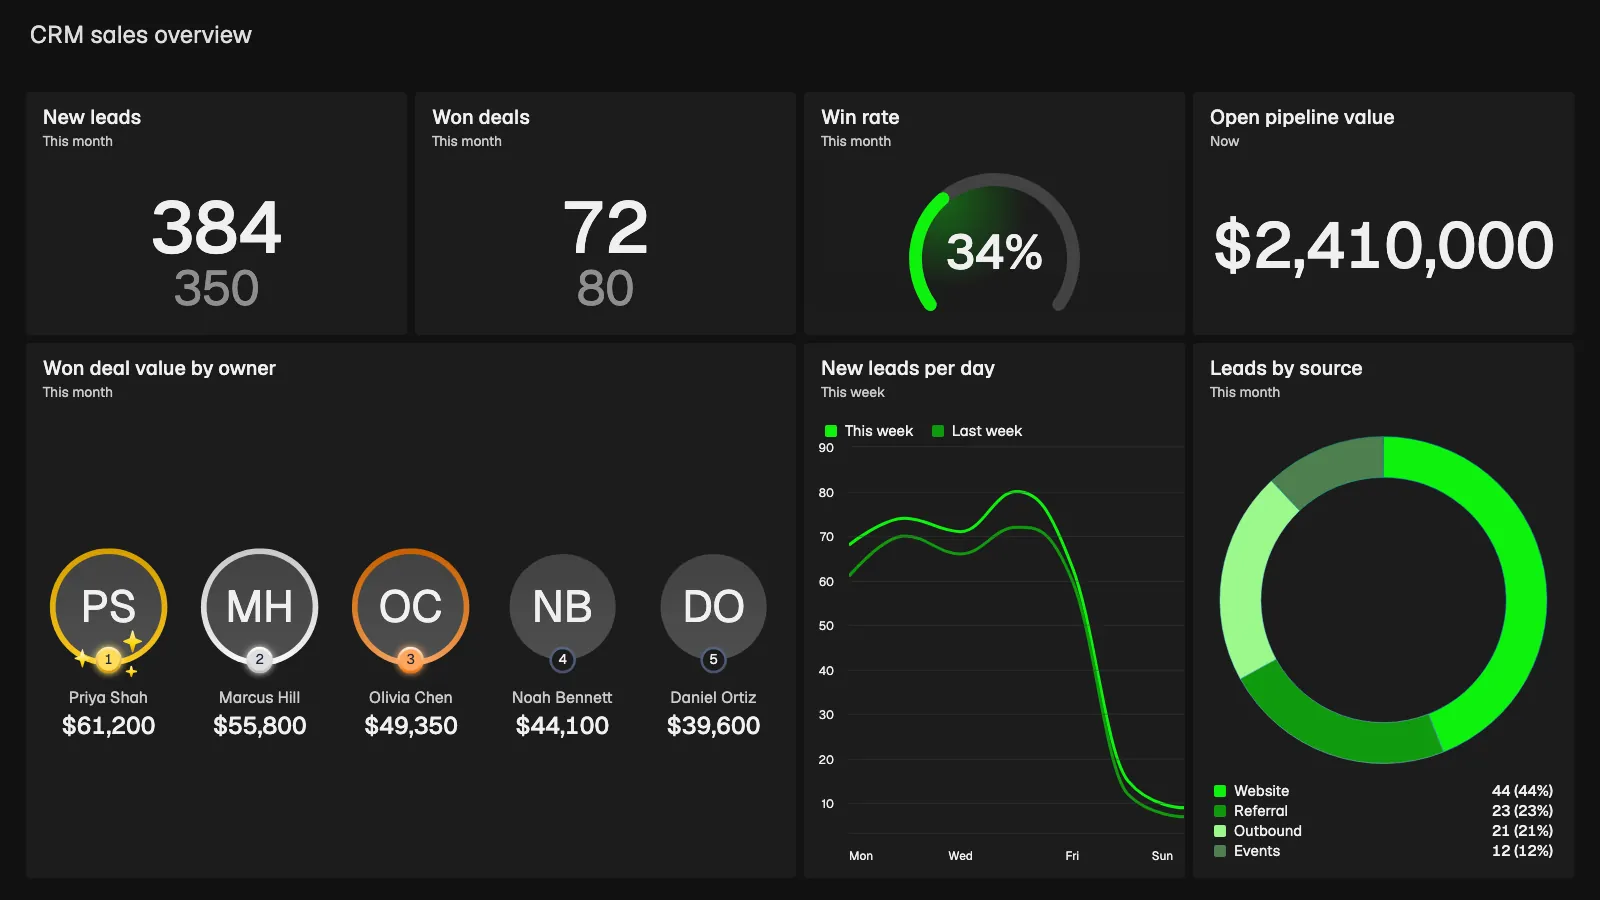
The sales CRM dashboard at the top of this page gives a manager the month on one screen. It shows 384 new leads against a target of 350, 72 won deals against 80, a win rate of 34% on a gauge and an open pipeline value of $2,410,000. Below, a leaderboard ranks the top five reps by won deal value, from Priya Shah at $61,200 to Daniel Ortiz at $39,600, each with a photo and a medal.
A line chart compares new leads per day this week with last week, and a donut splits leads by source: Website 44%, Referral 23%, Outbound 21% and Events 12%. The result KPIs sit next to the lead numbers that feed them, so a dip in leads is visible before it becomes a dip in revenue. See the KPIs in number of new leads, number of won deals, win rate of deals and weighted pipeline value.
Explore Plecto sales dashboardsCRM dashboard example: lead management and follow-up
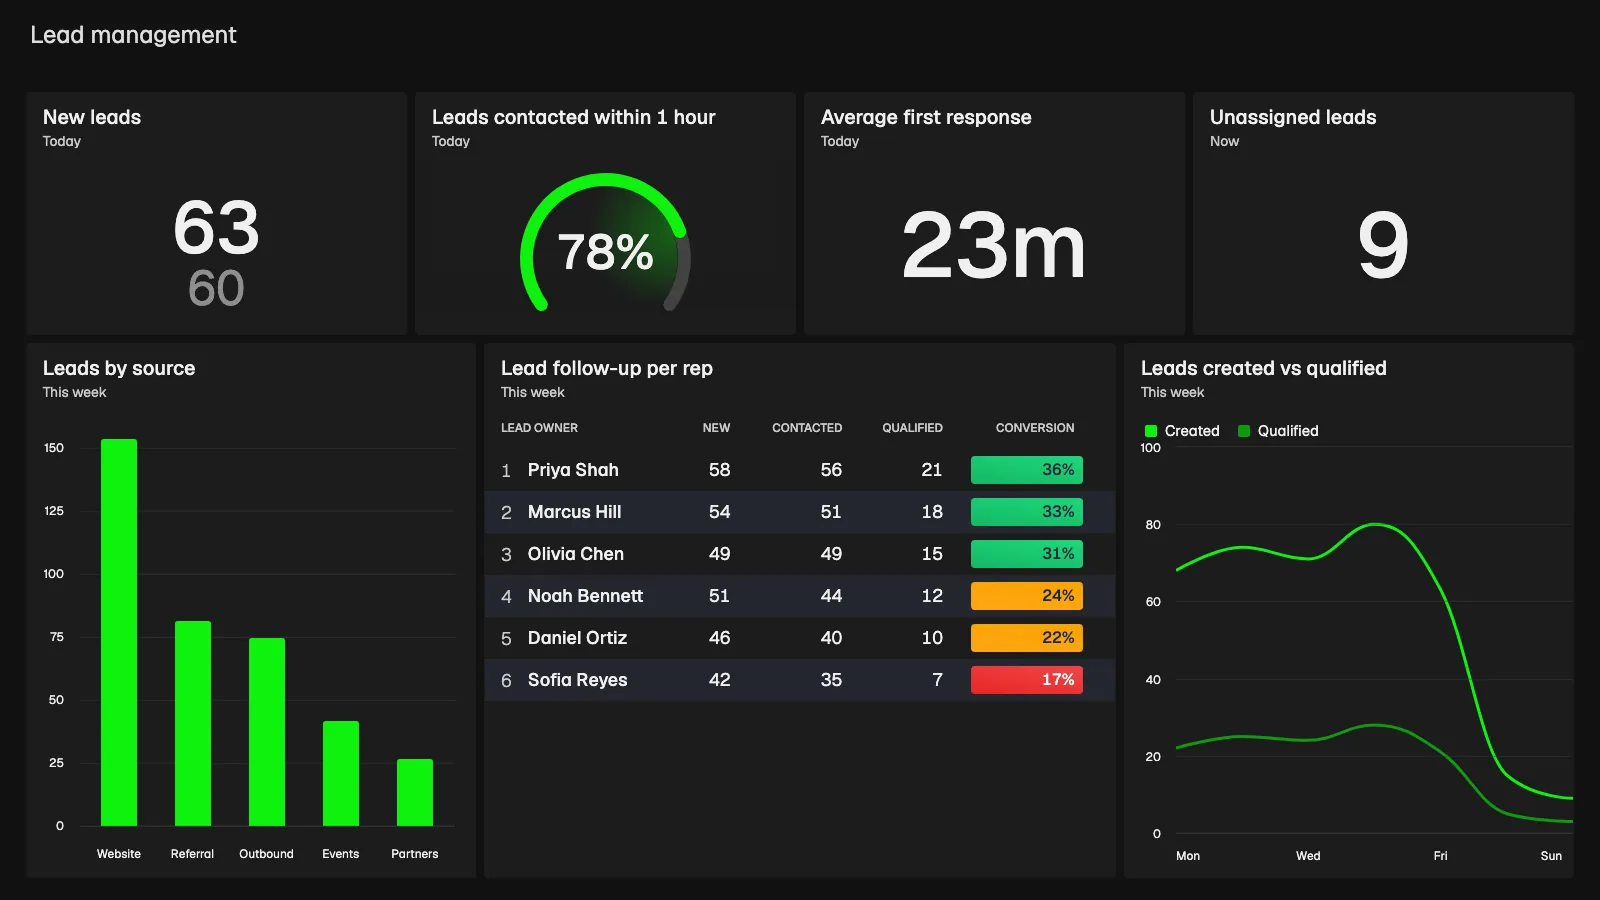
Lead management is where speed matters. This example shows 63 new leads today against a target of 60, 78% of leads contacted within one hour on a gauge, an average first response of 23 minutes and 9 unassigned leads waiting for an owner.
A column chart breaks the week's leads down by source: Website 154, Referral 82, Outbound 75, Events 42 and Partners 27. A table shows new, contacted and qualified leads per lead owner with a conversion rate colored green at 30% or more, yellow from 20 to 29% and red below 20%. A line chart compares leads created with leads qualified this week. Related KPIs are lead response time and cost per lead.
To compare reps on calls, meetings, won deals and win rate, see the sales performance dashboard.
CRM dashboard example: customer accounts and renewals
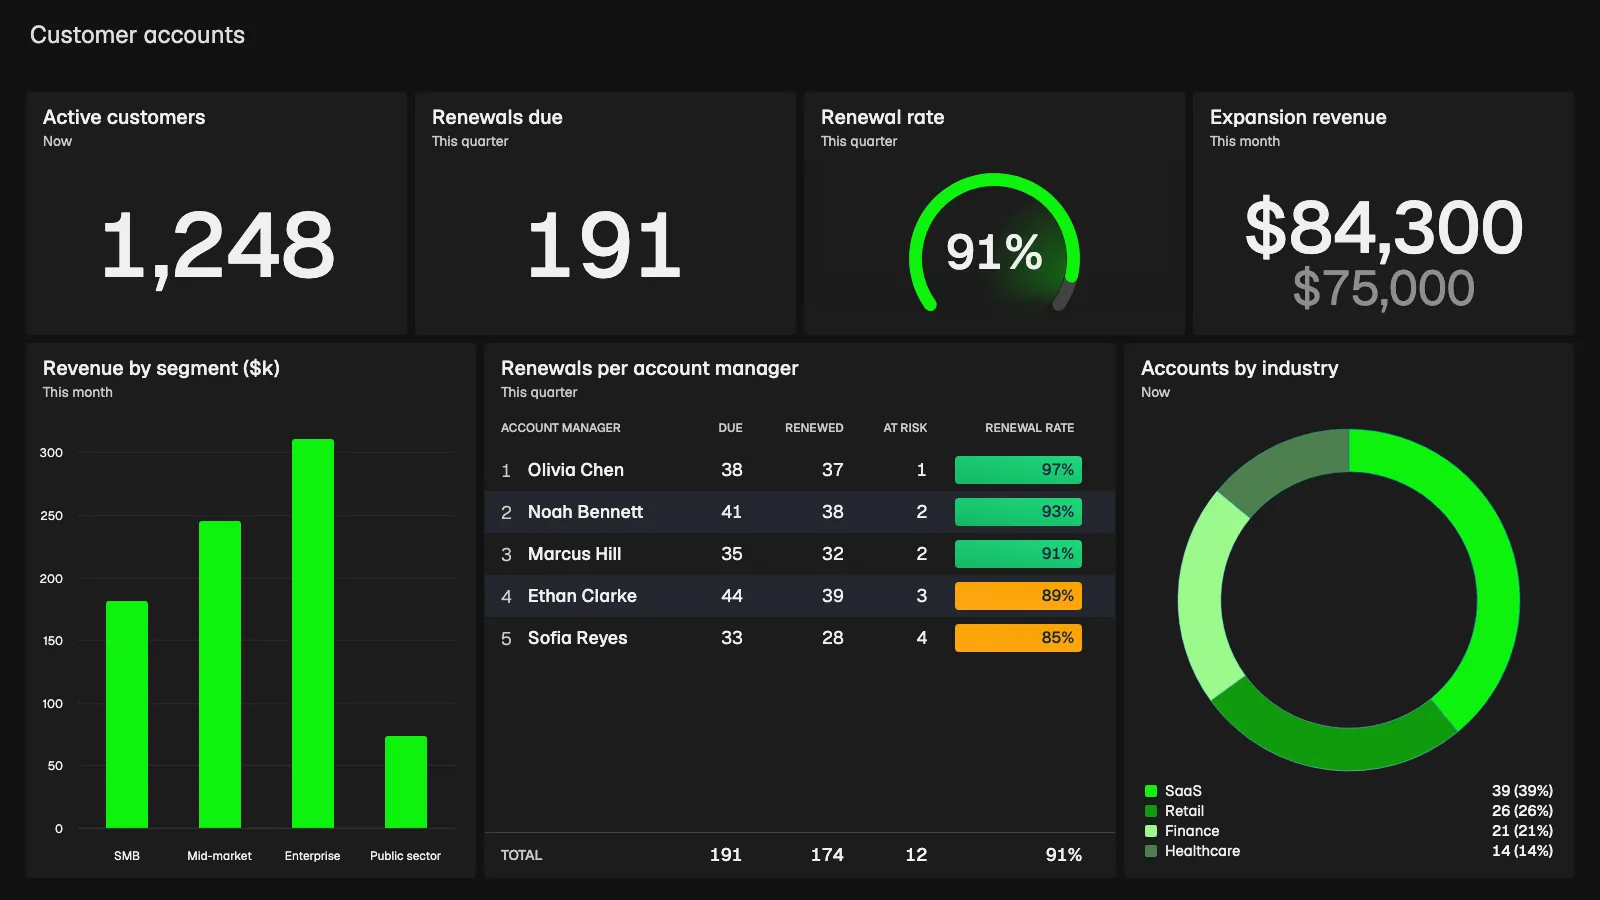
A CRM dashboard is not only for new business. This account example shows 1,248 active customers, 191 renewals due this quarter, a renewal rate of 91% on a gauge and expansion revenue of $84,300 this month against a $75,000 target.
A column chart shows revenue by segment in $k: SMB 182, Mid-market 246, Enterprise 311 and Public sector 74. A table lists renewals per account manager with due, renewed and at-risk counts and a renewal rate, totaling 191 due, 174 renewed, 12 at risk and 91%. A donut splits accounts by industry. Account managers can see at a glance which renewals still need a call. Related KPIs include churn MRR, new MRR and average revenue per account. See the account manager dashboard for another layout.
Which KPIs belong on a CRM dashboard?
Start with five to eight numbers per team, results next to their drivers.
Lead KPIs
Follow number of new leads, lead response time and cost per lead. Add leads by source so you know which channel is worth the effort.
Pipeline and sales KPIs
Track win rate of deals, average deal size, weighted pipeline value and average sales cycle length. Show each rep against a target.
Customer and account KPIs
Use number of new customers, churn MRR and average revenue per account, plus renewals due and at-risk accounts from your CRM.
Plecto has formula and widget templates you can start from, and you can write your own formulas when your sales process is different.
Built-in CRM reports vs a dedicated CRM dashboard
CRM reports are the right tool when the people who need the numbers already work inside the CRM and want to analyze records. A dedicated CRM dashboard fits when the numbers should be on the wall, updated live and linked to individual reps. The comparison below is general, because features and plan limits differ by CRM. Check your vendor's help pages for the details.
| Built-in CRM reports | Plecto CRM dashboard | |
|---|---|---|
| Best for | Analysis and reporting inside the CRM | Live team performance on TVs and phones |
| Display | Opened by a logged-in user, depending on the CRM | Slideshows on any TV, desktop and the mobile app |
| Refresh | Varies by CRM and plan | Each integration has its own refresh rate, many within 2 minutes |
| Targets | Depends on the CRM | Targets and conditional colors on every KPI |
| Other systems | Mostly CRM data | CRM plus phone, helpdesk and marketing data on one dashboard |
| Gamification | Rarely included | Leaderboards, notifications, and contests and the Reward Store on Large and Enterprise |
Plecto is not a BI warehouse and does not replace your CRM or its reporting for ad hoc analysis. Many teams keep the CRM as the system of record and use Plecto as the live layer on top. Our article on CRM dashboards as a single source of truth explains why one definition of each number matters, and the business dashboard guide shows how CRM data fits next to finance and support.
CRM dashboard design tips: build one your team will read
A CRM dashboard only changes behavior if people look at it. These habits help, whichever tool you use:
- One audience per dashboard. A rep, a sales manager and an account manager need different screens. Build one CRM dashboard for each rather than one for everybody.
- Five to eight KPIs. Put the result, such as won deal value, next to the activity or lead numbers that drive it.
- Targets and color. A number next to a target, with conditional colors for on track, close and behind, tells a rep what to do next.
- Fix the data first. Check that deals, leads and activities have an owner in the CRM before you rank anyone, and use one definition per KPI.
- Pick the screen. A TV needs large numbers and few widgets. A desktop or phone view can carry more detail.
For more depth, read our guide to KPI dashboard design.
CRM dashboards by CRM: Plecto integrations
Plecto has 150+ integrations, including the CRMs below. Each card links to a CRM-specific dashboard example where one exists, and to the integration page otherwise.
HubSpot dashboard
Deals, calls, meetings, emails and tickets as live dashboards for sales and marketing teams.
Salesforce dashboard
Opportunities, leads and rep performance from Salesforce on TVs and phones.
Pipedrive dashboard
Won deals, pipeline stages and activities per rep from Pipedrive.
Close dashboard
Calls, leads, opportunities and activities from Close. Read the 8 best KPIs for Close CRM and the best gamification practices for Close CRM.
Zoho CRM dashboard
Build customized Zoho CRM dashboards that visualize your sales KPIs in real time.
Dynamics 365 Sales dashboard
Import data from Microsoft Dynamics 365 Sales and build dashboards for your KPIs.
Freshsales dashboard
Show Freshsales metrics on real-time dashboards and reports.
Copper CRM dashboard
Create your own Copper CRM dashboards and display business metrics in real time.
How to build a CRM dashboard in Plecto
- Connect your CRM. Go to Data sources > New data source and choose your CRM, such as HubSpot, Salesforce, Pipedrive or Close. Follow the login or API key steps in the integration guide.
- Choose the data types. Pick what your team is measured on, such as leads, deals or opportunities, calls and meetings. Set the title, default date and fields, then click Import.
- Create the KPIs. Go to Formulas > New formula and write, for example, won deal value this month or leads contacted within one hour.
- Add widgets. In Dashboards, add KPIs, leaderboards and charts, and set targets and conditional colors.
- Show it on a TV. Add the dashboard to a slideshow under Slideshows and activate it on a TV. The TV dashboards guide covers TV apps and browsers.
Each CRM has its own guide in the data sources and integrations documentation, with the data types and refresh rate for each. Plecto offers a 14-day free trial with no credit card required.
CRM dashboard FAQ
A CRM dashboard is a live visual summary of the KPIs your team is measured on, built from CRM records such as leads, deals, activities and accounts. It can run inside the CRM or in a tool like Plecto, which adds TV and mobile dashboards, targets, leaderboards and contests. See the sales dashboards page for examples.
Five to eight KPIs for one audience. For sales, that usually means new leads, won deals, win rate, pipeline value and a rep leaderboard against targets. For account teams, add renewals due, renewal rate and churn. See the sales KPIs list for formulas and examples.
It depends on who needs the numbers. Your CRM's built-in reporting suits analysis inside the CRM, and BI tools suit company-wide modeling. Plecto suits live per-rep performance on TVs and phones, with targets, leaderboards and contests. Compare options in our HubSpot dashboard tools and Salesforce dashboard tools guides.
Yes. Plecto has unlimited data sources on every plan, so you can show data from a CRM next to calls from a phone system such as Aircall or tickets from Zendesk Support. Each source refreshes at its own rate, and you build KPIs from each source on the same dashboard.
Yes. The Plecto Store has free sales dashboard templates for deals, leads and activities that work with HubSpot, Salesforce or Pipedrive. You can browse them in the Plecto Store and adjust them to your own data and targets. The sales dashboard examples show more layouts.
In Plecto, add your CRM dashboard to a slideshow, open tv.plecto.com on any TV and enter the code it shows under Slideshows. TVs are free to add, and you can rotate the CRM dashboard with leaderboards and other dashboards. See how to activate slideshows on TVs.
Yes, on the Large and Enterprise plans. Turn won deals, deal value or booked meetings into an individual or team contest with a target and an end date, and show it on a TV. Read more about contests.