 Sign in

Sales performance dashboard: see how your team and every rep are doing
Track revenue against quota, won deals, activity and win rate for the whole team and for each salesperson, live on a TV or phone, and use the numbers in coaching.
What is a sales performance dashboard?
A sales performance dashboard is a live view of how a sales team and each salesperson are doing against their targets. It combines outcome numbers such as revenue, won deals and win rate with activity numbers such as calls and meetings, and it updates from your CRM and phone system as the work happens.
It answers three questions at once: are we on track, who is driving the result, and where is effort not turning into deals. That is what separates it from a general sales dashboard, which can also cover pipeline, forecasts or marketing leads.
Plecto is a performance management platform that builds these dashboards from your CRM, phone and spreadsheet data and shows them on TVs, desktops and mobile. The three examples below are demo dashboards built with Plecto's real widgets and example data, with fictional reps.
Team sales performance dashboard example: revenue against quota
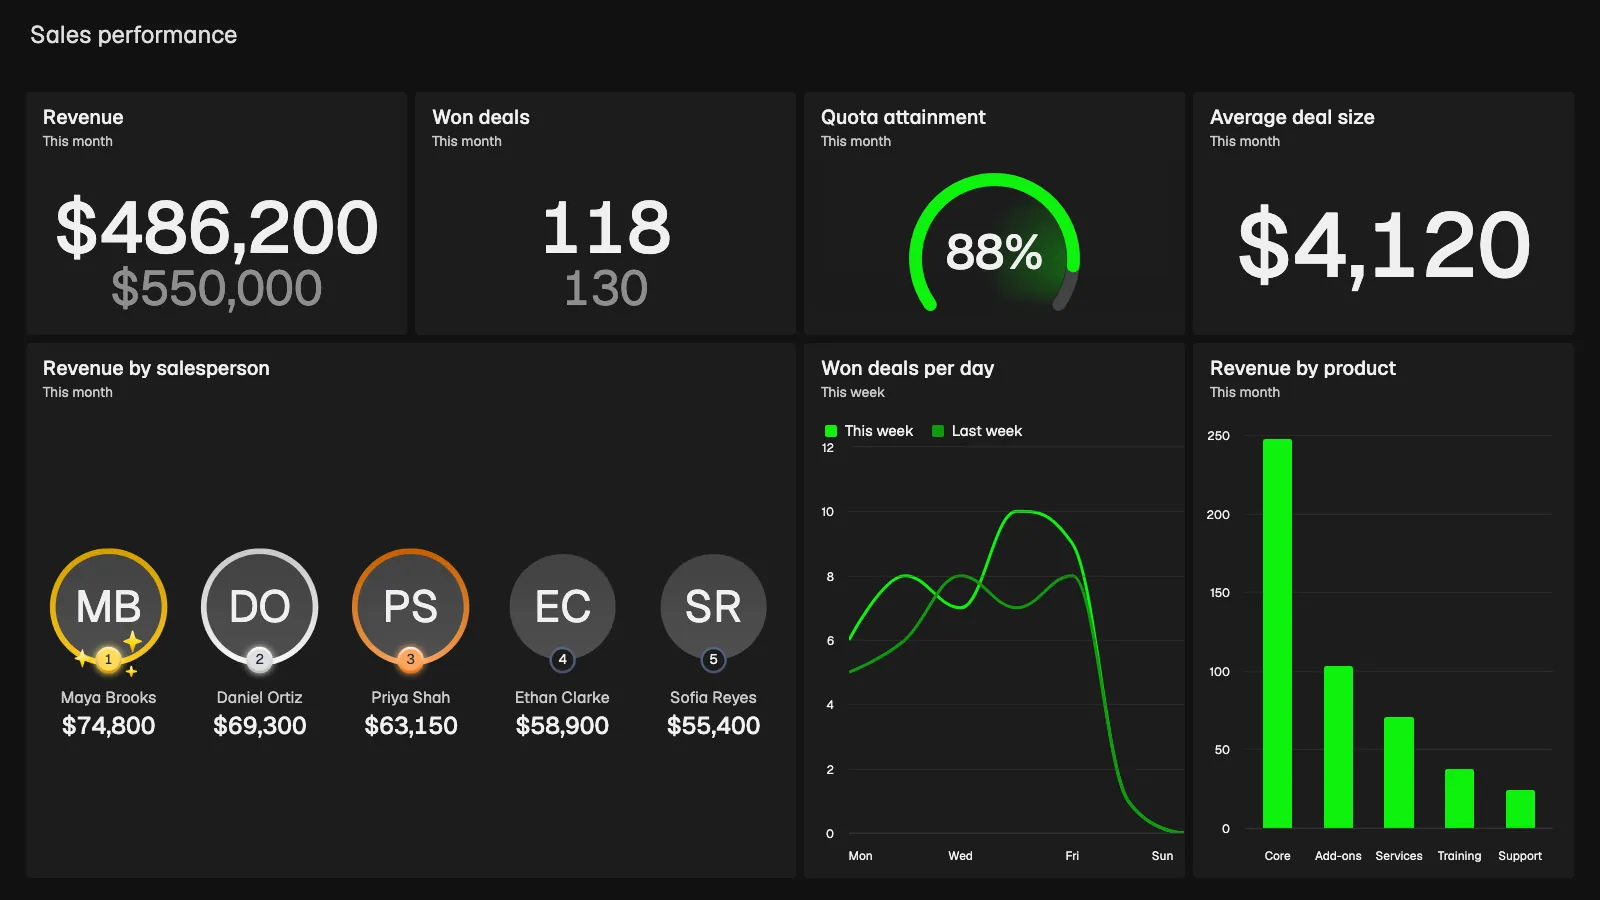
The sales performance dashboard at the top of this page is a team overview. It opens with the numbers a sales manager checks first: revenue this month of $486,200 against a $550,000 target, 118 won deals against a goal of 130, an average deal size of $4,120 and quota attainment of 88% on a gauge.
Below them, a leaderboard titled "Revenue by salesperson" ranks the top five reps with photos and medals, from Maya Brooks at $74,800 to Sofia Reyes at $55,400. A line chart shows won deals per day this week against last week, and a column chart splits revenue by product: Core, Add-ons, Services, Training and Support.
The mix is deliberate. The gauge and number boxes tell the manager whether the month is on track, while the leaderboard gives the team a reason to look at the screen. KPIs behind this view: number of won deals and average deal size.
Salesperson performance dashboard: activity and win rate per rep
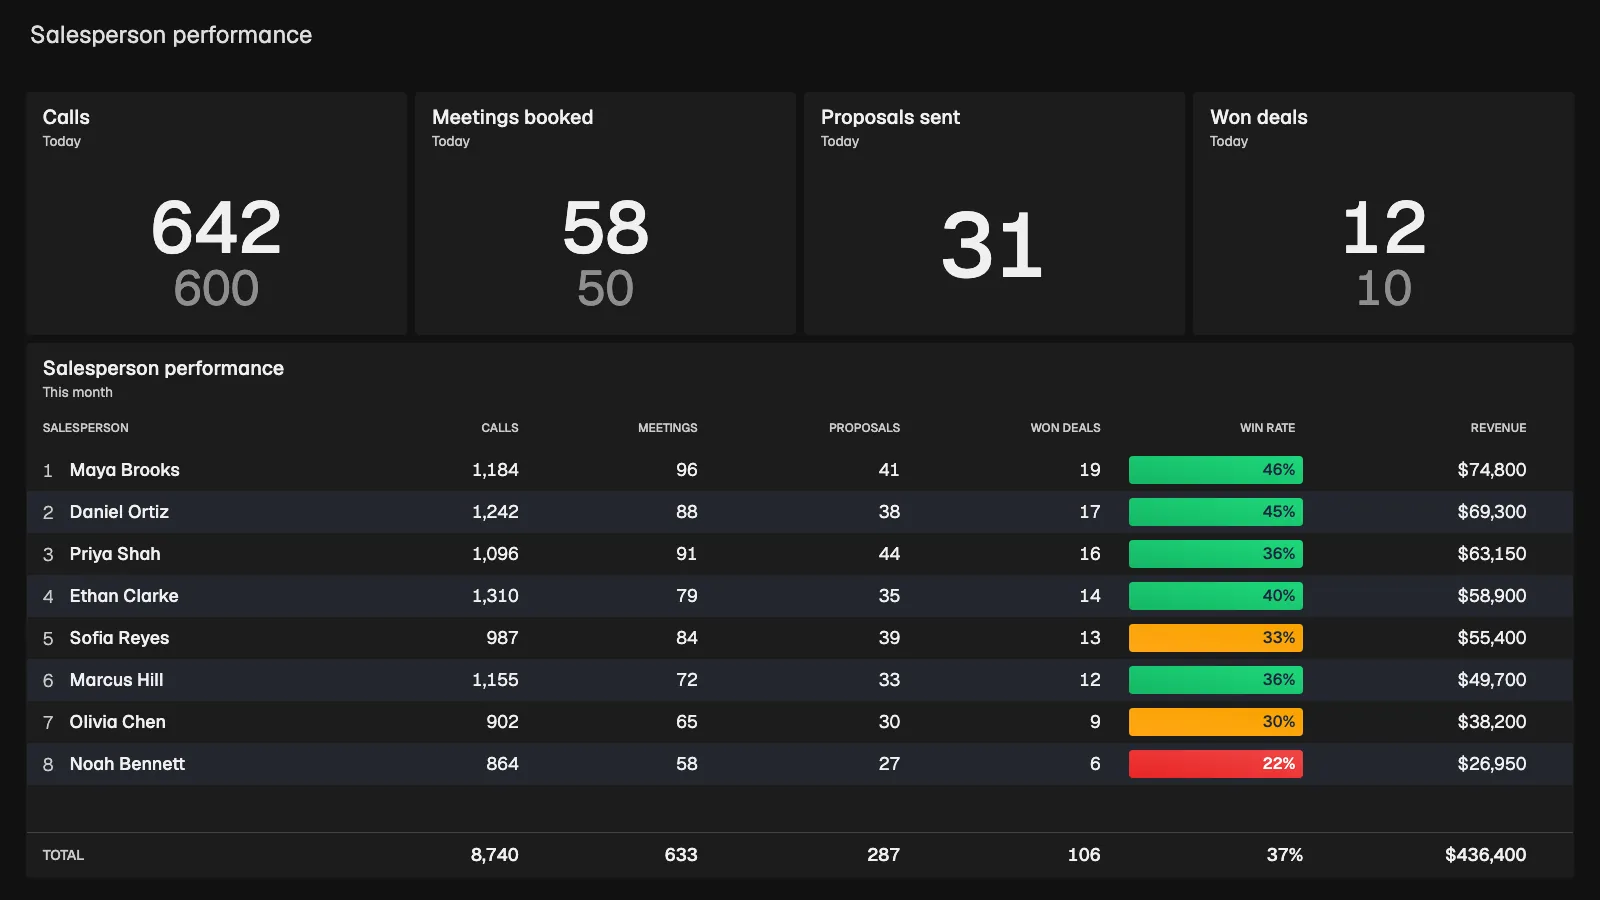
A salesperson performance dashboard puts every rep on one table so the manager can compare them without opening a report. This example starts with today's totals: 642 calls against a goal of 600, 58 meetings booked against 50, 31 proposals sent and 12 won deals against 10.
Underneath sits a full-width monthly table with one row for each of eight salespeople and columns for calls, meetings, proposals, won deals, win rate and revenue. Win rate cells are colored by conditional colors: green from 35%, yellow from 25% to 34% and red below 25%. A totals row sums up the team: 8,740 calls, 633 meetings, 287 proposals, 106 won deals, a 37% win rate and $436,400 in revenue.
The colors are the point. A manager sees at a glance that a rep with many calls and a red win rate needs help with conversations, while a rep with few calls and a green win rate may need more volume. See win rate of deals, number of calls and number of booked meetings.
Employee performance dashboard: one rep's personal scorecard
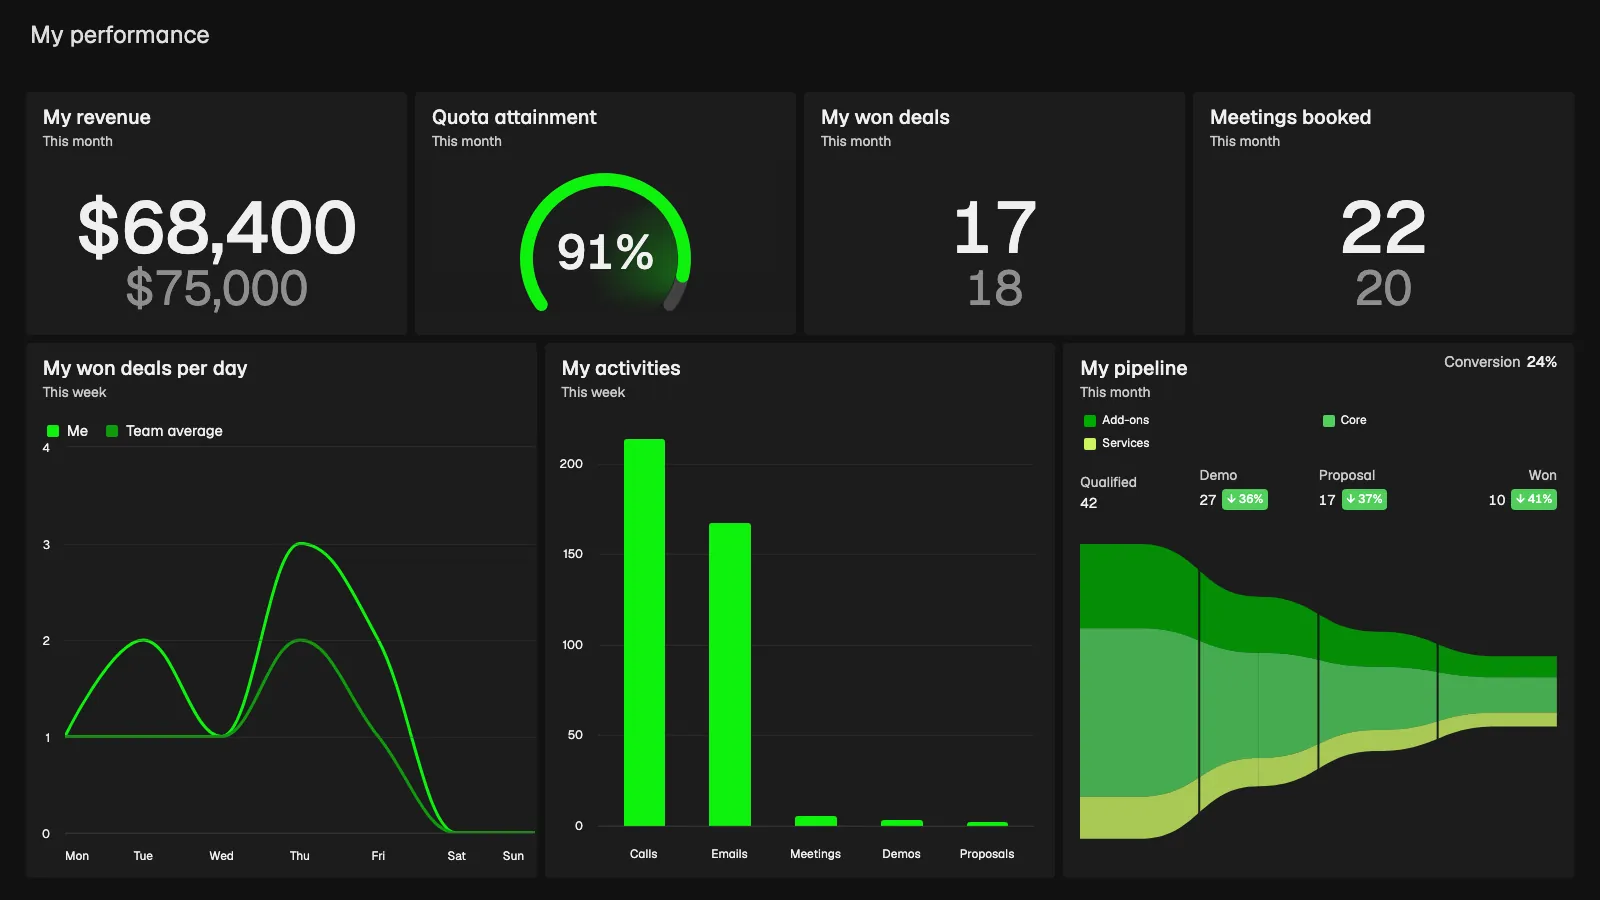
An employee performance dashboard shows one person only their own numbers. This "My performance" example shows my revenue of $68,400 against $75,000, quota attainment of 91% on a gauge, 17 won deals against 18 and 22 meetings booked against a goal of 20 this month.
A line chart compares "My won deals per day" with the team average, a column chart shows this week's activities (214 calls, 168 emails, 6 meetings, 4 demos and 3 proposals), and a funnel called "My pipeline" runs from 42 qualified to 27 demos, 17 proposals and 10 won, a 24% conversion, split by product line.
A rep who sees this does not need to ask where they stand. It also gives the manager a shared page to open in a one-on-one. The full story on coaching and training covers the meeting side.
Which sales performance metrics should the dashboard track?
Pick a few from each group. Activity numbers show effort, outcome numbers show results, efficiency numbers show how well the two connect.
Activity metrics
Calls, emails and meetings per rep show effort and are the numbers a rep can change today. See also number of emails sent and booked meetings.
Outcome metrics
Won deals and revenue against quota show whether the effort paid off. Add number of lost deals to see what slipped away.
Efficiency metrics
Win rate = won deals ÷ closed deals × 100. Pair it with average deal size and average sales cycle length to see quality, not just volume.
For more ideas, read our guide to sales KPIs. Start with six to eight metrics in total, so the screen stays readable from across the room.
Team vs individual sales performance dashboard: which view for whom?
Team performance dashboard for managers and the office screen
A team performance dashboard answers "are we on track?" It works best on a TV, where everyone sees quota attainment and the leaderboard. Managers can filter or build one dashboard per team, and sales manager dashboards go further into the manager view.
Individual performance dashboard for each rep
An individual view answers "where do I stand?" and "what should I do next?" Plecto's dynamic dashboards show the data of whoever is viewing, so you build one dashboard instead of one per rep. Dynamic dashboards are an add-on, so check pricing or ask your account manager.
Use it in coaching
Bring the rep's dashboard into a one-on-one. One-on-ones in Plecto are confidential between manager and employee, and performance agreements let a team manager agree a formula-based target with a rep and follow progress together. Only the manager and the employee see the agreement. Most teams run both views side by side: the team screen on the wall, and the personal view on each rep's laptop or phone, so the same numbers support the daily routine and the weekly conversation. For a deeper look at tracking people over time, read our performance tracking guide.
Sales performance metrics at a glance: what each tells a manager
| Metric | What it tells a sales manager | Where the data comes from |
|---|---|---|
| Revenue vs quota | Whether the month is on track | CRM, such as Salesforce, HubSpot or Pipedrive |
| Number of won deals | Output per rep and per team | CRM |
| Win rate | How well activity converts into deals | CRM |
| Average deal size | Whether reps close small or large deals | CRM |
| Calls | Outbound effort and talk activity | Phone system, such as Aircall or RingCentral |
| Meetings booked | Quality of prospecting | CRM or calendar |
| Proposals sent | Pipeline movement before closing | CRM |
Plecto has 150+ integrations, so browse the list to check your CRM and phone system. Data can also come from spreadsheets, a database or the API.
How to build a sales performance dashboard in Plecto
- Connect your CRM. Go to Data sources > New data source and pick your CRM or phone system. Choose which fields to import and how much history to bring in.
- Create your KPIs. Go to Formulas > New formula and build revenue, won deals, win rate or calls. See custom KPIs for how formulas work.
- Build the dashboard. Go to Dashboards > New dashboard. Use the Dashboard Builder for a quick start, or add widgets yourself: number boxes and a speedometer for quota, a leaderboard for revenue by rep, and a table for the per-rep comparison.
- Add conditional colors. Number boxes and table columns support conditional colors, so green, yellow and red show where each rep stands.
- Show it where people look. Add the dashboard to a slideshow for a TV, or use the Plecto mobile app. Reports can send the numbers by email.
- Add motivation. Use gamification such as contests, achievements and notifications to celebrate wins. Contests and the Reward Store are on the Large and Enterprise plans.
Plecto offers a 14-day free trial with no credit card required. See the full sales dashboards page or the wider business dashboard overview for other performance dashboards.
Sales Performance Dashboard FAQ
A sales performance dashboard should include revenue against quota, number of won deals, win rate and average deal size, plus activity numbers such as calls and meetings booked. Add a per-rep table or leaderboard so the team can compare themselves, and use targets with colors so status is clear at a glance.
Plecto is a sales performance management platform that combines real-time KPI dashboards, gamification and coaching in one tool. It connects to your CRM and phone system, tracks quota and activity for every rep, and adds contests, one-on-ones and performance agreements. For other options, see our sales performance management software roundup.
A sales dashboard is the broad term and can show pipeline, forecasts, leads or revenue. A sales performance dashboard focuses on how people and teams perform against targets: quota attainment, activity, win rate and rankings. Most teams use both, with the performance view on a TV and deeper dashboards for managers.
Match each CRM and phone record to the rep who owns it, then show one row per rep with calls, meetings, won deals, win rate and revenue. Add targets and conditional colors. Plecto can also give each rep a personal view, and a team manager can agree a performance agreement with a target for one KPI.
An employee performance dashboard shows one person their own KPIs against their targets, such as revenue, won deals, activities and pipeline conversion. In Plecto, dynamic dashboards display the data of whoever views them, so a single dashboard serves the whole team. It is typically used for self-management and one-on-ones.
It depends on your culture. Open leaderboards can motivate competitive teams and make good habits visible, but they can discourage reps who are new or on tough accounts. A balanced setup shows the team total and a top ranking on the TV, while keeping personal targets and coaching notes between manager and rep.
It should update often enough that reps can act on it during the day. Update speed depends on the data source: some systems send changes instantly, others sync on a schedule. Check the integration page for your CRM and phone system, then match the dashboard time period to the decision, such as today or this month.